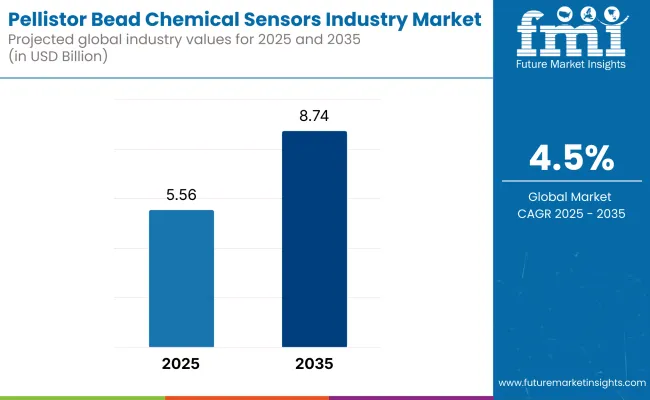
The global pellistor bead chemical sensors industry is estimated to account for USD 5.56 billion in 2025. It is anticipated to grow at a CAGR of 4.5% during the assessment period and reach a value of USD 8.74 billion by 2035.

In 2024, the global pellistor bead chemical sensors industry grew steadily on the back of increased safety norms and the growing deployment of gas detection solutions across sectors like oil and gas, petrochemicals, and utilities. One of the major developments was the inclusion of IoT-enabled pellistor sensors that enabled real-time monitoring of gas and predictive maintenance, substantially boosting operational efficiency.
In addition, the development of sensor materials and signal processing enhanced the response time and sensitivity of these sensors, making them more dependable for sensing combustible gases such as methane. The year also witnessed a high demand for portable gas detectors, especially in dangerous environments, as industries placed a high premium on worker safety.
Forward to 2025 and beyond, the industry is likely to continue its growth pattern, spurred by continued investments in energy infrastructure and renewable energy developments. The growth of industrial activity in emerging industries, together with increasing environmental regulation, will further propel the demand for pellistor bead Chemical sensors.
Advances in sensor technology, including greater selectivity and miniaturization, will in turn create new opportunities in environmental monitoring and smart city applications. By 2035, the industry is expected to grow to USD 8.74 billion, with IoT integration and mobile solutions being major growth drivers.
FMI Survey Data: Forces as Performed Through Stakeholders' Views
Stakeholders' Topmost Concerns
Adoption of Advanced Technologies
Material Preferences
Price Sensitivity
Pain Points in the Value Chain
Future Investment Priorities
Regulatory Impact
Conclusion: Variance vs. Consensus
| Country/Region | Impact of Policies and Mandatory Certifications |
|---|---|
| United States | The Occupational Safety and Health Administration (OSHA) enforces regulations requiring the use of gas detection systems in hazardous environments to ensure worker safety. Pellistor sensors must comply with standards such as those set by the National Fire Protection Association (NFPA). |
| European Union | The EU enforces the ATEX directive (Atmosphères Explosibles), which mandates that equipment used in explosive atmospheres, including pellistor sensors, must be certified for safety. Compliance with the IECEx system is also recognized, facilitating international trade. |
| United Kingdom | Post-Brexit, the UK has introduced the UKCA (UK Conformity Assessed) marking, which has replaced the CE marking for products sold in Great Britain. Equipment like pellistor sensors must adhere to these new standards to be legally marketed. |
| Australia | Australia recognizes the IECEx certification system for equipment used in explosive atmospheres. Compliance with these international standards ensures that pellistor sensors meet safety requirements. |
| China | China requires products used in explosive atmospheres to obtain China Compulsory Certification (CCC). Pellistor sensors must meet these national standards to be approved for use. |
| India | The Petroleum and Explosives Safety Organization (PESO) oversees regulations concerning explosive atmospheres. Equipment like pellistor sensors must receive PESO certification to be utilized in hazardous environments. |
| 2020 to 2024 | 2025 to 2035 |
|---|---|
| The global industry experienced steady growth during this period, driven by increasing industrial applications, heightened environmental monitoring efforts, and stringent safety regulations. The size was valued at approximately USD 6.6 billion in 2023, with a compound annual growth rate (CAGR) of around 8.3%. | The industry is projected to maintain its growth trajectory, reaching an estimated USD 8 billion by 2033, with a CAGR of 4.5% from 2023 to 2033. |
| Key applications included industrial gas monitoring, automotive emission control, and indoor air quality monitoring. | This growth is anticipated to be driven by advancements in sensor technology, expanding applications in healthcare and environmental sectors, and increasing demand for air quality monitoring solutions. |
| North America led the industry, followed by Europe and the Asia-Pacific region. | The Asia-Pacific region is expected to witness significant growth due to rapid industrialization and urbanization, while North America and Europe will continue to be key industries owing to stringent regulatory standards. |
Pellistor detector beads are used more than compensator beads because of their main function as combustible gas detectors. Detector beads are designed to respond to target gases and produce a measurable resistance change that indicates gas concentration.
This is a critical function to offer protection in oil and gas, petrochemical, and mining applications where combustible gas presence must be sensed to prevent accidents and protect personnel. Compensator beads, by contrast, serve mainly to take into consideration external conditions such as temperature and humidity to ensure proper readings from the detector bead.
The most widespread use of pellistor bead chemical sensors is in industry, mainly due to the fact that they help ensure safety and compliance in dangerous environments. The sensors are widely applied in oil and gas, petrochemical, mining, and manufacturing industries for the detection and monitoring of combustible gases like methane, propane, and hydrogen.
The need for precise gas sensing in such situations is necessitated by stringent safety requirements and potential catastrophic accidents unless gas leaks are sensed. Pellistor bead sensors are used on account of ruggedness, responsiveness, and suitability for effective operations in aggressive industrial settings.

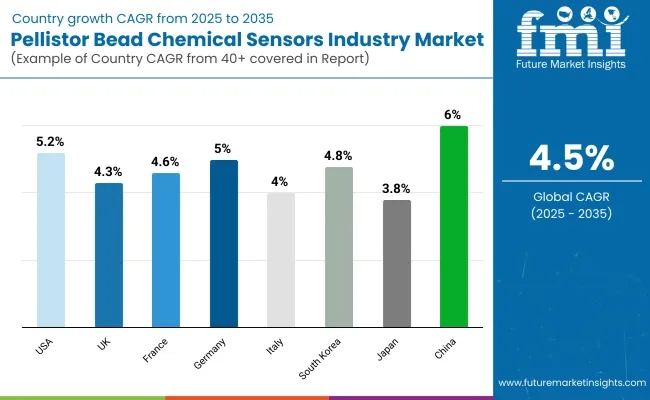
| Countries | CAGR |
|---|---|
| USA | 5.2% |
| UK | 4.3% |
| France | 4.6% |
| Germany | 5.0% |
| Italy | 4.0% |
| South Korea | 4.8% |
| Japan | 3.8% |
| China | 6.0% |
The USA is projected to expand at a CAGR of 5.2% over 2025 to 2035, marginally higher than the global average of 4.5%, supported by its strong industrial base and strict safety regulations. The oil and gas sector, as a major end-user of pellistor bead sensors, is itself a growth driver, particularly with rising shale gas exploration and renewable energy programs. Also, demand is rising from IoT-based gas detection systems for smart industry and manufacturing facilities, further driving demand.
The USA also possesses a strong R&D ecosystem, leading to enhanced sensor technology, such as higher sensitivity and selectivity. However, semiconductor shortages and supply chain disruptions could curb growth in the near term. Overall, the USA industry will be growing consistently with the support of its focus on workplace security and technology.
The UK will develop at a CAGR of 4.3%, slightly lower than the global growth rate, owing to its established manufacturing industry and economic development being comparatively slower than in developing countries.
Nonetheless, the UK's strong emphasis on occupational safety and environmental quality will continue to stimulate the need for pellistor bead sensors, particularly within the oil and gas, chemical, and utility sectors. The transition to renewable energy, including offshore wind farms, will also create opportunities for gas detection technologies.
Threats are Brexit-related trade barriers and economic uncertainties, which may impact industrial investments. Despite these threats, the UK's focus on innovation and sustainability will drive moderate growth in the pellistor bead sensor industry.
France would most probably attain a CAGR of 4.6%, which is narrowly missing the international average. Its industrial economy, particularly chemical and manufacturing industries, will drive the demand for pellistor bead sensors. Its commitment towards maintaining the environment clean and invariable safety legislation also will make greater adoption feasible across industries like oil and gas, utilities, and wastewater treatment.
Increased emphasis on renewable energy projects, including hydrogen production, will also present new opportunities for gas detection technologies. High labor costs and regulatory issues could be a challenge, however. Generally, France's industry will be helped by its focus on safety and sustainability, providing consistent growth.
Germany is expected to expand at a CAGR of 5.0%, above the world average, due to its highly developed industrial base and technological innovation leadership. The strong focus on workplace safety, particularly in industries like chemicals, automotive, and manufacturing, will drive the pellistor bead sensor demand.
Germany's move towards renewable sources of energy, including hydrogen and biogas, will also boost the industry. In addition, the fusion of IoT and AI into gas detection systems is also picking up pace, enhancing the precision and efficiency of sensors. There are issues of high production costs and regulatory complexity, but the strong industrial base and innovation-based economy of Germany will cause it to grow strongly.
Italy will increase at a CAGR of 4.0%, slightly below the global average, as it has slower economic growth and a reduced industrial sector when compared to other European nations. The nation's oil and gas, chemical, and manufacturing sectors will continue to require pellistor bead sensors, however. Italy's focus on job site safety and EU regulatory issues will also drive usage.
Economically unstable growth and high cost of production will pose challenges. Italy's industry, however, will be positively influenced by the process of industrial modernization at a slow pace and the embracement of extremely advanced gas sensing technologies.
South Korea is also expected to grow with a CAGR of 4.8% owing to its strong industrial backbone and focus on innovation through technology. Manufacturing, chemical, and petrochemical sectors are principal consumers of pellistor bead sensors. The South Korean orientation toward factory as well as occupational industrial safety, coupled with surveillance, will again add fuel to demand further.
One other significant aspect is growing utilization of IoT and AI technologies in the form of gas detection solutions for intelligent factories. High price sensitivity and high competition are challenges but will be ensured against by the nation's focus on industrialization and technology.
Japan will expand at a CAGR of 3.8% over the global average due to its industrialized base and the lower rate of economic growth. Its utilities, manufacturing, and chemical industries will continue to require pellistor bead sensors.
Its dedication to occupational safety and environmental regulation will also drive demand. High costs of production also exist, and there is a propensity to resist innovation and utilize traditional gas detection methods rather than innovative technologies. Despite these disadvantages, Japan's manufacturing will be accelerated by gradual modernization and IoT-capable sensor adoption.
China will expand by 6.0% CAGR, several times the global average, as a result of its rapid industrialization and an increasing energy sector. The country's manufacturing, chemicals, and oil and gas sectors are the key drivers of growth. China's focus on industrial workplace safety and environmental monitoring will also drive demand for pellistor bead sensors.
Additionally, IoT and AI integration in gas detection systems is on the rise. Challenges like regulatory barriers and cheap manufacturer competition will be handled by the large industrial base of China and focus on innovation, thus generating strong growth.
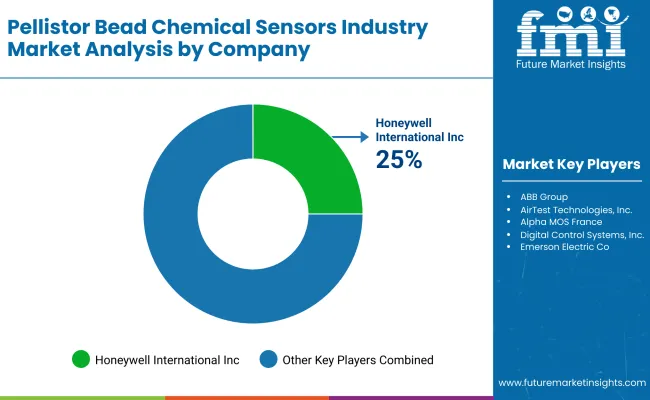
Honeywell International Inc.: (25%)

Honeywell leads the pellistor bead chemical sensors sector with its established brand recognition and wide portfolio of products. Honeywell has been able to hold its lead by focusing on IoT-capable gas detection technologies and advanced sensor technologies. Honeywell's sensors are well established in the oil and gas, chemical, and manufacturing industries. Its extensive worldwide distribution network and commitment to safety compliance contribute to its share.
Key Strategies:
MSA Safety Incorporated: (20%)
MSA Safety is a dominant player with quality gas detection solutions. The company's pellistor bead sensors are widely applied in hazardous environments, particularly oil and gas and mining sectors. MSA's focus on durability, reliability, and compliance with international safety standards has helped the company acquire a significant share.
Key Strategies:
Drägerwerk AG & Co. KGaA: (15%)
Drägerwerk is a leading firm that provides safety technology, such as pellistor bead chemical sensors. The company's sensors find widespread application in industrial and medical fields. Dräger's emphasis on innovation, such as AI-based gas detection systems, has helped it maintain a strong industry position.
Key Strategies:
Teledyne Technologies Incorporated: (12%)
Teledyne Technologies is a dominant player in the industry, offering a wide range of gas detection products. The company's sensors are extremely accurate and reliable, because of which they are popularly used for environmental monitoring and industrial safety-related applications.
Key Strategies:
Figaro Engineering Inc.: (10%)
Figaro Engineering is a leading manufacturer of gas sensors, such as pellistor bead chemical sensors. Its sensors have widespread use across industrial and consumer markets. Figaro's low-cost and compact design focus has helped it capture a leadership share in low-cost-sensitive industries like Asia.
Key Strategies:
The macroeconomic drivers affecting the pellistor bead chemical sensors industries are industrial growth, energy demand, and regulatory norms. The worldwide focus on industrial safety, fueled by more stringent occupational health and safety regulations, remains a major market growth driver. The oil and gas, chemical, and mining industries are key end-user industries with increased investments in infrastructure and renewable energy schemes further driving demand.
Emerging economic growth in Asia-Pacific and the Middle East is generating new business opportunities for gas detection technologies. Rising material prices, semiconductor shortages, and supply chain shortages are hindrances to growth. Fluctuating energy prices and geopolitical tensions also affect industrial investments, and therefore, indirectly influence the demand for gas detection solutions.
With respect to components, it is classified into detector and compensator.
In terms of end-use industry, it is divided into healthcare, automotive, industrial, environmental monitoring, defense, and others.
In terms of region, it is segmented into North America, Latin America, Europe, East Asia, South Asia, Oceania, and MEA.
They detect and monitor combustible gases in industrial, environmental, and safety applications.
Oil and gas, petrochemicals, mining, utilities, and manufacturing are the biggest users.
Technological advancements enhance sensitivity, selectivity, response speed, and IoT integration for real-time detection.
The increasing cost of materials, semiconductor shortages, and regulatory compliance difficulties are prime challenges.
They prevent accidents by sensing gas leaks and adhering to safety regulations.


Full Research Suite comprises of:
Market outlook & trends analysis
Interviews & case studies
Strategic recommendations
Vendor profiles & capabilities analysis
5-year forecasts
8 regions and 60+ country-level data splits
Market segment data splits
12 months of continuous data updates
DELIVERED AS:
PDF EXCEL ONLINE
Bead Winding Machine Market Analysis Based on Configuration, Application, and Region 2025 to 2035
Edge Bead Remover (EBR) Market Size and Share Forecast Outlook 2025 to 2035
Magnetic Beads Market
Cell Separation Beads Market
Multi Colored LED Beads Market Size and Share Forecast Outlook 2025 to 2035
Biodegradable Microbeads Market Growth – Trends & Forecast 2025 to 2035
Industry Analysis of Outbound Tourism in Germany Size and Share Forecast Outlook 2025 to 2035
Industry Analysis of Syringe and Needle in GCC Size and Share Forecast Outlook 2025 to 2035
Industry Analysis Non-commercial Acrylic Paint in the United States Size and Share Forecast Outlook 2025 to 2035
Industry Analysis of Medical Device Packaging in Southeast Asia Size and Share Forecast Outlook 2025 to 2035
Industry Analysis of Paper Bag in North America Size and Share Forecast Outlook 2025 to 2035
Industry Analysis of Lidding Film in the United States Size and Share Forecast Outlook 2025 to 2035
Industry Analysis of Last-mile Delivery Software in Japan Size and Share Forecast Outlook 2025 to 2035
Industry Analysis of Automotive Lightweight Body Panel in the United States Size and Share Forecast Outlook 2025 to 2035
Industry Analysis of Electronic Skin in Japan Size and Share Forecast Outlook 2025 to 2035
Industry Analysis of Electronic Skin in Korea Size and Share Forecast Outlook 2025 to 2035
Industry Analysis of Electronic Skin in Western Europe Size and Share Forecast Outlook 2025 to 2035
Industry 4.0 Market
Europe Second-hand Apparel Market Growth – Trends & Forecast 2024-2034
DOAS Industry Analysis in the United States Forecast and Outlook 2025 to 2035

Thank you!
You will receive an email from our Business Development Manager. Please be sure to check your SPAM/JUNK folder too.
Chat With
MaRIA