


Peanut Milk Market : Global Industry Analysis and Opportunity Assessment, 2036
Peanut Milk Market is segmented by Product (Conventional, Organic), Sales Channel (Food Processing Industry, Bakery, Confectionery, Ice Cream and Desserts, Beverages, Protein Bars, Cereals, Food Service Providers, Retail and Household), Price Range (Mid Range, Economic, Premium), and Region. Forecast for 2026 to 2036.
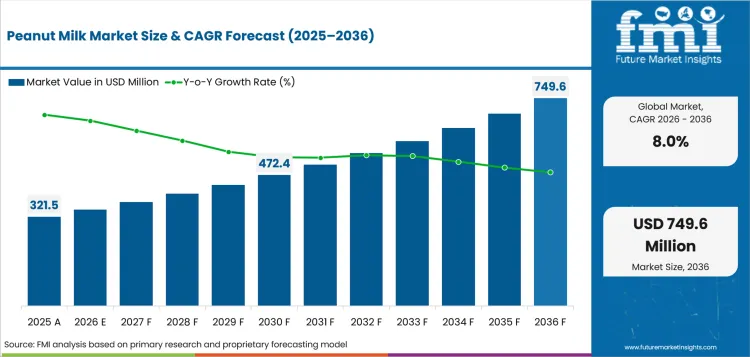
- Market Size (2026): USD 347.2 Mn
- Forecast (2036): USD 749.6 Mn
- CAGR (2026 to 2036): 8.0%
Peanut Milk Market Size, Market Forecast and Outlook By FMI
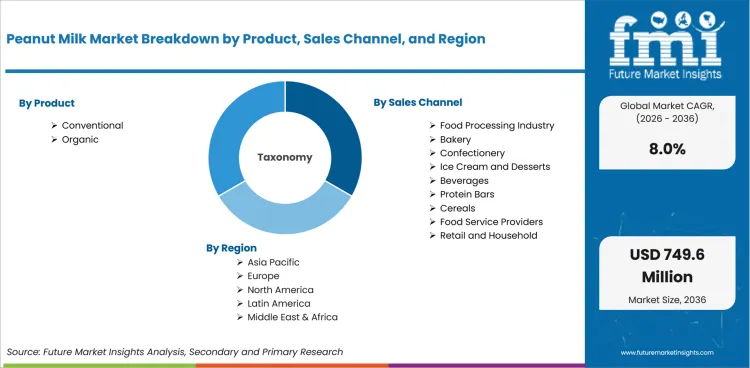
The peanut milk market was valued at USD 321.5 million in 2025. The market is set to reach USD 347.2 million by 2026-end and grow at a CAGR of 8.0% between 2026-2036 to reach USD 749.6 million by 2036. Conventional will dominate with a 64.0% share, while Food Processing Industry will lead with a 28.0% share.
Summary of the Peanut Milk Market
- Demand and Growth Drivers
- Plant based dairy alternative demand is supporting procurement of peanut milk as consumers seek protein rich, allergen diversified options beyond soy and almond based products.
- Food processing industry adoption is expanding the B2B addressable market as peanut milk enters bakery, confectionery, and frozen dessert formulations as a functional ingredient.
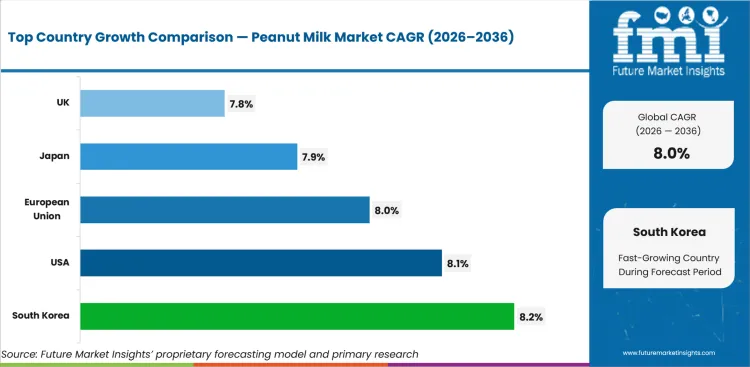
- South Korea (8.2%) and the USA (8.1%) lead country level growth, supported by plant based category expansion and retail distribution development.
- Product and Segment View
- Conventional is expected to lead the product segment with 64.0% share in 2026, supported by established procurement patterns and broad application coverage.
- Food Processing Industry accounts for 28.0% of the sales channel segment, reflecting concentrated demand in core application categories.
- Mid Range leads the price range segment at 43.0% share, supported by established channel infrastructure.
- Geography and Competitive Outlook
- South Korea is expected to lead country level growth at 8.2% CAGR through 2036, supported by strong domestic demand and established supply infrastructure.
- USA follows at 8.1% CAGR, reflecting expanding procurement across key end use segments.
- Companies with established manufacturing capacity, broad product portfolios, and strong distributor relationships are positioned to capture the largest share of incremental demand.
- Analyst Opinion
- The peanut milk market is evolving toward more specification driven procurement where formulation capability, supply chain reliability, and regulatory compliance determine competitive positioning.
- Adoption is increasing due to end user demand for performance validated inputs and regulatory requirements across core application segments.
- Companies that combine cost competitiveness with consistent quality across multiple regions are positioned to strengthen their market position over the forecast period.
- Demand is further supported by procurement stability in established end use sectors and incremental volume from emerging application categories.
Peanut Milk Market Definition
The peanut milk market includes conventional and organic peanut milk products used as dairy alternatives in direct consumer consumption and food processing applications. Products are available in plastic and glass bottles, pouches, carton packaging, and cans across mid range, economic, and premium price segments.
Peanut Milk Market Inclusions
Market scope covers all commercially traded peanut milk products categorized by product (conventional, organic), sales channel (food processing industry, bakery, confectionery, ice cream and desserts, beverages, protein bars, cereals, food service providers, retail and household), price range (mid range, economic, premium), distribution channel (store based retailing, convenience stores, specialty stores, HoReCa, independent small groceries, online retailing), and packaging (plastic and glass bottles, pouches, carton packaging, cans). Revenue estimates span from 2026 to 2036.
Peanut Milk Market Exclusions
The scope does not include peanut butter, peanut oil, or other peanut derived food products outside the liquid milk alternative category. Soy milk, almond milk, oat milk, and other non peanut plant based milks are excluded.
Peanut Milk Market Research Methodology
- Primary Research: FMI analysts conducted interviews with manufacturers, distributors, and end users across key markets to validate demand drivers and procurement patterns.
- Desk Research: Combined data from industry associations, regulatory filings, trade databases, and manufacturer disclosures.
- Market Sizing and Forecasting: Bottom up aggregation across product, application, and regional segments, triangulated with top down validation against industry production data.
- Data Validation: Cross checked quarterly against production statistics, trade data, and manufacturer reported figures.
Why is the Peanut Milk Market Growing?
- Plant based dairy alternative demand is supporting procurement of peanut milk as consumers seek protein rich, allergen diversified options beyond soy and almond based products.
- Food processing industry adoption is expanding the B2B addressable market as peanut milk enters bakery, confectionery, and frozen dessert formulations as a functional ingredient.
- South Korea (8.2%) and the USA (8.1%) lead country level growth, supported by plant based category expansion and retail distribution development.
The peanut milk market is expanding as plant based dairy alternatives gain broader consumer acceptance and distribution access. Conventional peanut milk accounts for 64.0% of product share, reflecting price competitiveness and established supply chains relative to organic variants. Organic peanut milk serves the premium segment where consumers prioritize certified production methods and ingredient traceability.
The food processing industry represents 28.0% of sales channel demand, with industrial food manufacturers, commercial bakeries, and bulk ingredient buyers driving B2B procurement. Peanut milk's protein content, flavor profile, and emulsification properties make it a functional ingredient in bakery, confectionery, ice cream, and beverage formulations beyond direct consumer consumption.
Distribution channel development is critical to growth. Store based retailing holds 39.0% share through hypermarkets and supermarkets, while convenience stores and specialty health food stores provide targeted access. Online retailing through e commerce platforms and brand websites is the fastest growing channel, particularly in markets where plant based category awareness is still developing.
Market Segmentation Analysis
- The peanut milk market is segmented by product, sales channel, price range, distribution channel, packaging, with conventional leading the product segment at 64.0% share.
- Food Processing Industry accounts for 28.0% of the sales channel segment, reflecting concentrated demand in primary use cases.
- Store Based Retailing leads the distribution channel segment at 39.0%, indicating established procurement patterns.
The peanut milk market is organized across multiple segmentation dimensions that reflect product differentiation, application requirements, and procurement channel preferences.
Insights into the Conventional Product Segment
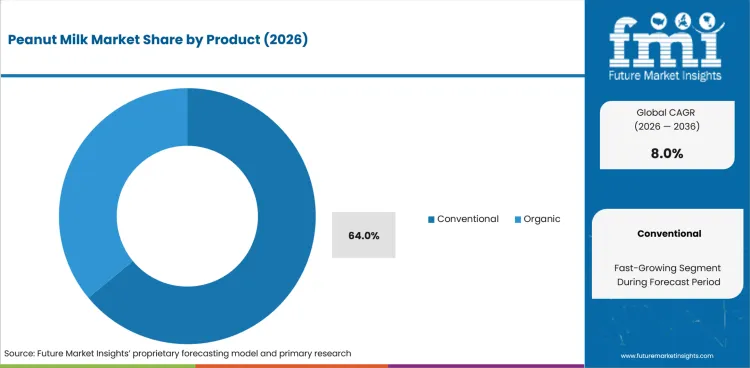
In 2026, conventional is expected to account for 64.0% of the product segment. This position reflects established procurement patterns across key end use categories.
Insights into the Food Processing Industry Sales Channel Segment
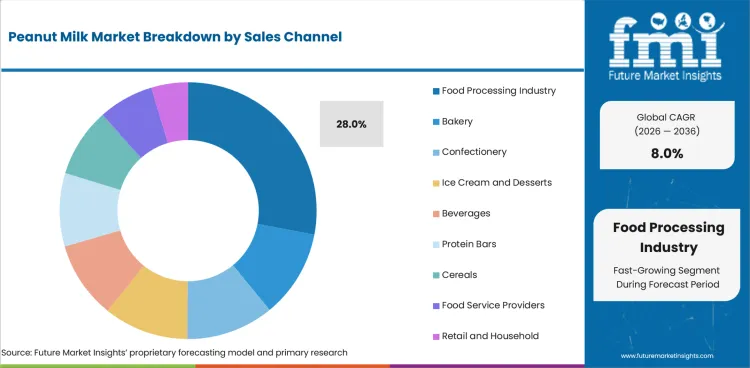
In 2026, food processing industry is expected to account for 28.0% of the sales channel segment. This position reflects established procurement patterns across key end use categories.
Sub segments including Industrial Food Manufacturers, Bulk Ingredient Buyers, Commercial Bakeries represent the primary specification categories within this segment, each serving distinct requirements.
Peanut Milk Market Drivers, Restraints, and Opportunities
- Demand is shaped by consumer migration toward plant based dairy alternatives, with peanut milk positioned as a protein r.
- Adoption is constrained by peanut allergen prevalence, which limits consumption among allergic populations and creates l.
- Growth is supported by mid range pricing that positions peanut milk as accessible within the plant based category. Expan.
The peanut milk market is shaped by demand side drivers, supply side constraints, and regulatory influences that vary by region and application segment.
Plant Based Category Expansion and Protein Positioning
Demand is shaped by consumer migration toward plant based dairy alternatives, with peanut milk positioned as a protein rich option that differentiates from almond and oat based competitors. Peanut milk's natural protein content supports positioning in sports nutrition and functional beverage applications.
Food Processing Industry as B2B Demand Layer
Growth reflects expanding use of peanut milk as a functional ingredient in commercial bakery, confectionery, frozen dessert, and beverage manufacturing. B2B procurement through industrial food manufacturers creates volume demand beyond retail consumer channels.
Peanut Allergen Concerns and Regulatory Labeling
Adoption is constrained by peanut allergen prevalence, which limits consumption among allergic populations and creates labeling and cross contamination compliance requirements for manufacturers and food service operators.
Mid Range Pricing and Retail Distribution Expansion
Growth is supported by mid range pricing that positions peanut milk as accessible within the plant based category. Expanding retail shelf space in hypermarkets and convenience stores improves physical availability in emerging markets.
Analysis of Peanut Milk Market By Key Countries
.webp "Top Country Growth Comparison Peanut Milk Market Cagr (2026 2036)")
| Country | CAGR |
|---|---|
| South Korea | 8.2% |
| Japan | 7.9% |
| USA | 8.1% |
| European Union | 8.0% |
| UK | 7.8% |
- South Korea at 8.2% CAGR through 2036 reflects strong demand fundamentals and procurement infrastructure.
- Japan at 7.9% CAGR through 2036 reflects strong demand fundamentals and procurement infrastructure.
- USA at 8.1% CAGR through 2036 reflects strong demand fundamentals and procurement infrastructure.
The global peanut milk market is projected to grow at a CAGR of 8.0% from 2026 to 2036. The analysis covers more than 30 countries.
Demand Outlook for Peanut Milk Market in South Korea
South Korea is projected to grow at 8.2% through 2036. Demand is concentrated in the expanding plant based beverage category as health conscious consumers seek protein rich dairy alternatives. South Korea's established convenience store network and premium beverage culture support rapid product trial and repeat purchase.
- Health conscious consumer demographics support adoption of protein rich plant based dairy alternatives.
- Convenience store and premium beverage retail networks provide efficient distribution for new product introductions.
- Food service sector procurement is expanding as cafes and restaurants add peanut milk to plant based menu options.
Opportunity Analysis of Peanut Milk Market in Japan
Japan is projected to grow at 7.9% through 2036. Demand reflects growing consumer interest in plant based nutrition, supported by established functional beverage culture. Japanese consumers prioritize taste quality and nutritional credentials, which supports premium positioning for peanut milk products.
- Functional beverage culture supports premium positioning of peanut milk with health and nutrition credentials.
- Convenience store distribution provides high traffic retail access for single serve peanut milk products.
- Food manufacturers are exploring peanut milk as an ingredient in traditional confectionery and dessert reformulations.
Future Outlook for Peanut Milk Market in the United States
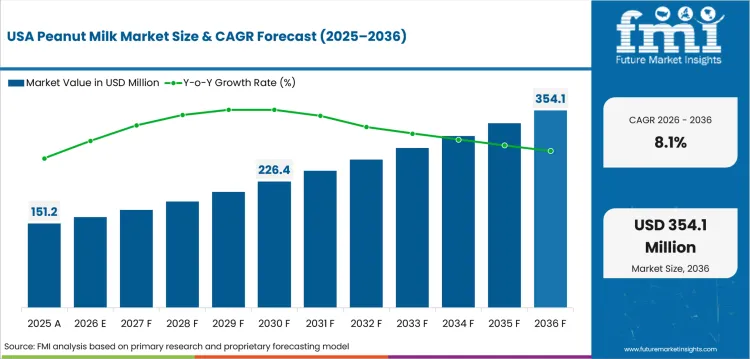
USA is projected to grow at 8.1% through 2036. Demand is shaped by plant based category maturation and consumer interest in allergen diversified dairy alternatives beyond almond and oat milk. Retail distribution expansion across major grocery chains and natural food stores is improving consumer access.
- Plant based category expansion across major grocery retailers is improving consumer access and brand visibility.
- Sports nutrition and functional beverage brands are incorporating peanut milk for its natural protein content.
- Food service operators are adding peanut milk as a dairy alternative option in coffee shops and restaurant menus.
In-depth Analysis of Peanut Milk Market in the European Union
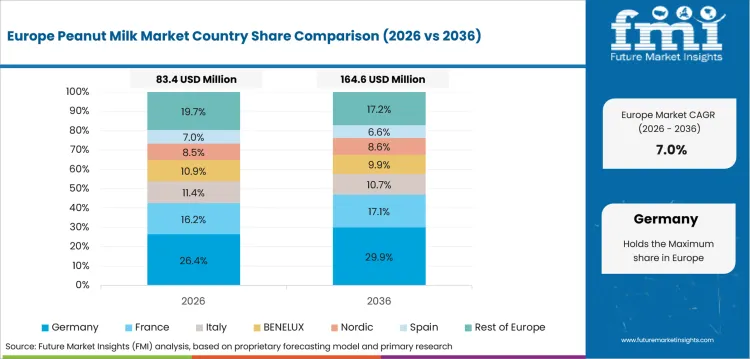
European Union is projected to grow at 8.0% through 2036. EU food labeling regulations and plant based dietary trends are shaping market development. Allergen labeling requirements are clearly defined, which supports consumer informed purchasing. Organic certification demand across Germany and France creates a premium segment opportunity.
- EU allergen labeling regulations provide clear consumer information that supports informed purchasing decisions.
- Organic certification demand across Western European markets creates premium segment procurement opportunities.
- Plant based dietary trends among younger demographics are expanding the addressable consumer base.
Sales Analysis of Peanut Milk Market in the United Kingdom
UK is projected to grow at 7.8% through 2036. Demand reflects established plant based consumption patterns and expanding retail distribution. The UK's mature plant based category provides consumer familiarity that reduces education barriers for peanut milk adoption.
- Mature plant based dairy alternative category provides consumer familiarity that supports peanut milk trial.
- Supermarket own label plant based ranges are expanding to include peanut milk variants.
- Coffee shop and food service adoption is providing consumer trial opportunities outside traditional retail.
Competitive Landscape and Strategic Positioning
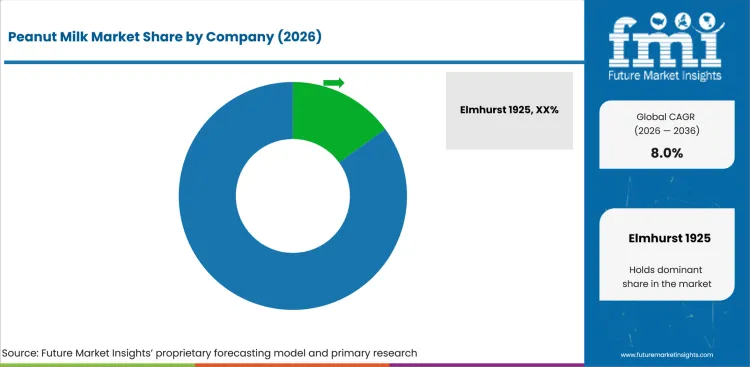
- Elmhurst 1925 leads the market with established manufacturing infrastructure and distributor relationships.
- Nestlé (Wunda) and Yili Group maintain competitive positions through product breadth and regional access.
- Emerging players are targeting specialized segments where technical differentiation creates entry opportunities.
Elmhurst 1925 maintains a strong position through integrated capabilities and established procurement relationships. Product portfolio breadth, distribution coverage, and formulation expertise define competitive differentiation.
Barriers include established supply relationships, regulatory compliance costs, and manufacturing capital intensity. Strategic priorities include cost optimization, geographic expansion, and product innovation.
Key Companies in the Peanut Milk Market
Key global companies leading the peanut milk market include:
- Elmhurst 1925, Nestlé (Wunda), Yili Group maintain leading positions through integrated manufacturing and established end user relationships.
- Ripple Foods, Vitasoy International have established segment specific positions through specialized offerings.
Competitive Benchmarking: Peanut Milk Market
| Company | Product Breadth | Manufacturing Scale | Distribution Reach | Geographic Footprint |
|---|---|---|---|---|
| Elmhurst 1925 | High | Strong | Strong | Global |
| Nestlé (Wunda) | High | Medium | Strong | Global |
| Yili Group | Medium | High | Moderate | Regional |
| Ripple Foods | Medium | Medium | Moderate | Regional |
| Vitasoy International | Low | Medium | Low | Regional |
Source: Future Market Insights competitive analysis, 2026.
Key Developments in Peanut Milk Market
- In 2025, Elmhurst 1925 expanded manufacturing capacity and distribution for conventional products across key markets.
- In 2025, Nestlé (Wunda) introduced new product formulations targeting emerging application segments.
Key Players in the Peanut Milk Market
Major Global Players
- Elmhurst 1925
- Nestlé (Wunda)
- Yili Group
- Ripple Foods
- Vitasoy International
Emerging Players/Startups
- Ripple Foods
- Vitasoy International
- Other Regional Suppliers
Report Scope and Coverage
| Parameter | Details |
|---|---|
| Quantitative Units | USD 347.22 million to USD 749.62 million, at a CAGR of 8.0% |
| Market Definition | The peanut milk market includes conventional and organic peanut milk products used as dairy alternatives in direct consumer consumption and food processing applications. Products are available in plastic and glass bottles, pouches, carton packaging, and cans across mid range, economic, and premium price segments. |
| Regions Covered | North America, Latin America, Europe, East Asia, South Asia and Pacific, Middle East and Africa |
| Countries Covered | South Korea, Japan, USA, European Union, UK, 30 plus countries |
| Key Companies Profiled | Elmhurst 1925, Nestlé (Wunda), Yili Group, Ripple Foods, Vitasoy International |
| Forecast Period | 2026 to 2036 |
| Approach | Hybrid bottom up and top down methodology starting with verified transaction data, projecting adoption velocity across segments and regions. |
Segmentation
Peanut Milk Market Segmented by Product:
- Conventional
- Organic
Peanut Milk Market Segmented by Sales Channel:
- Food Processing Industry
- Industrial Food Manufacturers
- Bulk Ingredient Buyers
- Bakery
- Commercial Bakeries
- Artisan Bakeries
- Confectionery
- Chocolate Manufacturers
- Sugar Confectionery Producers
- Ice Cream and Desserts
- Frozen Dessert Producers
- Dessert Processing Units
- Beverages
- Functional Beverage Producers
- Soft Drink Manufacturers
- Protein Bars
- Sports Nutrition Bars
- Meal Replacement Bars
- Cereals
- Breakfast Cereals
- Fortified Grain Products
- Food Service Providers
- Restaurants
- Cafes and Catering Services
- Retail and Household
- Direct Consumer Usage
- Home Baking Applications
Peanut Milk Market Segmented by Price Range:
- Mid Range
- Standard Quality Products
- Value Added Products
- Economic
- Mass Market Products
- Low Cost Supply
- Premium
- Organic Premium Products
- High Purity Specialty Products
Peanut Milk Market Segmented by Distribution Channel:
- Store Based Retailing
- Hypermarkets
- Supermarkets
- Convenience Stores
- Urban Convenience Stores
- Local Grocery Chains
- Specialty Stores
- Health Food Stores
- Organic Product Stores
- HoReCa
- Hotels
- Restaurants and Cafes
- Independent Small Groceries
- Local Retail Shops
- Neighborhood Stores
- Online Retailing
- E Commerce Platforms
- Brand Websites
Peanut Milk Market Segmented by Packaging:
- Plastic and Glass Bottles
- Plastic Bottles
- Glass Bottles
- Pouches
- Stand Up Pouches
- Flexible Sachets
- Carton Packaging
- Tetra Cartons
- Paperboard Packs
- Cans
- Metal Cans
- Aluminum Containers
Peanut Milk Market by Region:
- North America
- USA
- Canada
- Mexico
- Latin America
- Brazil
- Chile
- Rest of Latin America
- Western Europe
- Germany
- UK
- Italy
- Spain
- France
- Nordic
- BENELUX
- Rest of Western Europe
- Eastern Europe
- Russia
- Poland
- Hungary
- Balkan & Baltic
- Rest of Eastern Europe
- East Asia
- China
- Japan
- South Korea
- South Asia and Pacific
- India
- ASEAN
- Australia & New Zealand
- Rest of South Asia and Pacific
- Middle East & Africa
- Kingdom of Saudi Arabia
- Other GCC Countries
- Turkiye
- South Africa
- Other African Union
- Rest of Middle East & Africa
Research Sources and Bibliography
- 1. Food and Agriculture Organization. (2025). FAO Plant Based Dairy Alternatives Production Report. FAO.
- 2. USA Department of Agriculture. (2025). USDA Peanut Production and Processing Statistics. USDA.
- 3. European Food Safety Authority. (2024). EFSA Allergen Labeling and Risk Assessment for Peanut Products. EFSA.
- 4. International Nut and Dried Fruit Council. (2025). INC Global Peanut Trade and Processing Report. INC.
- 5. World Health Organization. (2024). WHO Allergen Management Guidelines for Food Products. WHO.
This bibliography is provided for reader reference. The full Future Market Insights report contains the complete reference list with publication dates, URLs, and supporting data for all cited works.
This Report Answers
- Estimating the size of the market and revenue from 2026 to 2036.
- Segmentation by product, sales channel, price range, distribution channel.
- Insights about more than 30 markets by region.
- Analysis of key demand drivers, restraints, and growth opportunities.
- Assessment of the competitive landscape and company positioning.
- Identification of investment opportunities across key segments and regions.
- Supply chain and procurement pattern analysis.
- Delivery of data in PDF and Excel formats.
Frequently Asked Questions
How big is the peanut milk market in 2026?
The global peanut milk market is estimated to be valued at USD 347.2 million in 2026.
What will be the size of peanut milk market in 2036?
The market size for the peanut milk market is projected to reach USD 749.6 million by 2036.
How much will be the peanut milk market growth between 2026 and 2036?
The peanut milk market is expected to grow at a 8.0% CAGR between 2026 and 2036.
What are the key product types in the peanut milk market?
The key product types in peanut milk market are conventional and organic.
Which sales channel segment is expected to contribute significant share in the peanut milk market in 2026?
In terms of sales channel, food processing industry segment is expected to command 28.0% share in the peanut milk market in 2026.
Table of Content
- Executive Summary
- Global Market Outlook
- Demand-side Trends
- Supply-side Trends
- Technology Roadmap Analysis
- Analysis and Recommendations
- Market Overview
- Market Coverage / Taxonomy
- Market Definition / Scope / Limitations
- Research Methodology
- Chapter Orientation
- Analytical Lens and Working Hypotheses
- Market Structure, Signals, and Trend Drivers
- Benchmarking and Cross-market Comparability
- Market Sizing, Forecasting, and Opportunity Mapping
- Research Design and Evidence Framework
- Desk Research Programme (Secondary Evidence)
- Company Annual and Sustainability Reports
- Peer-reviewed Journals and Academic Literature
- Corporate Websites, Product Literature, and Technical Notes
- Earnings Decks and Investor Briefings
- Statutory Filings and Regulatory Disclosures
- Technical White Papers and Standards Notes
- Trade Journals, Industry Magazines, and Analyst Briefs
- Conference Proceedings, Webinars, and Seminar Materials
- Government Statistics Portals and Public Data Releases
- Press Releases and Reputable Media Coverage
- Specialist Newsletters and Curated Briefings
- Sector Databases and Reference Repositories
- FMI Internal Proprietary Databases and Historical Market Datasets
- Subscription Datasets and Paid Sources
- Social Channels, Communities, and Digital Listening Inputs
- Additional Desk Sources
- Expert Input and Fieldwork (Primary Evidence)
- Primary Modes
- Qualitative Interviews and Expert Elicitation
- Quantitative Surveys and Structured Data Capture
- Blended Approach
- Why Primary Evidence is Used
- Field Techniques
- Interviews
- Surveys
- Focus Groups
- Observational and In-context Research
- Social and Community Interactions
- Stakeholder Universe Engaged
- C-suite Leaders
- Board Members
- Presidents and Vice Presidents
- R&D and Innovation Heads
- Technical Specialists
- Domain Subject-matter Experts
- Scientists
- Physicians and Other Healthcare Professionals
- Governance, Ethics, and Data Stewardship
- Research Ethics
- Data Integrity and Handling
- Primary Modes
- Tooling, Models, and Reference Databases
- Desk Research Programme (Secondary Evidence)
- Data Engineering and Model Build
- Data Acquisition and Ingestion
- Cleaning, Normalisation, and Verification
- Synthesis, Triangulation, and Analysis
- Quality Assurance and Audit Trail
- Market Background
- Market Dynamics
- Drivers
- Restraints
- Opportunity
- Trends
- Scenario Forecast
- Demand in Optimistic Scenario
- Demand in Likely Scenario
- Demand in Conservative Scenario
- Opportunity Map Analysis
- Product Life Cycle Analysis
- Supply Chain Analysis
- Investment Feasibility Matrix
- Value Chain Analysis
- PESTLE and Porter’s Analysis
- Regulatory Landscape
- Regional Parent Market Outlook
- Production and Consumption Statistics
- Import and Export Statistics
- Market Dynamics
- Global Market Analysis 2021 to 2025 and Forecast, 2026 to 2036
- Historical Market Size Value (USD Million) Analysis, 2021 to 2025
- Current and Future Market Size Value (USD Million) Projections, 2026 to 2036
- Y-o-Y Growth Trend Analysis
- Absolute $ Opportunity Analysis
- Global Market Pricing Analysis 2021 to 2025 and Forecast 2026 to 2036
- Global Market Analysis 2021 to 2025 and Forecast 2026 to 2036, By Product
- Introduction / Key Findings
- Historical Market Size Value (USD Million) Analysis By Product , 2021 to 2025
- Current and Future Market Size Value (USD Million) Analysis and Forecast By Product , 2026 to 2036
- Conventional
- Organic
- Conventional
- Y-o-Y Growth Trend Analysis By Product , 2021 to 2025
- Absolute $ Opportunity Analysis By Product , 2026 to 2036
- Global Market Analysis 2021 to 2025 and Forecast 2026 to 2036, By Sales Channel
- Introduction / Key Findings
- Historical Market Size Value (USD Million) Analysis By Sales Channel, 2021 to 2025
- Current and Future Market Size Value (USD Million) Analysis and Forecast By Sales Channel, 2026 to 2036
- Food Processing Industry
- Industrial Food Manufacturers
- Bulk Ingredient Buyers
- Bakery
- Commercial Bakeries
- Artisan Bakeries
- Confectionery
- Chocolate Manufacturers
- Sugar Confectionery Producers
- Ice Cream and Desserts
- Frozen Dessert Producers
- Dessert Processing Value (USD Million)s
- Beverages
- Functional Beverage Producers
- Soft Drink Manufacturers
- Protein Bars
- Sports Nutrition Bars
- Meal Replacement Bars
- Cereals
- Breakfast Cereals
- Fortified Grain Products
- Food Service Providers
- Restaurants
- Cafes and Catering Services
- Retail and Household
- Direct Consumer Usage
- Home Baking Applications
- Food Processing Industry
- Y-o-Y Growth Trend Analysis By Sales Channel, 2021 to 2025
- Absolute $ Opportunity Analysis By Sales Channel, 2026 to 2036
- Global Market Analysis 2021 to 2025 and Forecast 2026 to 2036, By Price Range
- Introduction / Key Findings
- Historical Market Size Value (USD Million) Analysis By Price Range, 2021 to 2025
- Current and Future Market Size Value (USD Million) Analysis and Forecast By Price Range, 2026 to 2036
- Mid Range
- Standard Quality Products
- Value Added Products
- Economic
- Mass Market Products
- Low Cost Supply
- Premium
- Organic Premium Products
- High Purity Specialty Products
- Mid Range
- Y-o-Y Growth Trend Analysis By Price Range, 2021 to 2025
- Absolute $ Opportunity Analysis By Price Range, 2026 to 2036
- Global Market Analysis 2021 to 2025 and Forecast 2026 to 2036, By Distribution Channel
- Introduction / Key Findings
- Historical Market Size Value (USD Million) Analysis By Distribution Channel, 2021 to 2025
- Current and Future Market Size Value (USD Million) Analysis and Forecast By Distribution Channel, 2026 to 2036
- Store Based Retailing
- Hypermarkets
- Supermarkets
- Convenience Stores
- Urban Convenience Stores
- Local Grocery Chains
- Specialty Stores
- Health Food Stores
- Organic Product Stores
- HoReCa
- Hotels
- Restaurants and Cafes
- Independent Small Groceries
- Local Retail Shops
- Neighborhood Stores
- Online Retailing
- E Commerce Platforms
- Brand Websites
- Store Based Retailing
- Y-o-Y Growth Trend Analysis By Distribution Channel, 2021 to 2025
- Absolute $ Opportunity Analysis By Distribution Channel, 2026 to 2036
- Global Market Analysis 2021 to 2025 and Forecast 2026 to 2036, By Packaging
- Introduction / Key Findings
- Historical Market Size Value (USD Million) Analysis By Packaging, 2021 to 2025
- Current and Future Market Size Value (USD Million) Analysis and Forecast By Packaging, 2026 to 2036
- Plastic and Glass Bottles
- Plastic Bottles
- Glass Bottles
- Pouches
- Stand Up Pouches
- Flexible Sachets
- Carton Packaging
- Tetra Cartons
- Paperboard Packs
- Cans
- Metal Cans
- Aluminum Containers
- Plastic and Glass Bottles
- Y-o-Y Growth Trend Analysis By Packaging, 2021 to 2025
- Absolute $ Opportunity Analysis By Packaging, 2026 to 2036
- Global Market Analysis 2021 to 2025 and Forecast 2026 to 2036, By Region
- Introduction
- Historical Market Size Value (USD Million) Analysis By Region, 2021 to 2025
- Current Market Size Value (USD Million) Analysis and Forecast By Region, 2026 to 2036
- North America
- Latin America
- Western Europe
- Eastern Europe
- East Asia
- South Asia and Pacific
- Middle East & Africa
- Market Attractiveness Analysis By Region
- North America Market Analysis 2021 to 2025 and Forecast 2026 to 2036, By Country
- Historical Market Size Value (USD Million) Trend Analysis By Market Taxonomy, 2021 to 2025
- Market Size Value (USD Million) Forecast By Market Taxonomy, 2026 to 2036
- By Country
- USA
- Canada
- Mexico
- By Product
- By Sales Channel
- By Price Range
- By Distribution Channel
- By Packaging
- By Country
- Market Attractiveness Analysis
- By Country
- By Product
- By Sales Channel
- By Price Range
- By Distribution Channel
- By Packaging
- Key Takeaways
- Latin America Market Analysis 2021 to 2025 and Forecast 2026 to 2036, By Country
- Historical Market Size Value (USD Million) Trend Analysis By Market Taxonomy, 2021 to 2025
- Market Size Value (USD Million) Forecast By Market Taxonomy, 2026 to 2036
- By Country
- Brazil
- Chile
- Rest of Latin America
- By Product
- By Sales Channel
- By Price Range
- By Distribution Channel
- By Packaging
- By Country
- Market Attractiveness Analysis
- By Country
- By Product
- By Sales Channel
- By Price Range
- By Distribution Channel
- By Packaging
- Key Takeaways
- Western Europe Market Analysis 2021 to 2025 and Forecast 2026 to 2036, By Country
- Historical Market Size Value (USD Million) Trend Analysis By Market Taxonomy, 2021 to 2025
- Market Size Value (USD Million) Forecast By Market Taxonomy, 2026 to 2036
- By Country
- Germany
- UK
- Italy
- Spain
- France
- Nordic
- BENELUX
- Rest of Western Europe
- By Product
- By Sales Channel
- By Price Range
- By Distribution Channel
- By Packaging
- By Country
- Market Attractiveness Analysis
- By Country
- By Product
- By Sales Channel
- By Price Range
- By Distribution Channel
- By Packaging
- Key Takeaways
- Eastern Europe Market Analysis 2021 to 2025 and Forecast 2026 to 2036, By Country
- Historical Market Size Value (USD Million) Trend Analysis By Market Taxonomy, 2021 to 2025
- Market Size Value (USD Million) Forecast By Market Taxonomy, 2026 to 2036
- By Country
- Russia
- Poland
- Hungary
- Balkan & Baltic
- Rest of Eastern Europe
- By Product
- By Sales Channel
- By Price Range
- By Distribution Channel
- By Packaging
- By Country
- Market Attractiveness Analysis
- By Country
- By Product
- By Sales Channel
- By Price Range
- By Distribution Channel
- By Packaging
- Key Takeaways
- East Asia Market Analysis 2021 to 2025 and Forecast 2026 to 2036, By Country
- Historical Market Size Value (USD Million) Trend Analysis By Market Taxonomy, 2021 to 2025
- Market Size Value (USD Million) Forecast By Market Taxonomy, 2026 to 2036
- By Country
- China
- Japan
- South Korea
- By Product
- By Sales Channel
- By Price Range
- By Distribution Channel
- By Packaging
- By Country
- Market Attractiveness Analysis
- By Country
- By Product
- By Sales Channel
- By Price Range
- By Distribution Channel
- By Packaging
- Key Takeaways
- South Asia and Pacific Market Analysis 2021 to 2025 and Forecast 2026 to 2036, By Country
- Historical Market Size Value (USD Million) Trend Analysis By Market Taxonomy, 2021 to 2025
- Market Size Value (USD Million) Forecast By Market Taxonomy, 2026 to 2036
- By Country
- India
- ASEAN
- Australia & New Zealand
- Rest of South Asia and Pacific
- By Product
- By Sales Channel
- By Price Range
- By Distribution Channel
- By Packaging
- By Country
- Market Attractiveness Analysis
- By Country
- By Product
- By Sales Channel
- By Price Range
- By Distribution Channel
- By Packaging
- Key Takeaways
- Middle East & Africa Market Analysis 2021 to 2025 and Forecast 2026 to 2036, By Country
- Historical Market Size Value (USD Million) Trend Analysis By Market Taxonomy, 2021 to 2025
- Market Size Value (USD Million) Forecast By Market Taxonomy, 2026 to 2036
- By Country
- Kingdom of Saudi Arabia
- Other GCC Countries
- Turkiye
- South Africa
- Other African Union
- Rest of Middle East & Africa
- By Product
- By Sales Channel
- By Price Range
- By Distribution Channel
- By Packaging
- By Country
- Market Attractiveness Analysis
- By Country
- By Product
- By Sales Channel
- By Price Range
- By Distribution Channel
- By Packaging
- Key Takeaways
- Key Countries Market Analysis
- USA
- Pricing Analysis
- Market Share Analysis, 2025
- By Product
- By Sales Channel
- By Price Range
- By Distribution Channel
- By Packaging
- Canada
- Pricing Analysis
- Market Share Analysis, 2025
- By Product
- By Sales Channel
- By Price Range
- By Distribution Channel
- By Packaging
- Mexico
- Pricing Analysis
- Market Share Analysis, 2025
- By Product
- By Sales Channel
- By Price Range
- By Distribution Channel
- By Packaging
- Brazil
- Pricing Analysis
- Market Share Analysis, 2025
- By Product
- By Sales Channel
- By Price Range
- By Distribution Channel
- By Packaging
- Chile
- Pricing Analysis
- Market Share Analysis, 2025
- By Product
- By Sales Channel
- By Price Range
- By Distribution Channel
- By Packaging
- Germany
- Pricing Analysis
- Market Share Analysis, 2025
- By Product
- By Sales Channel
- By Price Range
- By Distribution Channel
- By Packaging
- UK
- Pricing Analysis
- Market Share Analysis, 2025
- By Product
- By Sales Channel
- By Price Range
- By Distribution Channel
- By Packaging
- Italy
- Pricing Analysis
- Market Share Analysis, 2025
- By Product
- By Sales Channel
- By Price Range
- By Distribution Channel
- By Packaging
- Spain
- Pricing Analysis
- Market Share Analysis, 2025
- By Product
- By Sales Channel
- By Price Range
- By Distribution Channel
- By Packaging
- France
- Pricing Analysis
- Market Share Analysis, 2025
- By Product
- By Sales Channel
- By Price Range
- By Distribution Channel
- By Packaging
- India
- Pricing Analysis
- Market Share Analysis, 2025
- By Product
- By Sales Channel
- By Price Range
- By Distribution Channel
- By Packaging
- ASEAN
- Pricing Analysis
- Market Share Analysis, 2025
- By Product
- By Sales Channel
- By Price Range
- By Distribution Channel
- By Packaging
- Australia & New Zealand
- Pricing Analysis
- Market Share Analysis, 2025
- By Product
- By Sales Channel
- By Price Range
- By Distribution Channel
- By Packaging
- China
- Pricing Analysis
- Market Share Analysis, 2025
- By Product
- By Sales Channel
- By Price Range
- By Distribution Channel
- By Packaging
- Japan
- Pricing Analysis
- Market Share Analysis, 2025
- By Product
- By Sales Channel
- By Price Range
- By Distribution Channel
- By Packaging
- South Korea
- Pricing Analysis
- Market Share Analysis, 2025
- By Product
- By Sales Channel
- By Price Range
- By Distribution Channel
- By Packaging
- Russia
- Pricing Analysis
- Market Share Analysis, 2025
- By Product
- By Sales Channel
- By Price Range
- By Distribution Channel
- By Packaging
- Poland
- Pricing Analysis
- Market Share Analysis, 2025
- By Product
- By Sales Channel
- By Price Range
- By Distribution Channel
- By Packaging
- Hungary
- Pricing Analysis
- Market Share Analysis, 2025
- By Product
- By Sales Channel
- By Price Range
- By Distribution Channel
- By Packaging
- Kingdom of Saudi Arabia
- Pricing Analysis
- Market Share Analysis, 2025
- By Product
- By Sales Channel
- By Price Range
- By Distribution Channel
- By Packaging
- Turkiye
- Pricing Analysis
- Market Share Analysis, 2025
- By Product
- By Sales Channel
- By Price Range
- By Distribution Channel
- By Packaging
- South Africa
- Pricing Analysis
- Market Share Analysis, 2025
- By Product
- By Sales Channel
- By Price Range
- By Distribution Channel
- By Packaging
- USA
- Market Structure Analysis
- Competition Dashboard
- Competition Benchmarking
- Market Share Analysis of Top Players
- By Regional
- By Product
- By Sales Channel
- By Price Range
- By Distribution Channel
- By Packaging
- Competition Analysis
- Competition Deep Dive
- Elmhurst 1925
- Overview
- Product Portfolio
- Profitability by Market Segments (Product/Age /Sales Channel/Region)
- Sales Footprint
- Strategy Overview
- Marketing Strategy
- Product Strategy
- Channel Strategy
- Nestlé (Wunda)
- Yili Group
- Ripple Foods
- Vitasoy International
- Elmhurst 1925
- Competition Deep Dive
- Assumptions & Acronyms Used
List of Tables
- Table 1: Global Market Value (USD Million) Forecast by Region, 2021 to 2036
- Table 2: Global Market Value (USD Million) Forecast by Product , 2021 to 2036
- Table 3: Global Market Value (USD Million) Forecast by Sales Channel, 2021 to 2036
- Table 4: Global Market Value (USD Million) Forecast by Price Range, 2021 to 2036
- Table 5: Global Market Value (USD Million) Forecast by Distribution Channel, 2021 to 2036
- Table 6: Global Market Value (USD Million) Forecast by Packaging, 2021 to 2036
- Table 7: North America Market Value (USD Million) Forecast by Country, 2021 to 2036
- Table 8: North America Market Value (USD Million) Forecast by Product , 2021 to 2036
- Table 9: North America Market Value (USD Million) Forecast by Sales Channel, 2021 to 2036
- Table 10: North America Market Value (USD Million) Forecast by Price Range, 2021 to 2036
- Table 11: North America Market Value (USD Million) Forecast by Distribution Channel, 2021 to 2036
- Table 12: North America Market Value (USD Million) Forecast by Packaging, 2021 to 2036
- Table 13: Latin America Market Value (USD Million) Forecast by Country, 2021 to 2036
- Table 14: Latin America Market Value (USD Million) Forecast by Product , 2021 to 2036
- Table 15: Latin America Market Value (USD Million) Forecast by Sales Channel, 2021 to 2036
- Table 16: Latin America Market Value (USD Million) Forecast by Price Range, 2021 to 2036
- Table 17: Latin America Market Value (USD Million) Forecast by Distribution Channel, 2021 to 2036
- Table 18: Latin America Market Value (USD Million) Forecast by Packaging, 2021 to 2036
- Table 19: Western Europe Market Value (USD Million) Forecast by Country, 2021 to 2036
- Table 20: Western Europe Market Value (USD Million) Forecast by Product , 2021 to 2036
- Table 21: Western Europe Market Value (USD Million) Forecast by Sales Channel, 2021 to 2036
- Table 22: Western Europe Market Value (USD Million) Forecast by Price Range, 2021 to 2036
- Table 23: Western Europe Market Value (USD Million) Forecast by Distribution Channel, 2021 to 2036
- Table 24: Western Europe Market Value (USD Million) Forecast by Packaging, 2021 to 2036
- Table 25: Eastern Europe Market Value (USD Million) Forecast by Country, 2021 to 2036
- Table 26: Eastern Europe Market Value (USD Million) Forecast by Product , 2021 to 2036
- Table 27: Eastern Europe Market Value (USD Million) Forecast by Sales Channel, 2021 to 2036
- Table 28: Eastern Europe Market Value (USD Million) Forecast by Price Range, 2021 to 2036
- Table 29: Eastern Europe Market Value (USD Million) Forecast by Distribution Channel, 2021 to 2036
- Table 30: Eastern Europe Market Value (USD Million) Forecast by Packaging, 2021 to 2036
- Table 31: East Asia Market Value (USD Million) Forecast by Country, 2021 to 2036
- Table 32: East Asia Market Value (USD Million) Forecast by Product , 2021 to 2036
- Table 33: East Asia Market Value (USD Million) Forecast by Sales Channel, 2021 to 2036
- Table 34: East Asia Market Value (USD Million) Forecast by Price Range, 2021 to 2036
- Table 35: East Asia Market Value (USD Million) Forecast by Distribution Channel, 2021 to 2036
- Table 36: East Asia Market Value (USD Million) Forecast by Packaging, 2021 to 2036
- Table 37: South Asia and Pacific Market Value (USD Million) Forecast by Country, 2021 to 2036
- Table 38: South Asia and Pacific Market Value (USD Million) Forecast by Product , 2021 to 2036
- Table 39: South Asia and Pacific Market Value (USD Million) Forecast by Sales Channel, 2021 to 2036
- Table 40: South Asia and Pacific Market Value (USD Million) Forecast by Price Range, 2021 to 2036
- Table 41: South Asia and Pacific Market Value (USD Million) Forecast by Distribution Channel, 2021 to 2036
- Table 42: South Asia and Pacific Market Value (USD Million) Forecast by Packaging, 2021 to 2036
- Table 43: Middle East & Africa Market Value (USD Million) Forecast by Country, 2021 to 2036
- Table 44: Middle East & Africa Market Value (USD Million) Forecast by Product , 2021 to 2036
- Table 45: Middle East & Africa Market Value (USD Million) Forecast by Sales Channel, 2021 to 2036
- Table 46: Middle East & Africa Market Value (USD Million) Forecast by Price Range, 2021 to 2036
- Table 47: Middle East & Africa Market Value (USD Million) Forecast by Distribution Channel, 2021 to 2036
- Table 48: Middle East & Africa Market Value (USD Million) Forecast by Packaging, 2021 to 2036
List of Figures
- Figure 1: Global Market Pricing Analysis
- Figure 2: Global Market Value (USD Million) Forecast 2021-2036
- Figure 3: Global Market Value Share and BPS Analysis by Product , 2026 and 2036
- Figure 4: Global Market Y-o-Y Growth Comparison by Product , 2026-2036
- Figure 5: Global Market Attractiveness Analysis by Product
- Figure 6: Global Market Value Share and BPS Analysis by Sales Channel, 2026 and 2036
- Figure 7: Global Market Y-o-Y Growth Comparison by Sales Channel, 2026-2036
- Figure 8: Global Market Attractiveness Analysis by Sales Channel
- Figure 9: Global Market Value Share and BPS Analysis by Price Range, 2026 and 2036
- Figure 10: Global Market Y-o-Y Growth Comparison by Price Range, 2026-2036
- Figure 11: Global Market Attractiveness Analysis by Price Range
- Figure 12: Global Market Value Share and BPS Analysis by Distribution Channel, 2026 and 2036
- Figure 13: Global Market Y-o-Y Growth Comparison by Distribution Channel, 2026-2036
- Figure 14: Global Market Attractiveness Analysis by Distribution Channel
- Figure 15: Global Market Value Share and BPS Analysis by Packaging, 2026 and 2036
- Figure 16: Global Market Y-o-Y Growth Comparison by Packaging, 2026-2036
- Figure 17: Global Market Attractiveness Analysis by Packaging
- Figure 18: Global Market Value (USD Million) Share and BPS Analysis by Region, 2026 and 2036
- Figure 19: Global Market Y-o-Y Growth Comparison by Region, 2026-2036
- Figure 20: Global Market Attractiveness Analysis by Region
- Figure 21: North America Market Incremental Dollar Opportunity, 2026-2036
- Figure 22: Latin America Market Incremental Dollar Opportunity, 2026-2036
- Figure 23: Western Europe Market Incremental Dollar Opportunity, 2026-2036
- Figure 24: Eastern Europe Market Incremental Dollar Opportunity, 2026-2036
- Figure 25: East Asia Market Incremental Dollar Opportunity, 2026-2036
- Figure 26: South Asia and Pacific Market Incremental Dollar Opportunity, 2026-2036
- Figure 27: Middle East & Africa Market Incremental Dollar Opportunity, 2026-2036
- Figure 28: North America Market Value Share and BPS Analysis by Country, 2026 and 2036
- Figure 29: North America Market Value Share and BPS Analysis by Product , 2026 and 2036
- Figure 30: North America Market Y-o-Y Growth Comparison by Product , 2026-2036
- Figure 31: North America Market Attractiveness Analysis by Product
- Figure 32: North America Market Value Share and BPS Analysis by Sales Channel, 2026 and 2036
- Figure 33: North America Market Y-o-Y Growth Comparison by Sales Channel, 2026-2036
- Figure 34: North America Market Attractiveness Analysis by Sales Channel
- Figure 35: North America Market Value Share and BPS Analysis by Price Range, 2026 and 2036
- Figure 36: North America Market Y-o-Y Growth Comparison by Price Range, 2026-2036
- Figure 37: North America Market Attractiveness Analysis by Price Range
- Figure 38: North America Market Value Share and BPS Analysis by Distribution Channel, 2026 and 2036
- Figure 39: North America Market Y-o-Y Growth Comparison by Distribution Channel, 2026-2036
- Figure 40: North America Market Attractiveness Analysis by Distribution Channel
- Figure 41: North America Market Value Share and BPS Analysis by Packaging, 2026 and 2036
- Figure 42: North America Market Y-o-Y Growth Comparison by Packaging, 2026-2036
- Figure 43: North America Market Attractiveness Analysis by Packaging
- Figure 44: Latin America Market Value Share and BPS Analysis by Country, 2026 and 2036
- Figure 45: Latin America Market Value Share and BPS Analysis by Product , 2026 and 2036
- Figure 46: Latin America Market Y-o-Y Growth Comparison by Product , 2026-2036
- Figure 47: Latin America Market Attractiveness Analysis by Product
- Figure 48: Latin America Market Value Share and BPS Analysis by Sales Channel, 2026 and 2036
- Figure 49: Latin America Market Y-o-Y Growth Comparison by Sales Channel, 2026-2036
- Figure 50: Latin America Market Attractiveness Analysis by Sales Channel
- Figure 51: Latin America Market Value Share and BPS Analysis by Price Range, 2026 and 2036
- Figure 52: Latin America Market Y-o-Y Growth Comparison by Price Range, 2026-2036
- Figure 53: Latin America Market Attractiveness Analysis by Price Range
- Figure 54: Latin America Market Value Share and BPS Analysis by Distribution Channel, 2026 and 2036
- Figure 55: Latin America Market Y-o-Y Growth Comparison by Distribution Channel, 2026-2036
- Figure 56: Latin America Market Attractiveness Analysis by Distribution Channel
- Figure 57: Latin America Market Value Share and BPS Analysis by Packaging, 2026 and 2036
- Figure 58: Latin America Market Y-o-Y Growth Comparison by Packaging, 2026-2036
- Figure 59: Latin America Market Attractiveness Analysis by Packaging
- Figure 60: Western Europe Market Value Share and BPS Analysis by Country, 2026 and 2036
- Figure 61: Western Europe Market Value Share and BPS Analysis by Product , 2026 and 2036
- Figure 62: Western Europe Market Y-o-Y Growth Comparison by Product , 2026-2036
- Figure 63: Western Europe Market Attractiveness Analysis by Product
- Figure 64: Western Europe Market Value Share and BPS Analysis by Sales Channel, 2026 and 2036
- Figure 65: Western Europe Market Y-o-Y Growth Comparison by Sales Channel, 2026-2036
- Figure 66: Western Europe Market Attractiveness Analysis by Sales Channel
- Figure 67: Western Europe Market Value Share and BPS Analysis by Price Range, 2026 and 2036
- Figure 68: Western Europe Market Y-o-Y Growth Comparison by Price Range, 2026-2036
- Figure 69: Western Europe Market Attractiveness Analysis by Price Range
- Figure 70: Western Europe Market Value Share and BPS Analysis by Distribution Channel, 2026 and 2036
- Figure 71: Western Europe Market Y-o-Y Growth Comparison by Distribution Channel, 2026-2036
- Figure 72: Western Europe Market Attractiveness Analysis by Distribution Channel
- Figure 73: Western Europe Market Value Share and BPS Analysis by Packaging, 2026 and 2036
- Figure 74: Western Europe Market Y-o-Y Growth Comparison by Packaging, 2026-2036
- Figure 75: Western Europe Market Attractiveness Analysis by Packaging
- Figure 76: Eastern Europe Market Value Share and BPS Analysis by Country, 2026 and 2036
- Figure 77: Eastern Europe Market Value Share and BPS Analysis by Product , 2026 and 2036
- Figure 78: Eastern Europe Market Y-o-Y Growth Comparison by Product , 2026-2036
- Figure 79: Eastern Europe Market Attractiveness Analysis by Product
- Figure 80: Eastern Europe Market Value Share and BPS Analysis by Sales Channel, 2026 and 2036
- Figure 81: Eastern Europe Market Y-o-Y Growth Comparison by Sales Channel, 2026-2036
- Figure 82: Eastern Europe Market Attractiveness Analysis by Sales Channel
- Figure 83: Eastern Europe Market Value Share and BPS Analysis by Price Range, 2026 and 2036
- Figure 84: Eastern Europe Market Y-o-Y Growth Comparison by Price Range, 2026-2036
- Figure 85: Eastern Europe Market Attractiveness Analysis by Price Range
- Figure 86: Eastern Europe Market Value Share and BPS Analysis by Distribution Channel, 2026 and 2036
- Figure 87: Eastern Europe Market Y-o-Y Growth Comparison by Distribution Channel, 2026-2036
- Figure 88: Eastern Europe Market Attractiveness Analysis by Distribution Channel
- Figure 89: Eastern Europe Market Value Share and BPS Analysis by Packaging, 2026 and 2036
- Figure 90: Eastern Europe Market Y-o-Y Growth Comparison by Packaging, 2026-2036
- Figure 91: Eastern Europe Market Attractiveness Analysis by Packaging
- Figure 92: East Asia Market Value Share and BPS Analysis by Country, 2026 and 2036
- Figure 93: East Asia Market Value Share and BPS Analysis by Product , 2026 and 2036
- Figure 94: East Asia Market Y-o-Y Growth Comparison by Product , 2026-2036
- Figure 95: East Asia Market Attractiveness Analysis by Product
- Figure 96: East Asia Market Value Share and BPS Analysis by Sales Channel, 2026 and 2036
- Figure 97: East Asia Market Y-o-Y Growth Comparison by Sales Channel, 2026-2036
- Figure 98: East Asia Market Attractiveness Analysis by Sales Channel
- Figure 99: East Asia Market Value Share and BPS Analysis by Price Range, 2026 and 2036
- Figure 100: East Asia Market Y-o-Y Growth Comparison by Price Range, 2026-2036
- Figure 101: East Asia Market Attractiveness Analysis by Price Range
- Figure 102: East Asia Market Value Share and BPS Analysis by Distribution Channel, 2026 and 2036
- Figure 103: East Asia Market Y-o-Y Growth Comparison by Distribution Channel, 2026-2036
- Figure 104: East Asia Market Attractiveness Analysis by Distribution Channel
- Figure 105: East Asia Market Value Share and BPS Analysis by Packaging, 2026 and 2036
- Figure 106: East Asia Market Y-o-Y Growth Comparison by Packaging, 2026-2036
- Figure 107: East Asia Market Attractiveness Analysis by Packaging
- Figure 108: South Asia and Pacific Market Value Share and BPS Analysis by Country, 2026 and 2036
- Figure 109: South Asia and Pacific Market Value Share and BPS Analysis by Product , 2026 and 2036
- Figure 110: South Asia and Pacific Market Y-o-Y Growth Comparison by Product , 2026-2036
- Figure 111: South Asia and Pacific Market Attractiveness Analysis by Product
- Figure 112: South Asia and Pacific Market Value Share and BPS Analysis by Sales Channel, 2026 and 2036
- Figure 113: South Asia and Pacific Market Y-o-Y Growth Comparison by Sales Channel, 2026-2036
- Figure 114: South Asia and Pacific Market Attractiveness Analysis by Sales Channel
- Figure 115: South Asia and Pacific Market Value Share and BPS Analysis by Price Range, 2026 and 2036
- Figure 116: South Asia and Pacific Market Y-o-Y Growth Comparison by Price Range, 2026-2036
- Figure 117: South Asia and Pacific Market Attractiveness Analysis by Price Range
- Figure 118: South Asia and Pacific Market Value Share and BPS Analysis by Distribution Channel, 2026 and 2036
- Figure 119: South Asia and Pacific Market Y-o-Y Growth Comparison by Distribution Channel, 2026-2036
- Figure 120: South Asia and Pacific Market Attractiveness Analysis by Distribution Channel
- Figure 121: South Asia and Pacific Market Value Share and BPS Analysis by Packaging, 2026 and 2036
- Figure 122: South Asia and Pacific Market Y-o-Y Growth Comparison by Packaging, 2026-2036
- Figure 123: South Asia and Pacific Market Attractiveness Analysis by Packaging
- Figure 124: Middle East & Africa Market Value Share and BPS Analysis by Country, 2026 and 2036
- Figure 125: Middle East & Africa Market Value Share and BPS Analysis by Product , 2026 and 2036
- Figure 126: Middle East & Africa Market Y-o-Y Growth Comparison by Product , 2026-2036
- Figure 127: Middle East & Africa Market Attractiveness Analysis by Product
- Figure 128: Middle East & Africa Market Value Share and BPS Analysis by Sales Channel, 2026 and 2036
- Figure 129: Middle East & Africa Market Y-o-Y Growth Comparison by Sales Channel, 2026-2036
- Figure 130: Middle East & Africa Market Attractiveness Analysis by Sales Channel
- Figure 131: Middle East & Africa Market Value Share and BPS Analysis by Price Range, 2026 and 2036
- Figure 132: Middle East & Africa Market Y-o-Y Growth Comparison by Price Range, 2026-2036
- Figure 133: Middle East & Africa Market Attractiveness Analysis by Price Range
- Figure 134: Middle East & Africa Market Value Share and BPS Analysis by Distribution Channel, 2026 and 2036
- Figure 135: Middle East & Africa Market Y-o-Y Growth Comparison by Distribution Channel, 2026-2036
- Figure 136: Middle East & Africa Market Attractiveness Analysis by Distribution Channel
- Figure 137: Middle East & Africa Market Value Share and BPS Analysis by Packaging, 2026 and 2036
- Figure 138: Middle East & Africa Market Y-o-Y Growth Comparison by Packaging, 2026-2036
- Figure 139: Middle East & Africa Market Attractiveness Analysis by Packaging
- Figure 140: Global Market - Tier Structure Analysis
- Figure 141: Global Market - Company Share Analysis


