Europe PCB Design Software Market Size and Share Forecast Outlook From 2024 to 2035

The PCB Design Software Industry Analysis in Europe is estimated to be valued at USD 287.9 million in 2025 and is projected to reach USD 781.3 million by 2035, registering a compound annual growth rate (CAGR) of 10.5% over the forecast period.

The PCB design software industry in Europe is evolving rapidly, supported by the region’s strong electronics manufacturing base, increasing adoption of automation, and the rise of IoT-enabled devices. Growing demand for miniaturized and high-performance electronic components has intensified the need for advanced design tools that ensure accuracy, reliability, and speed in circuit development.

The industry benefits from technological innovation in 3D modeling, design automation, and simulation features that enhance product development cycles. The proliferation of electric vehicles, renewable energy systems, and industrial electronics is expanding design requirements across multiple sectors.

With growing R&D investments and digital transformation initiatives, Europe remains a hub for PCB design innovation, positioning the region for continued growth and competitiveness in the global electronic design ecosystem.
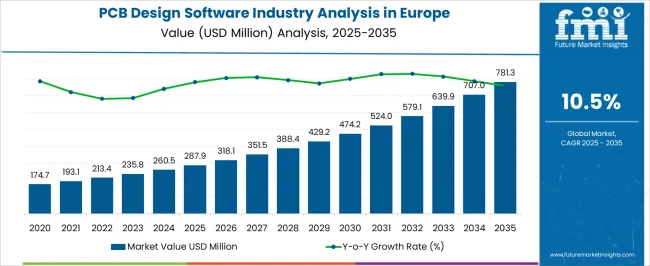
Quick Stats for PCB Design Software Industry Analysis in Europe

  • PCB Design Software Industry Analysis in Europe Industry Value (2025): USD 287.9 million
  • PCB Design Software Industry Analysis in Europe Forecast Value (2035): USD 781.3 million
  • PCB Design Software Industry Analysis in Europe Forecast CAGR: 10.5%
  • Leading Segment in PCB Design Software Industry Analysis in Europe in 2025: Software (65.4%)
  • Key Growth Region in PCB Design Software Industry Analysis in Europe: North America, Asia-Pacific, Europe
  • Top Key Players in PCB Design Software Industry Analysis in Europe: Siemens, Autodesk Inc., SolidWorks (Dassault Systèmes), Zuken Inc., Altium, Synopsys Inc., Cadence Design, WestDev Ltd., ANSYS Inc., KiCad, EasyEDA, Labcenter Electronics, National Instruments Corp, Altair Engineering, Novarm Limited

Pcb Design Software Industry Analysis In Europe Market Value Analysis

Metric Value
PCB Design Software Industry Analysis in Europe Estimated Value in (2025 E) USD 287.9 million
PCB Design Software Industry Analysis in Europe Forecast Value in (2035 F) USD 781.3 million
Forecast CAGR (2025 to 2035) 10.5%

Segmental Analysis

The market is segmented by Solution, Deployment, Enterprise Size, and Industry and region. By Solution, the market is divided into Software and Services. In terms of Deployment, the market is classified into On-Premises and Cloud-Based. Based on Enterprise Size, the market is segmented into Very Large Enterprises (1,000+ Employees), Large Enterprises (500 To 999 Employees), Medium-Sized Enterprise (100 To 499 Employees), Small Enterprises (10 To 99 Employees), and Small Offices (1 To 9 Employees).

By Industry, the market is divided into Electronics And Electrical, Telecommunications, Healthcare And Medical Devices, Automotive, Aerospace And Defense, and Others. Regionally, the market is classified into North America, Latin America, Western Europe, Eastern Europe, Balkan & Baltic Countries, Russia & Belarus, Central Asia, East Asia, South Asia & Pacific, and the Middle East & Africa.
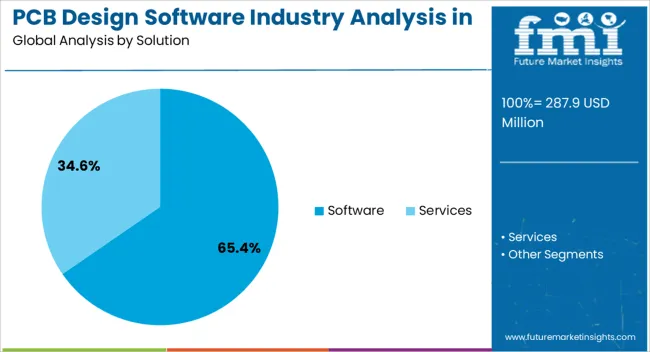
Insights into the Software Segment

Pcb Design Software Industry Analysis In Europe Analysis By Solution

The software segment leads the solution category with approximately 65.40% share, driven by the increasing demand for advanced electronic design automation tools that enhance productivity and design precision. These platforms integrate schematic capture, layout design, and signal integrity analysis into unified environments, streamlining complex workflows.

The segment’s growth is bolstered by the integration of cloud-based collaboration and AI-assisted optimization features, enabling faster prototyping and reduced design errors. With rising complexity in PCB architectures for automotive, aerospace, and consumer electronics applications, demand for sophisticated design software continues to expand.

The software segment is expected to maintain dominance as manufacturers prioritize digitalization and design efficiency.
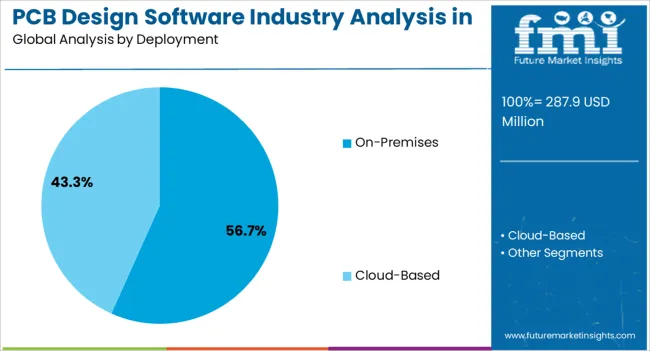
Insights into the On-Premises Segment

Pcb Design Software Industry Analysis In Europe Analysis By Deployment

The on-premises segment dominates the deployment category with approximately 56.70% share, reflecting the preference among large enterprises for data security, control, and system customization. On-premises solutions provide enhanced performance for complex, resource-intensive design tasks and ensure compliance with strict data protection regulations prevalent in Europe.

Enterprises with established IT infrastructure favor this model for long-term reliability and integration with existing engineering systems. Although cloud-based deployments are gaining attention, the on-premises segment remains prevalent among industries handling proprietary or defense-related designs.

With ongoing hardware advancements and cybersecurity priorities, this segment is expected to retain a strong presence in the PCB design software market.
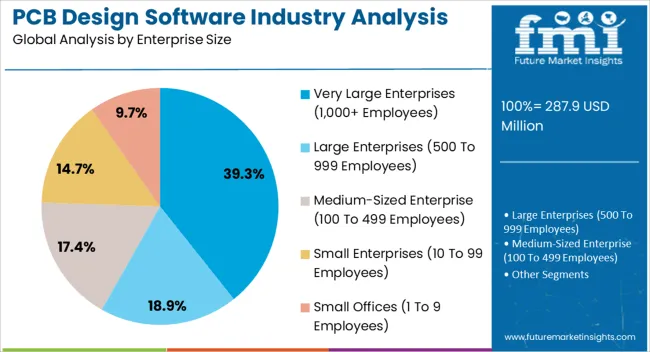
Insights into the Very Large Enterprises Segment

Pcb Design Software Industry Analysis In Europe Analysis By Enterprise Size

The very large enterprises segment holds approximately 39.30% share in the enterprise size category, underscoring the concentration of demand among companies with extensive R&D and complex design operations. These organizations invest heavily in advanced PCB design platforms to support high-volume, precision-driven production.

The segment benefits from robust budgets, dedicated engineering teams, and the need for sophisticated simulation and validation tools. Large enterprises across automotive, aerospace, and telecommunications sectors are leading adopters, leveraging design software to accelerate innovation cycles and maintain competitive advantage.

As the complexity of electronic systems continues to increase, very large enterprises are expected to remain the primary revenue contributors in Europe’s PCB design software industry.

Comparison of Historical vs Future Outlook on Changing Consumer Trends for Europe PCB Design Software Industry

From 2020 to 2025, Europe’s PCB design software industry grew a CAGR of 9.4%, reaching an industry size of USD 287.90 million in 2025.

  • From 2020 to 2025, Europe's demand for PCB design software increased due to the rising demand for electronic device manufacturing, IoT, automotive advancements, and smart technologies.
  • The demand for user-friendly interfaces and collaborative features boosted productivity and product development cycles.
  • The industry has grown steadily over the years, propelled by the rising need for electronic devices in several industries, including consumer electronics, automotive, telecommunications, and industrial sectors.
  • PCB design software has evolved to meet the challenges of signal integrity, impedance matching, and other factors critical for high-speed designs as the need for high-speed and high-frequency applications grows.
  • The electronics industry's globalization has facilitated greater cooperation between geographically dispersed design teams. With the development of collaborative features in PCB design software, teams can now easily work together across geographic borders.
  • Constant technological breakthroughs have characterized the progression of PCB design software. Design software now includes features like 3D modeling, simulation, and analysis tools, which enable designers to build increasingly intricate and sophisticated circuit layouts.

Future Market Projections for Europe PCB Design Software Industry

Europe’s PCB design software industry is expected to rise at a CAGR of 10.5% from 2025 to 2035.

  • The industry is expected to surge due to the increasing demand for sophisticated tools, advancements in emerging technologies such as 5G, IoT, and electric vehicles, and the integration of artificial intelligence & machine learning.
  • Sustainability concerns and the push for smart manufacturing & Industry 4.0 are projected to drive the development of eco-friendly design practices and materials.

Semi-annual Market Update for Europe PCB Design Software Industry

The table presents the expected CAGR for Europe’s PCB design software industry over several semi-annual periods spanning from 2025 to 2035. In the first half (H1) of the decade from 2025 to 2035, the field is predicted to surge at a CAGR of 10.1%, followed by a slightly higher growth rate of 10.5% in the second half (H2) of the same decade. Moving into the subsequent period, from H1 2025 to H2 2035, the CAGR is projected to remain moderate to 10.5% in the first half and surge at 12.7% in the second half.

Semi-annual Insights

Particular Value CAGR
H1 10.1% (2025 to 2035)
H2 10.5% (2025 to 2035)
H1 10.5% (2025 to 2035)
H2 12.7% (2025 to 2035)

Factors Driving the Demand for Europe PCB Design Software

  • Increasing demand for miniaturized electronics drives the need for advanced PCB design software solutions in Europe.
  • The growing adoption of Internet of Things (IoT) devices fuels the demand for innovative PCB design solutions in Europe.
  • Rising emphasis on electric vehicles and renewable energy technologies boosts the demand for specialized PCB design software solutions.
  • The accelerated pace of 5G infrastructure development propels the demand for high-performance PCB design tools.
  • Expanding aerospace and defense industries push the requirement for cutting-edge PCB design software solutions in Europe.

Factors Restraining the Demand for Europe PCB Design Software

  • For small and medium-sized enterprises (SMEs) or start-ups, the upfront expenses of obtaining and implementing sophisticated PCB design tools are set to be a key deterrent.
  • The software's complexity is expected to be a barrier, especially for small design teams or those with few training resources.
  • Since PCB design entails managing confidential data and sensitive intellectual property, security issues are set to function as a deterrent.

Emerging Opportunities in the Europe PCB Design Software Industry

  • Growing demand for advanced automotive electronics fuels opportunities for PCB design software solutions in Europe.
  • The increasing adoption of 5G technology drives the need for innovative PCB design solutions in the telecommunications sector.
  • Expanding renewable energy projects create opportunities for PCB design software solutions in Europe’s green technology sector.

Top Europe PCB Design Software Market Dynamics and Industry Trends

  • Increasing adoption of cloud-based PCB design tools for enhanced collaboration and accessibility.
  • Growing emphasis on advanced automation and artificial intelligence integration in PCB design software.
  • Rising demand for environmentally sustainable and energy-efficient design solutions in Europe's PCB industry.
  • Integrating 3D printing capabilities within PCB design software for prototyping and small-scale production.
  • Continued development of user-friendly interfaces and intuitive features to accommodate a broad range of design skill levels.

Analysis of Top Countries, Producing, Formulating, Packaging, Distributing, and Consuming PCB Design Software in Europe

The table below shows the estimated growth rates of the top four countries. France, the United Kingdom, and Germany are set to record high CAGRs of 12.0%, 10.4%, and 11.6% respectively, through 2035.

Country Value CAGR
Germany 11.6%
Italy 9.4%
United Kingdom 10.4%
France 12.0%

Growing Technological Advancements and Innovations in Germany to Surge Demand

Germany's PCB design software industry is expected to surge at a CAGR of 11.6% by 2035. This rising popularity is attributed to:

  • The PCB design software industry is poised for substantial growth in Germany due to the nation's strong emphasis on technological advancements and innovation.
  • Automotive and industrial manufacturing are at the forefront of adopting cutting-edge technologies, driving the demand for sophisticated PCB design tools to meet the increasing complexity of electronic components and systems.

Demand for Electronics and IoT Devices in the United Kingdom to Gain Traction

The PCB design software industry in the United Kingdom is anticipated to surge at 10.4% CAGR during the forecast period. Key factors influencing the industry include:

  • Due to the rising demand for electronics and Internet of Things (IoT) devices, the PCB design software industry is poised for substantial growth in the United Kingdom.
  • As the country continues to advance technologically, there is a notable surge in the development and adoption of electronic components across several industries.
  • From smart home applications to industrial automation, the need for efficient PCB design tools is gaining traction in ensuring the seamless integration of electronics into everyday life.

Growing Telecommunication and Healthcare Industry in France to Drive Growth

France's PCB design software industry is estimated to rise at a CAGR of 12.0%. Top factors supporting the industry’s expansion in the country include:

  • With the growing prevalence of high-speed communication technologies, manufacturers in France are developing PCB design software solutions that can handle the challenges related to signal integrity, impedance matching, and high-frequency design.
  • Availability of flexible PCB designs is projected to drive France’s PCB design software industry growth over the forecast period.

Europe PCB Design Software Industry Analysis by Top Investment Segments

The section below shows the service segment leading in terms of solution. It is estimated to thrive at an 11.5% CAGR between 2025 and 2035. Based on industry, the electronics and electrical segment is anticipated to hold a dominant share through 2035. It is set to exhibit a significant CAGR during the forecast period.

Service Segment to Dominate Europe’s PCB Design Software Industry Through 2035

Solution Value CAGR
Software 8.6%
Services 11.5%

The service segment is expected to dominate the Europe PCB design software industry with a CAGR of 11.5% from 2025 to 2035. This segment captured a significant industry share in 2025 due to the high demand for loan software.

  • The service segment is driving Europe’s PCB design software industry due to the growing recognition of value-added services offered by providers. These services help companies optimize their PCB design processes, ensuring their engineering teams are proficient and up-to-date with the latest tools.
  • The service segment addresses the evolving customization needs of diverse industries, offering tailored solutions to enhance design efficiency and product development timelines.

Deployment of Flexible PCBs in Consumer Electronic Devices Rises

The industry for PCB design software in Europe is anticipated to be dominated by the electronics and electrical sectors. The segment held a significant industry share in 2025.
  • Customers want electronic gadgets that are quick and thin, and firms want products with more capability. This presents significant prospects for companies in the PCB design software industry.
  • Manufacturers of consumer electronics are creating devices with high-quality features and functionality to provide customers with the most convenient experience possible. This factor is helping PCB design software providers maintain healthy profit margins from the consumer electronics sector.

Leading Suppliers of Europe PCB Design Software

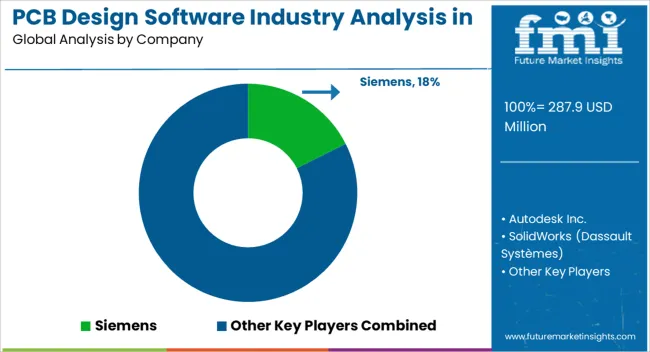
Pcb Design Software Industry Analysis In Europe Analysis By Company

Europe’s PCB design software industry is competitive, with established players and start-ups vying for industry share. Key companies in the electronic design automation (EDA) sector offer comprehensive PCB design software tools, covering several functionalities such as schematic capture and layout design. Niche players also focus on specific aspects of PCB design or provide specialized solutions.

Key players invest in research & development, offering cutting-edge features and compatibility with technological advancements. They often engage in strategic partnerships and acquisitions to expand their product portfolios.

Start-ups introduce agile solutions, addressing industry challenges or emerging trends like artificial intelligence, machine learning, and cloud-based solutions. Leading companies adapt quickly to changing industry dynamics and provide tailored solutions to niche industries or specialized applications.

Open-source PCB design software solutions are gaining popularity, offering an alternative approach to traditional commercial software. The dynamic nature of the electronics industry and continuous technological advancements are prompting companies to remain responsive to emerging trends and customer demands.

Key Development:

In January 2025, Pulsonix signed an agreement with Accelerated Designs Inc. to provide Pulsonix users access to the Accelerated Designs Ultra Librarian for Pulsonix.

Key Player:

Dassault Systèmes SE, also known as 3DS, is a multinational software firm based in France that specializes in developing software for 3D product design, production, simulation, and related goods.

Key Players and Market Concentration in the Europe PCB Design Software Industry

  • Autodesk Inc.
  • SolidWorks (Dassault Systèmes)
  • Zuken Inc.
  • Altium
  • Synopsys Inc.
  • Cadence Design
  • WestDev Ltd.
  • ANSYS Inc.
  • KiCad
  • EasyEDA
  • Labcenter Electronics
  • Siemens
  • National Instruments Corp
  • Altair Engineering
  • Novarm Limited

Analysis of Key Product Categories in Europe PCB Design Software Market

By Solution:

  • Software
    • PCB Layout Software
    • PCB Schematic Capture Software
  • Services
    • PCB Designing and Engineering Services
    • Consulting Services
    • Support and Maintenance Services

By Deployment:

  • Cloud-based
  • On-premises

By Enterprise Size:

  • Small Offices (1 to 9 employees)
  • Small Enterprises (10 to 99 employees)
  • Medium-sized Enterprise (100 to 499 employees)
  • Large Enterprises (500 to 999 employees)
  • Very Large Enterprises (1,000+ employees)

By Industry:

  • Electronics and Electrical
  • Telecommunications
  • Healthcare and Medical Devices
  • Automotive
  • Aerospace and Defense
  • Others

By Country:

  • Germany
  • Italy
  • France
  • United Kingdom
  • Spain
  • BENELUX
  • Nordics
  • Russia
  • Poland
  • Balkan and Baltics

Frequently Asked Questions

How big is the PCB design software industry analysis in europe in 2025?

The global PCB design software industry analysis in europe is estimated to be valued at USD 287.9 million in 2025.

What will be the size of PCB design software industry analysis in europe in 2035?

The market size for the PCB design software industry analysis in europe is projected to reach USD 781.3 million by 2035.

How much will be the PCB design software industry analysis in europe growth between 2025 and 2035?

The PCB design software industry analysis in europe is expected to grow at a 10.5% CAGR between 2025 and 2035.

What are the key product types in the PCB design software industry analysis in europe?

The key product types in PCB design software industry analysis in europe are software, _pcb layout software, _pcb schematic capture software, services, _pcb designing and engineering services, _consulting services and _support and maintenance services.

Which deployment segment to contribute significant share in the PCB design software industry analysis in europe in 2025?

In terms of deployment, on-premises segment to command 56.7% share in the PCB design software industry analysis in europe in 2025.

Table of Content

  1. Executive Summary
    • Global Market Outlook
    • Demand-side Trends
    • Supply-side Trends
    • Technology Roadmap Analysis
    • Analysis and Recommendations
  2. Market Overview
    • Market Coverage / Taxonomy
    • Market Definition / Scope / Limitations
  3. Market Background
    • Market Dynamics
      • Drivers
      • Restraints
      • Opportunity
      • Trends
    • Scenario Forecast
      • Demand in Optimistic Scenario
      • Demand in Likely Scenario
      • Demand in Conservative Scenario
    • Opportunity Map Analysis
    • Product Life Cycle Analysis
    • Supply Chain Analysis
    • Investment Feasibility Matrix
    • Value Chain Analysis
    • PESTLE and Porter’s Analysis
    • Regulatory Landscape
    • Regional Parent Market Outlook
    • Production and Consumption Statistics
    • Import and Export Statistics
  4. Global Market Analysis 2020 to 2024 and Forecast, 2025 to 2035
    • Historical Market Size Value (USD Million) Analysis, 2020 to 2024
    • Current and Future Market Size Value (USD Million) Projections, 2025 to 2035
      • Y-o-Y Growth Trend Analysis
      • Absolute $ Opportunity Analysis
  5. Global Market Pricing Analysis 2020 to 2024 and Forecast 2025 to 2035
  6. Global Market Analysis 2020 to 2024 and Forecast 2025 to 2035, By Solution
    • Introduction / Key Findings
    • Historical Market Size Value (USD Million) Analysis By Solution , 2020 to 2024
    • Current and Future Market Size Value (USD Million) Analysis and Forecast By Solution , 2025 to 2035
      • Software
        • PCB Layout Software
        • PCB Schematic Capture Software
      • Services
        • PCB Designing And Engineering Services
        • Consulting Services
        • Support And Maintenance Services
    • Y-o-Y Growth Trend Analysis By Solution , 2020 to 2024
    • Absolute $ Opportunity Analysis By Solution , 2025 to 2035
  7. Global Market Analysis 2020 to 2024 and Forecast 2025 to 2035, By Deployment
    • Introduction / Key Findings
    • Historical Market Size Value (USD Million) Analysis By Deployment, 2020 to 2024
    • Current and Future Market Size Value (USD Million) Analysis and Forecast By Deployment, 2025 to 2035
      • On-Premises
      • Cloud-Based
    • Y-o-Y Growth Trend Analysis By Deployment, 2020 to 2024
    • Absolute $ Opportunity Analysis By Deployment, 2025 to 2035
  8. Global Market Analysis 2020 to 2024 and Forecast 2025 to 2035, By Enterprise Size
    • Introduction / Key Findings
    • Historical Market Size Value (USD Million) Analysis By Enterprise Size, 2020 to 2024
    • Current and Future Market Size Value (USD Million) Analysis and Forecast By Enterprise Size, 2025 to 2035
      • Very Large Enterprises (1,000+ Employees)
      • Large Enterprises (500 To 999 Employees)
      • Medium-Sized Enterprise (100 To 499 Employees)
      • Small Enterprises (10 To 99 Employees)
      • Small Offices (1 To 9 Employees)
    • Y-o-Y Growth Trend Analysis By Enterprise Size, 2020 to 2024
    • Absolute $ Opportunity Analysis By Enterprise Size, 2025 to 2035
  9. Global Market Analysis 2020 to 2024 and Forecast 2025 to 2035, By Industry
    • Introduction / Key Findings
    • Historical Market Size Value (USD Million) Analysis By Industry, 2020 to 2024
    • Current and Future Market Size Value (USD Million) Analysis and Forecast By Industry, 2025 to 2035
      • Electronics And Electrical
      • Telecommunications
      • Healthcare And Medical Devices
      • Automotive
      • Aerospace And Defense
      • Others
    • Y-o-Y Growth Trend Analysis By Industry, 2020 to 2024
    • Absolute $ Opportunity Analysis By Industry, 2025 to 2035
  10. Global Market Analysis 2020 to 2024 and Forecast 2025 to 2035, By Region
    • Introduction
    • Historical Market Size Value (USD Million) Analysis By Region, 2020 to 2024
    • Current Market Size Value (USD Million) Analysis and Forecast By Region, 2025 to 2035
      • North America
      • Latin America
      • Western Europe
      • Eastern Europe
      • East Asia
      • South Asia and Pacific
      • Middle East & Africa
    • Market Attractiveness Analysis By Region
  11. North America Market Analysis 2020 to 2024 and Forecast 2025 to 2035, By Country
    • Historical Market Size Value (USD Million) Trend Analysis By Market Taxonomy, 2020 to 2024
    • Market Size Value (USD Million) Forecast By Market Taxonomy, 2025 to 2035
      • By Country
        • USA
        • Canada
        • Mexico
      • By Solution
      • By Deployment
      • By Enterprise Size
      • By Industry
    • Market Attractiveness Analysis
      • By Country
      • By Solution
      • By Deployment
      • By Enterprise Size
      • By Industry
    • Key Takeaways
  12. Latin America Market Analysis 2020 to 2024 and Forecast 2025 to 2035, By Country
    • Historical Market Size Value (USD Million) Trend Analysis By Market Taxonomy, 2020 to 2024
    • Market Size Value (USD Million) Forecast By Market Taxonomy, 2025 to 2035
      • By Country
        • Brazil
        • Chile
        • Rest of Latin America
      • By Solution
      • By Deployment
      • By Enterprise Size
      • By Industry
    • Market Attractiveness Analysis
      • By Country
      • By Solution
      • By Deployment
      • By Enterprise Size
      • By Industry
    • Key Takeaways
  13. Western Europe Market Analysis 2020 to 2024 and Forecast 2025 to 2035, By Country
    • Historical Market Size Value (USD Million) Trend Analysis By Market Taxonomy, 2020 to 2024
    • Market Size Value (USD Million) Forecast By Market Taxonomy, 2025 to 2035
      • By Country
        • Germany
        • UK
        • Italy
        • Spain
        • France
        • Nordic
        • BENELUX
        • Rest of Western Europe
      • By Solution
      • By Deployment
      • By Enterprise Size
      • By Industry
    • Market Attractiveness Analysis
      • By Country
      • By Solution
      • By Deployment
      • By Enterprise Size
      • By Industry
    • Key Takeaways
  14. Eastern Europe Market Analysis 2020 to 2024 and Forecast 2025 to 2035, By Country
    • Historical Market Size Value (USD Million) Trend Analysis By Market Taxonomy, 2020 to 2024
    • Market Size Value (USD Million) Forecast By Market Taxonomy, 2025 to 2035
      • By Country
        • Russia
        • Poland
        • Hungary
        • Balkan & Baltic
        • Rest of Eastern Europe
      • By Solution
      • By Deployment
      • By Enterprise Size
      • By Industry
    • Market Attractiveness Analysis
      • By Country
      • By Solution
      • By Deployment
      • By Enterprise Size
      • By Industry
    • Key Takeaways
  15. East Asia Market Analysis 2020 to 2024 and Forecast 2025 to 2035, By Country
    • Historical Market Size Value (USD Million) Trend Analysis By Market Taxonomy, 2020 to 2024
    • Market Size Value (USD Million) Forecast By Market Taxonomy, 2025 to 2035
      • By Country
        • China
        • Japan
        • South Korea
      • By Solution
      • By Deployment
      • By Enterprise Size
      • By Industry
    • Market Attractiveness Analysis
      • By Country
      • By Solution
      • By Deployment
      • By Enterprise Size
      • By Industry
    • Key Takeaways
  16. South Asia and Pacific Market Analysis 2020 to 2024 and Forecast 2025 to 2035, By Country
    • Historical Market Size Value (USD Million) Trend Analysis By Market Taxonomy, 2020 to 2024
    • Market Size Value (USD Million) Forecast By Market Taxonomy, 2025 to 2035
      • By Country
        • India
        • ASEAN
        • Australia & New Zealand
        • Rest of South Asia and Pacific
      • By Solution
      • By Deployment
      • By Enterprise Size
      • By Industry
    • Market Attractiveness Analysis
      • By Country
      • By Solution
      • By Deployment
      • By Enterprise Size
      • By Industry
    • Key Takeaways
  17. Middle East & Africa Market Analysis 2020 to 2024 and Forecast 2025 to 2035, By Country
    • Historical Market Size Value (USD Million) Trend Analysis By Market Taxonomy, 2020 to 2024
    • Market Size Value (USD Million) Forecast By Market Taxonomy, 2025 to 2035
      • By Country
        • Kingdom of Saudi Arabia
        • Other GCC Countries
        • Turkiye
        • South Africa
        • Other African Union
        • Rest of Middle East & Africa
      • By Solution
      • By Deployment
      • By Enterprise Size
      • By Industry
    • Market Attractiveness Analysis
      • By Country
      • By Solution
      • By Deployment
      • By Enterprise Size
      • By Industry
    • Key Takeaways
  18. Key Countries Market Analysis
    • USA
      • Pricing Analysis
      • Market Share Analysis, 2024
        • By Solution
        • By Deployment
        • By Enterprise Size
        • By Industry
    • Canada
      • Pricing Analysis
      • Market Share Analysis, 2024
        • By Solution
        • By Deployment
        • By Enterprise Size
        • By Industry
    • Mexico
      • Pricing Analysis
      • Market Share Analysis, 2024
        • By Solution
        • By Deployment
        • By Enterprise Size
        • By Industry
    • Brazil
      • Pricing Analysis
      • Market Share Analysis, 2024
        • By Solution
        • By Deployment
        • By Enterprise Size
        • By Industry
    • Chile
      • Pricing Analysis
      • Market Share Analysis, 2024
        • By Solution
        • By Deployment
        • By Enterprise Size
        • By Industry
    • Germany
      • Pricing Analysis
      • Market Share Analysis, 2024
        • By Solution
        • By Deployment
        • By Enterprise Size
        • By Industry
    • UK
      • Pricing Analysis
      • Market Share Analysis, 2024
        • By Solution
        • By Deployment
        • By Enterprise Size
        • By Industry
    • Italy
      • Pricing Analysis
      • Market Share Analysis, 2024
        • By Solution
        • By Deployment
        • By Enterprise Size
        • By Industry
    • Spain
      • Pricing Analysis
      • Market Share Analysis, 2024
        • By Solution
        • By Deployment
        • By Enterprise Size
        • By Industry
    • France
      • Pricing Analysis
      • Market Share Analysis, 2024
        • By Solution
        • By Deployment
        • By Enterprise Size
        • By Industry
    • India
      • Pricing Analysis
      • Market Share Analysis, 2024
        • By Solution
        • By Deployment
        • By Enterprise Size
        • By Industry
    • ASEAN
      • Pricing Analysis
      • Market Share Analysis, 2024
        • By Solution
        • By Deployment
        • By Enterprise Size
        • By Industry
    • Australia & New Zealand
      • Pricing Analysis
      • Market Share Analysis, 2024
        • By Solution
        • By Deployment
        • By Enterprise Size
        • By Industry
    • China
      • Pricing Analysis
      • Market Share Analysis, 2024
        • By Solution
        • By Deployment
        • By Enterprise Size
        • By Industry
    • Japan
      • Pricing Analysis
      • Market Share Analysis, 2024
        • By Solution
        • By Deployment
        • By Enterprise Size
        • By Industry
    • South Korea
      • Pricing Analysis
      • Market Share Analysis, 2024
        • By Solution
        • By Deployment
        • By Enterprise Size
        • By Industry
    • Russia
      • Pricing Analysis
      • Market Share Analysis, 2024
        • By Solution
        • By Deployment
        • By Enterprise Size
        • By Industry
    • Poland
      • Pricing Analysis
      • Market Share Analysis, 2024
        • By Solution
        • By Deployment
        • By Enterprise Size
        • By Industry
    • Hungary
      • Pricing Analysis
      • Market Share Analysis, 2024
        • By Solution
        • By Deployment
        • By Enterprise Size
        • By Industry
    • Kingdom of Saudi Arabia
      • Pricing Analysis
      • Market Share Analysis, 2024
        • By Solution
        • By Deployment
        • By Enterprise Size
        • By Industry
    • Turkiye
      • Pricing Analysis
      • Market Share Analysis, 2024
        • By Solution
        • By Deployment
        • By Enterprise Size
        • By Industry
    • South Africa
      • Pricing Analysis
      • Market Share Analysis, 2024
        • By Solution
        • By Deployment
        • By Enterprise Size
        • By Industry
  19. Market Structure Analysis
    • Competition Dashboard
    • Competition Benchmarking
    • Market Share Analysis of Top Players
      • By Regional
      • By Solution
      • By Deployment
      • By Enterprise Size
      • By Industry
  20. Competition Analysis
    • Competition Deep Dive
      • Siemens
        • Overview
        • Product Portfolio
        • Profitability by Market Segments (Product/Age /Sales Channel/Region)
        • Sales Footprint
        • Strategy Overview
          • Marketing Strategy
          • Product Strategy
          • Channel Strategy
      • Autodesk Inc.
      • SolidWorks (Dassault Systèmes)
      • Zuken Inc.
      • Altium
      • Synopsys Inc.
      • Cadence Design
      • WestDev Ltd.
      • ANSYS Inc.
      • KiCad
      • EasyEDA
      • Labcenter Electronics
      • National Instruments Corp
      • Altair Engineering
      • Novarm Limited
  21. Assumptions & Acronyms Used
  22. Research Methodology

List of Tables

  • Table 1: Global Market Value (USD Million) Forecast by Region, 2020-2035
  • Table 2: Global Market Value (USD Million) Forecast by Solution , 2020-2035
  • Table 3: Global Market Value (USD Million) Forecast by Deployment, 2020-2035
  • Table 4: Global Market Value (USD Million) Forecast by Enterprise Size, 2020-2035
  • Table 5: Global Market Value (USD Million) Forecast by Industry, 2020-2035
  • Table 6: North America Market Value (USD Million) Forecast by Country, 2020-2035
  • Table 7: North America Market Value (USD Million) Forecast by Solution , 2020-2035
  • Table 8: North America Market Value (USD Million) Forecast by Deployment, 2020-2035
  • Table 9: North America Market Value (USD Million) Forecast by Enterprise Size, 2020-2035
  • Table 10: North America Market Value (USD Million) Forecast by Industry, 2020-2035
  • Table 11: Latin America Market Value (USD Million) Forecast by Country, 2020-2035
  • Table 12: Latin America Market Value (USD Million) Forecast by Solution , 2020-2035
  • Table 13: Latin America Market Value (USD Million) Forecast by Deployment, 2020-2035
  • Table 14: Latin America Market Value (USD Million) Forecast by Enterprise Size, 2020-2035
  • Table 15: Latin America Market Value (USD Million) Forecast by Industry, 2020-2035
  • Table 16: Western Europe Market Value (USD Million) Forecast by Country, 2020-2035
  • Table 17: Western Europe Market Value (USD Million) Forecast by Solution , 2020-2035
  • Table 18: Western Europe Market Value (USD Million) Forecast by Deployment, 2020-2035
  • Table 19: Western Europe Market Value (USD Million) Forecast by Enterprise Size, 2020-2035
  • Table 20: Western Europe Market Value (USD Million) Forecast by Industry, 2020-2035
  • Table 21: Eastern Europe Market Value (USD Million) Forecast by Country, 2020-2035
  • Table 22: Eastern Europe Market Value (USD Million) Forecast by Solution , 2020-2035
  • Table 23: Eastern Europe Market Value (USD Million) Forecast by Deployment, 2020-2035
  • Table 24: Eastern Europe Market Value (USD Million) Forecast by Enterprise Size, 2020-2035
  • Table 25: Eastern Europe Market Value (USD Million) Forecast by Industry, 2020-2035
  • Table 26: East Asia Market Value (USD Million) Forecast by Country, 2020-2035
  • Table 27: East Asia Market Value (USD Million) Forecast by Solution , 2020-2035
  • Table 28: East Asia Market Value (USD Million) Forecast by Deployment, 2020-2035
  • Table 29: East Asia Market Value (USD Million) Forecast by Enterprise Size, 2020-2035
  • Table 30: East Asia Market Value (USD Million) Forecast by Industry, 2020-2035
  • Table 31: South Asia and Pacific Market Value (USD Million) Forecast by Country, 2020-2035
  • Table 32: South Asia and Pacific Market Value (USD Million) Forecast by Solution , 2020-2035
  • Table 33: South Asia and Pacific Market Value (USD Million) Forecast by Deployment, 2020-2035
  • Table 34: South Asia and Pacific Market Value (USD Million) Forecast by Enterprise Size, 2020-2035
  • Table 35: South Asia and Pacific Market Value (USD Million) Forecast by Industry, 2020-2035
  • Table 36: Middle East & Africa Market Value (USD Million) Forecast by Country, 2020-2035
  • Table 37: Middle East & Africa Market Value (USD Million) Forecast by Solution , 2020-2035
  • Table 38: Middle East & Africa Market Value (USD Million) Forecast by Deployment, 2020-2035
  • Table 39: Middle East & Africa Market Value (USD Million) Forecast by Enterprise Size, 2020-2035
  • Table 40: Middle East & Africa Market Value (USD Million) Forecast by Industry, 2020-2035

List of Figures

  • Figure 1: Global Market Pricing Analysis
  • Figure 2: Global Market Value (USD Million) Forecast 2020-2035
  • Figure 3: Global Market Value Share and BPS Analysis by Solution , 2025 and 2035
  • Figure 4: Global Market Y-o-Y Growth Comparison by Solution , 2025-2035
  • Figure 5: Global Market Attractiveness Analysis by Solution
  • Figure 6: Global Market Value Share and BPS Analysis by Deployment, 2025 and 2035
  • Figure 7: Global Market Y-o-Y Growth Comparison by Deployment, 2025-2035
  • Figure 8: Global Market Attractiveness Analysis by Deployment
  • Figure 9: Global Market Value Share and BPS Analysis by Enterprise Size, 2025 and 2035
  • Figure 10: Global Market Y-o-Y Growth Comparison by Enterprise Size, 2025-2035
  • Figure 11: Global Market Attractiveness Analysis by Enterprise Size
  • Figure 12: Global Market Value Share and BPS Analysis by Industry, 2025 and 2035
  • Figure 13: Global Market Y-o-Y Growth Comparison by Industry, 2025-2035
  • Figure 14: Global Market Attractiveness Analysis by Industry
  • Figure 15: Global Market Value (USD Million) Share and BPS Analysis by Region, 2025 and 2035
  • Figure 16: Global Market Y-o-Y Growth Comparison by Region, 2025-2035
  • Figure 17: Global Market Attractiveness Analysis by Region
  • Figure 18: North America Market Incremental Dollar Opportunity, 2025-2035
  • Figure 19: Latin America Market Incremental Dollar Opportunity, 2025-2035
  • Figure 20: Western Europe Market Incremental Dollar Opportunity, 2025-2035
  • Figure 21: Eastern Europe Market Incremental Dollar Opportunity, 2025-2035
  • Figure 22: East Asia Market Incremental Dollar Opportunity, 2025-2035
  • Figure 23: South Asia and Pacific Market Incremental Dollar Opportunity, 2025-2035
  • Figure 24: Middle East & Africa Market Incremental Dollar Opportunity, 2025-2035
  • Figure 25: North America Market Value Share and BPS Analysis by Country, 2025 and 2035
  • Figure 26: North America Market Value Share and BPS Analysis by Solution , 2025 and 2035
  • Figure 27: North America Market Y-o-Y Growth Comparison by Solution , 2025-2035
  • Figure 28: North America Market Attractiveness Analysis by Solution
  • Figure 29: North America Market Value Share and BPS Analysis by Deployment, 2025 and 2035
  • Figure 30: North America Market Y-o-Y Growth Comparison by Deployment, 2025-2035
  • Figure 31: North America Market Attractiveness Analysis by Deployment
  • Figure 32: North America Market Value Share and BPS Analysis by Enterprise Size, 2025 and 2035
  • Figure 33: North America Market Y-o-Y Growth Comparison by Enterprise Size, 2025-2035
  • Figure 34: North America Market Attractiveness Analysis by Enterprise Size
  • Figure 35: North America Market Value Share and BPS Analysis by Industry, 2025 and 2035
  • Figure 36: North America Market Y-o-Y Growth Comparison by Industry, 2025-2035
  • Figure 37: North America Market Attractiveness Analysis by Industry
  • Figure 38: Latin America Market Value Share and BPS Analysis by Country, 2025 and 2035
  • Figure 39: Latin America Market Value Share and BPS Analysis by Solution , 2025 and 2035
  • Figure 40: Latin America Market Y-o-Y Growth Comparison by Solution , 2025-2035
  • Figure 41: Latin America Market Attractiveness Analysis by Solution
  • Figure 42: Latin America Market Value Share and BPS Analysis by Deployment, 2025 and 2035
  • Figure 43: Latin America Market Y-o-Y Growth Comparison by Deployment, 2025-2035
  • Figure 44: Latin America Market Attractiveness Analysis by Deployment
  • Figure 45: Latin America Market Value Share and BPS Analysis by Enterprise Size, 2025 and 2035
  • Figure 46: Latin America Market Y-o-Y Growth Comparison by Enterprise Size, 2025-2035
  • Figure 47: Latin America Market Attractiveness Analysis by Enterprise Size
  • Figure 48: Latin America Market Value Share and BPS Analysis by Industry, 2025 and 2035
  • Figure 49: Latin America Market Y-o-Y Growth Comparison by Industry, 2025-2035
  • Figure 50: Latin America Market Attractiveness Analysis by Industry
  • Figure 51: Western Europe Market Value Share and BPS Analysis by Country, 2025 and 2035
  • Figure 52: Western Europe Market Value Share and BPS Analysis by Solution , 2025 and 2035
  • Figure 53: Western Europe Market Y-o-Y Growth Comparison by Solution , 2025-2035
  • Figure 54: Western Europe Market Attractiveness Analysis by Solution
  • Figure 55: Western Europe Market Value Share and BPS Analysis by Deployment, 2025 and 2035
  • Figure 56: Western Europe Market Y-o-Y Growth Comparison by Deployment, 2025-2035
  • Figure 57: Western Europe Market Attractiveness Analysis by Deployment
  • Figure 58: Western Europe Market Value Share and BPS Analysis by Enterprise Size, 2025 and 2035
  • Figure 59: Western Europe Market Y-o-Y Growth Comparison by Enterprise Size, 2025-2035
  • Figure 60: Western Europe Market Attractiveness Analysis by Enterprise Size
  • Figure 61: Western Europe Market Value Share and BPS Analysis by Industry, 2025 and 2035
  • Figure 62: Western Europe Market Y-o-Y Growth Comparison by Industry, 2025-2035
  • Figure 63: Western Europe Market Attractiveness Analysis by Industry
  • Figure 64: Eastern Europe Market Value Share and BPS Analysis by Country, 2025 and 2035
  • Figure 65: Eastern Europe Market Value Share and BPS Analysis by Solution , 2025 and 2035
  • Figure 66: Eastern Europe Market Y-o-Y Growth Comparison by Solution , 2025-2035
  • Figure 67: Eastern Europe Market Attractiveness Analysis by Solution
  • Figure 68: Eastern Europe Market Value Share and BPS Analysis by Deployment, 2025 and 2035
  • Figure 69: Eastern Europe Market Y-o-Y Growth Comparison by Deployment, 2025-2035
  • Figure 70: Eastern Europe Market Attractiveness Analysis by Deployment
  • Figure 71: Eastern Europe Market Value Share and BPS Analysis by Enterprise Size, 2025 and 2035
  • Figure 72: Eastern Europe Market Y-o-Y Growth Comparison by Enterprise Size, 2025-2035
  • Figure 73: Eastern Europe Market Attractiveness Analysis by Enterprise Size
  • Figure 74: Eastern Europe Market Value Share and BPS Analysis by Industry, 2025 and 2035
  • Figure 75: Eastern Europe Market Y-o-Y Growth Comparison by Industry, 2025-2035
  • Figure 76: Eastern Europe Market Attractiveness Analysis by Industry
  • Figure 77: East Asia Market Value Share and BPS Analysis by Country, 2025 and 2035
  • Figure 78: East Asia Market Value Share and BPS Analysis by Solution , 2025 and 2035
  • Figure 79: East Asia Market Y-o-Y Growth Comparison by Solution , 2025-2035
  • Figure 80: East Asia Market Attractiveness Analysis by Solution
  • Figure 81: East Asia Market Value Share and BPS Analysis by Deployment, 2025 and 2035
  • Figure 82: East Asia Market Y-o-Y Growth Comparison by Deployment, 2025-2035
  • Figure 83: East Asia Market Attractiveness Analysis by Deployment
  • Figure 84: East Asia Market Value Share and BPS Analysis by Enterprise Size, 2025 and 2035
  • Figure 85: East Asia Market Y-o-Y Growth Comparison by Enterprise Size, 2025-2035
  • Figure 86: East Asia Market Attractiveness Analysis by Enterprise Size
  • Figure 87: East Asia Market Value Share and BPS Analysis by Industry, 2025 and 2035
  • Figure 88: East Asia Market Y-o-Y Growth Comparison by Industry, 2025-2035
  • Figure 89: East Asia Market Attractiveness Analysis by Industry
  • Figure 90: South Asia and Pacific Market Value Share and BPS Analysis by Country, 2025 and 2035
  • Figure 91: South Asia and Pacific Market Value Share and BPS Analysis by Solution , 2025 and 2035
  • Figure 92: South Asia and Pacific Market Y-o-Y Growth Comparison by Solution , 2025-2035
  • Figure 93: South Asia and Pacific Market Attractiveness Analysis by Solution
  • Figure 94: South Asia and Pacific Market Value Share and BPS Analysis by Deployment, 2025 and 2035
  • Figure 95: South Asia and Pacific Market Y-o-Y Growth Comparison by Deployment, 2025-2035
  • Figure 96: South Asia and Pacific Market Attractiveness Analysis by Deployment
  • Figure 97: South Asia and Pacific Market Value Share and BPS Analysis by Enterprise Size, 2025 and 2035
  • Figure 98: South Asia and Pacific Market Y-o-Y Growth Comparison by Enterprise Size, 2025-2035
  • Figure 99: South Asia and Pacific Market Attractiveness Analysis by Enterprise Size
  • Figure 100: South Asia and Pacific Market Value Share and BPS Analysis by Industry, 2025 and 2035
  • Figure 101: South Asia and Pacific Market Y-o-Y Growth Comparison by Industry, 2025-2035
  • Figure 102: South Asia and Pacific Market Attractiveness Analysis by Industry
  • Figure 103: Middle East & Africa Market Value Share and BPS Analysis by Country, 2025 and 2035
  • Figure 104: Middle East & Africa Market Value Share and BPS Analysis by Solution , 2025 and 2035
  • Figure 105: Middle East & Africa Market Y-o-Y Growth Comparison by Solution , 2025-2035
  • Figure 106: Middle East & Africa Market Attractiveness Analysis by Solution
  • Figure 107: Middle East & Africa Market Value Share and BPS Analysis by Deployment, 2025 and 2035
  • Figure 108: Middle East & Africa Market Y-o-Y Growth Comparison by Deployment, 2025-2035
  • Figure 109: Middle East & Africa Market Attractiveness Analysis by Deployment
  • Figure 110: Middle East & Africa Market Value Share and BPS Analysis by Enterprise Size, 2025 and 2035
  • Figure 111: Middle East & Africa Market Y-o-Y Growth Comparison by Enterprise Size, 2025-2035
  • Figure 112: Middle East & Africa Market Attractiveness Analysis by Enterprise Size
  • Figure 113: Middle East & Africa Market Value Share and BPS Analysis by Industry, 2025 and 2035
  • Figure 114: Middle East & Africa Market Y-o-Y Growth Comparison by Industry, 2025-2035
  • Figure 115: Middle East & Africa Market Attractiveness Analysis by Industry
  • Figure 116: Global Market - Tier Structure Analysis
  • Figure 117: Global Market - Company Share Analysis
Dashboard
Dashboard
Dashboard
Dashboard
Dashboard
Dashboard

Full Research Suite comprises of:

Market outlook & trends analysis

Market outlook & trends analysis

Interviews & case studies

Interviews & case studies

Strategic recommendations

Strategic recommendations

Vendor profiles & capabilities analysis

Vendor profiles & capabilities analysis

5-year forecasts

5-year forecasts

8 regions and 60+ country-level data splits

8 regions and 60+ country-level data splits

Market segment data splits

Market segment data splits

12 months of continuous data updates

12 months of continuous data updates

DELIVERED AS:

PDF EXCEL ONLINE

Full Research Suite


$5000

$7500

$10000

Buy Report Now
Similar Industry Reports

Similar Industry Reports

PCB Connector Market

PCB Connector Market Size and Share Forecast Outlook 2025 to 2035

PCB Vision Inspection Equipment for SMT Market

PCB Vision Inspection Equipment for SMT Market Size and Share Forecast Outlook 2025 to 2035

PCB Design Software Market

PCB Design Software Market Analysis by Component, Deployment, Application, and Region Through 2035

Rigid-Flex PCB Market

Rigid-Flex PCB Market Size and Share Forecast Outlook 2025 to 2035

Multi-Axis PCB Drilling Machine Market

Multi-Axis PCB Drilling Machine Market Size and Share Forecast Outlook 2025 to 2035

Substrate-like PCB Market

Substrate-like PCB Market Size and Share Forecast Outlook 2025 to 2035

Printed Circuit Board (PCB) Assembly Market

Printed Circuit Board (PCB) Assembly Market Size and Share Forecast Outlook 2025 to 2035

Printed Circuit Boards (PCB) Market

Printed Circuit Boards (PCB) Market Trends - Demand & Forecast 2025 to 2035

Designer Sneaker Market

Designer Sneaker Market Forecast Outlook 2025 to 2035

Design Collaboration Software Market

Design Collaboration Software Market Size and Share Forecast Outlook 2025 to 2035

Drug Designing Tools Market

Drug Designing Tools Market Growth – Trends & Forecast 2025 to 2035 

Product Design Verification And Validation Solution Market

Product Design Verification And Validation Solution Market Size and Share Forecast Outlook 2025 to 2035

Reference Designs Market

Reference Designs Market Growth - Trends & Forecast 2025 to 2035

Packaging Design And Simulation Technology Market

Packaging Design And Simulation Technology Market Size and Share Forecast Outlook 2025 to 2035

Packaging Design And Simulation Technology Market Share Analysis

Industry Share & Competitive Positioning in Packaging Design And Simulation Technology

AI-powered Design Tools Market

AI-powered Design Tools Market Insights - Growth & Forecast 2025 to 2035

Electronic Design Automation (EDA) Market

Electronic Design Automation (EDA) Market

Second Hand Designer Shoes Market

Second Hand Designer Shoes Market Trends – Growth & Forecast to 2035

SRAM and ROM Design IP Market

SRAM and ROM Design IP Market Report - Growth & Industry Analysis 2025 to 2035

Construction Design App Market

AI & AR-Powered Construction Design Apps for Seamless Planning

Future Market Insights

PCB Design Software Industry Analysis in Europe

Chat With MaRIA

Chat With

MaRIA

Hi There, I am MaRIA, Your Market Research Intelligence Assistant. How may I help you?