Payment Analytics Software Market Outlook (2023 to 2033)

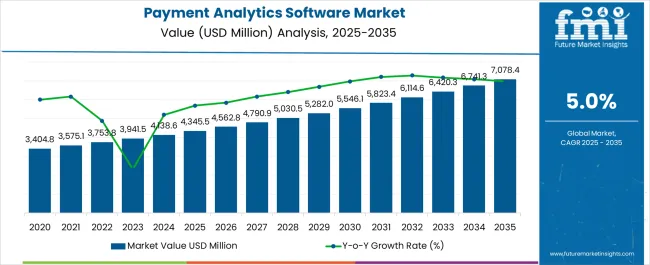
The global payment analytics software market is likely to have a valuation of US$ 3,941.5 million in 2023. With a projected CAGR of 5% for the next ten years, the market is likely to reach a valuation of nearly US$ 6,440.5 million by 2033.

Why Are Companies Increasing The Adoption Of Payment Analytics Systems?

Payment analytics software, which is used by BFSIs, e-commerce, and a varied range of companies to access and analyze data across time of their payment systems, is witnessing a boost in global demand. Through the analysis of their payment data, companies gain valuable insights.

These insights help businesses improve profitability and cut costs. Through them, organizations gain clear visibility into payments in order to track performance across platforms and detect fraud or possible issues in operations both on the enterprise level and customer level.

This ensures the optimization of time spent on troubleshooting and reduces the risk of bottlenecks in services. Through the use of payment analytics, businesses find the right KPIs to make the right decisions. This leads to an improvement in the overall customer experience.

Analytics tools lend organizations the ability to use historical data to gain insights for use in current operations by combining data with routinely made reports. For example, an organization takes a look at the variance in usual transactions and automatically identifies abnormalities to alert teams for surveillance and interventions as required.

Furthermore, predictive analytics provide improvements in ROI by using advanced technologies like artificial intelligence, machine learning, and data mining to allow for the making of key decisions based on historical data. For example, customers who are likely to default on payments are identified so that teams take different approaches with them.

Payment analytics also help IT teams understand exactly where and how the system is affecting the payment process, and which steps in the process require enhancement.

Manual analytics requires a significantly high level of time and resources. Furthermore, the data thus generated is more often than not inaccessible across departments, which reduces the level of collaboration and leads to poorly defined metrics and KPIs.

Organizations struggle to deal with the massive amounts of data they need in order to gain relevant and useful insights, especially since these companies tend to have massive volumes of data spread across varied services. Thus, the automation of payment analytics software is emerging to be essential to turn routine data collected into valuable metrics to optimize operations.

How Does Payments Analytics Software Help Fraud Monitoring?

The multiplicity of payment types and systems has led to a massive increase in online payments fraud. According to reports, 82% of establishments were affected by payment fraud in 2018 alone. Globally, this comes at nearly a 1.8% cost to revenue, with estimates showing that US$ 1 of fraud leads to an additional US$ 2.9 in losses. In 2021, the estimated losses were around US$ 20 Bn.

Friendly fraud, wherein a customer purchases an item and then claims a false refund, was reportedly experienced by nearly 40% of online sellers. Another type of fraud, CNP or Card-Not-Found Fraud, is an emerging concern.

Organizations are also concerned with the loss of reputation and customer trust when fraud is not managed efficiently. To prevent this, fraud must be detected efficiently and in a timely manner in the vast amounts of data that organizations collect on a daily basis.

In order to fight the possibility of fraud, organizations must harness the use of the software. Through this software, large amounts of data must be collected at scale via efficient data warehousing projects. With an efficient data warehousing strategy, organizations gain the ability to compile data in a centralized manner where it is applied in analytics.

With the help of payment analytics software, organizations look at large volumes of data and come up with insights as to which types of transactions are high risk and require further scrutiny. Also, software spot abnormalities in order to catch questionable transactions in real-time.

Attributes Details
Payment Analytics Software Market CAGR (2023 to 2033) 5%
Payment Analytics Software Market Size (2023) US$ 3,941.5 million
Payment Analytics Software Market Size (2033) US$ 6,440.5 million

Don't pay for what you don't need

Customize your report by selecting specific countries or regions and save 30%!

How Does Payment Analytics Software Improve Customer Service?

The growth in customer interaction touch points due to omnichannel and multichannel integration means businesses are attempting to use technology to cope while also enhancing customer service. Scalable technology is the need of the hour, as companies increase their investments in software and solutions.

According to a study, customer satisfaction rose 5%-10%, customer retention by over 10%, and operating costs witnessed a 15-20% decline after the adoption of advanced payment analytics.

Analyzing customer patterns is necessary for better Customer Relationship Management. Through a deeper understanding of consumer patterns, businesses understand their needs and preferences. A business monitors purchases to understand exactly how each of its products is performing over time across trend cycles and payment channels.

Using estimates of values each type of consumer brings, firms narrow down on which segments are driving revenue, and focus on targeting consumers in segments that lend the most value to their organizations.

Statistics show that nearly 70% of shopping carts end up abandoned. Payment analytics minimize the shopping cart abandonment rate by understanding what the problem is, by measuring the change in abandonment and sales across campaigns.

Analytics also help understand which transactions have higher chances of leading to transaction fraud, such as friendly fraud or false disputes, so companies know where to target their efforts.

How Is Use In The Banking Sector Driving Demand?

Banks deal with very large amounts of payments for a significantly wide range of clients, ranging from businesses to individual consumers. Banks are looking to use data insights to convert these masses of data into insights in order to identify revenue streams. They require the automation of systems, since the volume of data they process is far too large to process manually.

The improvements in technology are expected to be the key driver for the market, since the sheer volume of payments data banks process on a daily basis is so high that its processing to gain insights has historically been a challenge. This helps banks identify which of their service offerings are efficient, which is outdated, and where new offerings are required.

The assigning of risk to customers is also improved by the use of analytics software. In traditional methods, customers are put into broad categories based on how high or low risk they are deemed to be based on data. However, analytics ensure access to far deeper insights into consumer behavior. Through it, banks create more individualized categories and assign the right agents and techniques as required.

Sudip Saha
Sudip Saha

Principal Consultant

Talk to Analyst

Find your sweet spots for generating winning opportunities in this market.

Regional Analysis

Countries Market Share (2022)
United States 16.5%
Germany 5.4%
Japan 4.3%
Australia 2.7%

Which Application Is The Key Contributor To Demand?

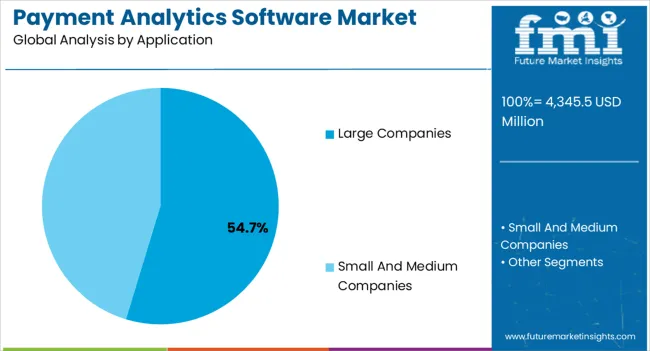
Large companies dominated the payment analytics sector, with a share of 61.2% in 2022. Large companies are the top application for payment analytics, having witnessed a CAGR of 4.8% during 2018 to 2022, with a forecast CAGR of 4.6%.

While it does have several benefits, Payment Analytics requires a high amount of resources and sophisticated expertise. Furthermore, it is most beneficial to organizations that deal with large data flows and require automation to process the sheer volume of data generated on a daily level.

Which regions contribute the most to the demand for Payment Analytics Software?

Europe is an emerging market for demand, with a 22.1% market share in 2022 and predicted market size of US $ 1,300 million by 2033. In Europe, there has been a revision in the Payment Services Directive or PSD2, which places the weight of responsibility for fraud on payment providers. This means that payment analytics is now a need for any organization that does not want to bear the burden of any fraud.

Country-Wise Insights

How does the United States continue to be the Nucleus of Global Payment Analytics Software Demand?

The United States accounted for over 34% of the global market in 2021. The United States has a US $ 665.7 million absolute dollar opportunity between 2023 and 2033, and a forecast market size of US $ 1,900 million by 2033 at a 4.5% CAGR.

United Kingdom Market Rely on Potential Investments for Better Growth

More than 60% of the global market share for digital wallets was owned by the ownership section of United Kingdom IT businesses. Payment analytics software growth is anticipated to be fueled by rising expenditures made in digital wallet innovation by technology businesses to provide clients a safe and convenient way to perform financial transactions.

As the use of internet-enabled mobile devices increases and internet traffic increases, consumers are turning to their mobile devices to complete a variety of financial activities. Due to all these factors, the United Kingdom is expected to have a CAGR of 4.3% by 2033.

Get the data you need at a Fraction of the cost

Personalize your report by choosing insights you need
and save 40%!

Category-Wise Insights

Why is On-Premise Payment Analytics software the leading type of Payment Analytics Software?

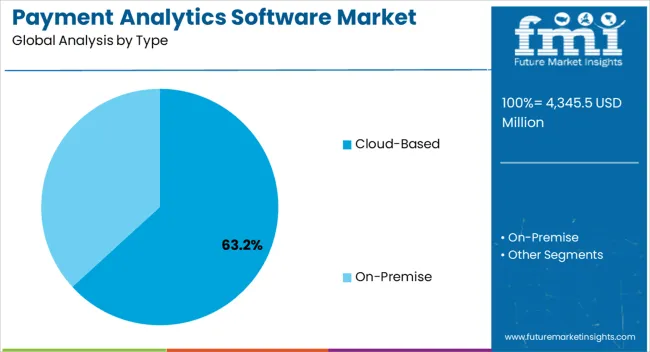
On-premise, deployment grows significantly in the Payment Analytics Software demand, with a historic CAGR of 11.4% and a forecast CAGR of 4.8% in 2023 to 2033. Due to the sensitive nature of payment data, businesses concerned about safety tend to prefer on-premise software. On-Premise software allows data to stay within an organization.

Cloud-based type dominated the market with a share of 65.5% in 2022. Organizations often prefer to keep their data on-premise due to concerns about storing their data in the cloud, which other organizations also access parallel. Cloud-based analytics, however, is the emerging trend due to its collaborative capacity, speed, and cost advantages.

There is a gradual shift to the cloud as security improvements of cloud-based systems increase, but organizations with sensitive information continue to prefer on-premise forms until the technology is more mature.
Competitive Landscape

Rival Companies Compete & Invest in Research and Development to Stay Ahead in the Market

At present, Payment Analytics Software providers are focused on developments that make it cheaper to handle larger and larger amounts of data, as well as on the more insightful analysis of collected data.

Recent Developments:

  • In February 2021, TSG, a global provider of business management software and integrated payments, announced the acquisition of Adaptive Analytics LLC., a leading data analytics and visualization tools provider. This acquisition is expected to hugely benefit TSG, as it enhances its capabilities to address the demands of a larger customer base, which eventually helps the company to increase its market share.
  • In February 2020, World Line, a French payment service provider, announced its intention to take over its competitor Ingenico for EUR 7.8 billion.
  • In November 2021, ACI Worldwide announced the launch of a new feature, Omni-Commerce Payment Analytics, which is a visually rich dashboard for Payment Analytics with multiple features such as fraud management, behavioral analysis and others.

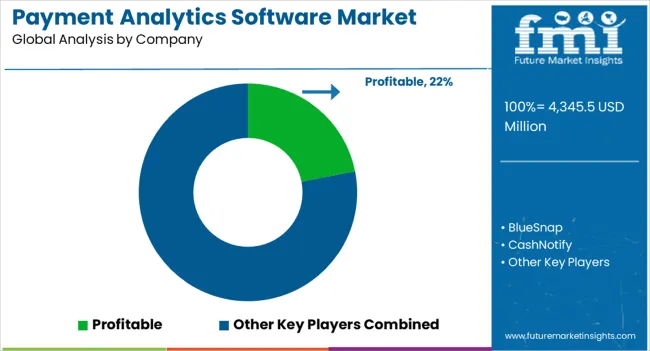
Key Players

  • Profitable
  • BlueSnap
  • CashNotify
  • Databox
  • HiPay Intelligence
  • IXOPAY
  • MRR.io
  • Payfirma
  • PaySketch
  • RJMetrics
  • Yapstone.

Key Segments

By Type:

  • Cloud-Based
  • On-Premise

By Application:

  • Large Companies
  • Small and Medium Companies

By Region:

  • North America
  • Europe
  • Asia Pacific
  • Middle East & Africa
  • Latin America

Frequently Asked Questions

What is the Growth Outlook of the Market?

An annual growth rate of 5% is anticipated for the market.

What is the Projected Value of the Market by 2023?

The market is expected to reach US$ 3, 941.5 million in 2023.

What is the Estimated Market Value in the United States?

The United States is likely to record a 4.5% CAGR through 2033.

Which Region Dominated the Global Market?

North America accounted for 30.4% of the global market in 2023.

Which Key Segment is Estimated to Lead the Market?

The on-premise segment is likely to hold 4.8% of the market.

Table of Content
1. Executive Summary
    1.1. Global Market Outlook
    1.2. Demand-side Trends
    1.3. Supply-side Trends
    1.4. Technology Roadmap Analysis
    1.5. Analysis and Recommendations
2. Market Overview
    2.1. Market Coverage / Taxonomy
    2.2. Market Definition / Scope / Limitations
3. Market Background
    3.1. Market Dynamics
        3.1.1. Drivers
        3.1.2. Restraints
        3.1.3. Opportunity
        3.1.4. Trends
    3.2. Scenario Forecast
        3.2.1. Demand in Optimistic Scenario
        3.2.2. Demand in Likely Scenario
        3.2.3. Demand in Conservative Scenario
    3.3. Opportunity Map Analysis
    3.4. Investment Feasibility Matrix
    3.5. PESTLE and Porter’s Analysis
    3.6. Regulatory Landscape
        3.6.1. By Key Regions
        3.6.2. By Key Countries
    3.7. Regional Parent Market Outlook
4. Global Market Analysis 2018 to 2022 and Forecast, 2023 to 2033
    4.1. Historical Market Size Value (US$ Million) Analysis, 2018 to 2022
    4.2. Current and Future Market Size Value (US$ Million) Projections, 2023 to 2033
        4.2.1. Y-o-Y Growth Trend Analysis
        4.2.2. Absolute $ Opportunity Analysis
5. Global Market Analysis 2018 to 2022 and Forecast 2023 to 2033, By Type
    5.1. Introduction / Key Findings
    5.2. Historical Market Size Value (US$ Million) Analysis By Type, 2018 to 2022
    5.3. Current and Future Market Size Value (US$ Million) Analysis and Forecast By Type, 2023 to 2033
        5.3.1. Cloud-Based
        5.3.2. On-Premise
    5.4. Y-o-Y Growth Trend Analysis By Type, 2018 to 2022
    5.5. Absolute $ Opportunity Analysis By Type, 2023 to 2033
6. Global Market Analysis 2018 to 2022 and Forecast 2023 to 2033, By Application
    6.1. Introduction / Key Findings
    6.2. Historical Market Size Value (US$ Million) Analysis By Application, 2018 to 2022
    6.3. Current and Future Market Size Value (US$ Million) Analysis and Forecast By Application, 2023 to 2033
        6.3.1. Large Companies
        6.3.2. Small and Medium Companies
    6.4. Y-o-Y Growth Trend Analysis By Application, 2018 to 2022
    6.5. Absolute $ Opportunity Analysis By Application, 2023 to 2033
7. Global Market Analysis 2018 to 2022 and Forecast 2023 to 2033, By Region
    7.1. Introduction
    7.2. Historical Market Size Value (US$ Million) Analysis By Region, 2018 to 2022
    7.3. Current Market Size Value (US$ Million) Analysis and Forecast By Region, 2023 to 2033
        7.3.1. North America
        7.3.2. Latin America
        7.3.3. Western Europe
        7.3.4. Eastern Europe
        7.3.5. South Asia and Pacific
        7.3.6. East Asia
        7.3.7. Middle East and Africa
    7.4. Market Attractiveness Analysis By Region
8. North America Market Analysis 2018 to 2022 and Forecast 2023 to 2033, By Country
    8.1. Historical Market Size Value (US$ Million) Trend Analysis By Market Taxonomy, 2018 to 2022
    8.2. Market Size Value (US$ Million) Forecast By Market Taxonomy, 2023 to 2033
        8.2.1. By Country
            8.2.1.1. USA
            8.2.1.2. Canada
        8.2.2. By Type
        8.2.3. By Application
    8.3. Market Attractiveness Analysis
        8.3.1. By Country
        8.3.2. By Type
        8.3.3. By Application
    8.4. Key Takeaways
9. Latin America Market Analysis 2018 to 2022 and Forecast 2023 to 2033, By Country
    9.1. Historical Market Size Value (US$ Million) Trend Analysis By Market Taxonomy, 2018 to 2022
    9.2. Market Size Value (US$ Million) Forecast By Market Taxonomy, 2023 to 2033
        9.2.1. By Country
            9.2.1.1. Brazil
            9.2.1.2. Mexico
            9.2.1.3. Rest of Latin America
        9.2.2. By Type
        9.2.3. By Application
    9.3. Market Attractiveness Analysis
        9.3.1. By Country
        9.3.2. By Type
        9.3.3. By Application
    9.4. Key Takeaways
10. Western Europe Market Analysis 2018 to 2022 and Forecast 2023 to 2033, By Country
    10.1. Historical Market Size Value (US$ Million) Trend Analysis By Market Taxonomy, 2018 to 2022
    10.2. Market Size Value (US$ Million) Forecast By Market Taxonomy, 2023 to 2033
        10.2.1. By Country
            10.2.1.1. Germany
            10.2.1.2. UK
            10.2.1.3. France
            10.2.1.4. Spain
            10.2.1.5. Italy
            10.2.1.6. Rest of Western Europe
        10.2.2. By Type
        10.2.3. By Application
    10.3. Market Attractiveness Analysis
        10.3.1. By Country
        10.3.2. By Type
        10.3.3. By Application
    10.4. Key Takeaways
11. Eastern Europe Market Analysis 2018 to 2022 and Forecast 2023 to 2033, By Country
    11.1. Historical Market Size Value (US$ Million) Trend Analysis By Market Taxonomy, 2018 to 2022
    11.2. Market Size Value (US$ Million) Forecast By Market Taxonomy, 2023 to 2033
        11.2.1. By Country
            11.2.1.1. Poland
            11.2.1.2. Russia
            11.2.1.3. Czech Republic
            11.2.1.4. Romania
            11.2.1.5. Rest of Eastern Europe
        11.2.2. By Type
        11.2.3. By Application
    11.3. Market Attractiveness Analysis
        11.3.1. By Country
        11.3.2. By Type
        11.3.3. By Application
    11.4. Key Takeaways
12. South Asia and Pacific Market Analysis 2018 to 2022 and Forecast 2023 to 2033, By Country
    12.1. Historical Market Size Value (US$ Million) Trend Analysis By Market Taxonomy, 2018 to 2022
    12.2. Market Size Value (US$ Million) Forecast By Market Taxonomy, 2023 to 2033
        12.2.1. By Country
            12.2.1.1. India
            12.2.1.2. Bangladesh
            12.2.1.3. Australia
            12.2.1.4. New Zealand
            12.2.1.5. Rest of South Asia and Pacific
        12.2.2. By Type
        12.2.3. By Application
    12.3. Market Attractiveness Analysis
        12.3.1. By Country
        12.3.2. By Type
        12.3.3. By Application
    12.4. Key Takeaways
13. East Asia Market Analysis 2018 to 2022 and Forecast 2023 to 2033, By Country
    13.1. Historical Market Size Value (US$ Million) Trend Analysis By Market Taxonomy, 2018 to 2022
    13.2. Market Size Value (US$ Million) Forecast By Market Taxonomy, 2023 to 2033
        13.2.1. By Country
            13.2.1.1. China
            13.2.1.2. Japan
            13.2.1.3. South Korea
        13.2.2. By Type
        13.2.3. By Application
    13.3. Market Attractiveness Analysis
        13.3.1. By Country
        13.3.2. By Type
        13.3.3. By Application
    13.4. Key Takeaways
14. Middle East and Africa Market Analysis 2018 to 2022 and Forecast 2023 to 2033, By Country
    14.1. Historical Market Size Value (US$ Million) Trend Analysis By Market Taxonomy, 2018 to 2022
    14.2. Market Size Value (US$ Million) Forecast By Market Taxonomy, 2023 to 2033
        14.2.1. By Country
            14.2.1.1. GCC Countries
            14.2.1.2. South Africa
            14.2.1.3. Israel
            14.2.1.4. Rest of MEA
        14.2.2. By Type
        14.2.3. By Application
    14.3. Market Attractiveness Analysis
        14.3.1. By Country
        14.3.2. By Type
        14.3.3. By Application
    14.4. Key Takeaways
15. Key Countries Market Analysis
    15.1. USA
        15.1.1. Pricing Analysis
        15.1.2. Market Share Analysis, 2022
            15.1.2.1. By Type
            15.1.2.2. By Application
    15.2. Canada
        15.2.1. Pricing Analysis
        15.2.2. Market Share Analysis, 2022
            15.2.2.1. By Type
            15.2.2.2. By Application
    15.3. Brazil
        15.3.1. Pricing Analysis
        15.3.2. Market Share Analysis, 2022
            15.3.2.1. By Type
            15.3.2.2. By Application
    15.4. Mexico
        15.4.1. Pricing Analysis
        15.4.2. Market Share Analysis, 2022
            15.4.2.1. By Type
            15.4.2.2. By Application
    15.5. Germany
        15.5.1. Pricing Analysis
        15.5.2. Market Share Analysis, 2022
            15.5.2.1. By Type
            15.5.2.2. By Application
    15.6. UK
        15.6.1. Pricing Analysis
        15.6.2. Market Share Analysis, 2022
            15.6.2.1. By Type
            15.6.2.2. By Application
    15.7. France
        15.7.1. Pricing Analysis
        15.7.2. Market Share Analysis, 2022
            15.7.2.1. By Type
            15.7.2.2. By Application
    15.8. Spain
        15.8.1. Pricing Analysis
        15.8.2. Market Share Analysis, 2022
            15.8.2.1. By Type
            15.8.2.2. By Application
    15.9. Italy
        15.9.1. Pricing Analysis
        15.9.2. Market Share Analysis, 2022
            15.9.2.1. By Type
            15.9.2.2. By Application
    15.10. Poland
        15.10.1. Pricing Analysis
        15.10.2. Market Share Analysis, 2022
            15.10.2.1. By Type
            15.10.2.2. By Application
    15.11. Russia
        15.11.1. Pricing Analysis
        15.11.2. Market Share Analysis, 2022
            15.11.2.1. By Type
            15.11.2.2. By Application
    15.12. Czech Republic
        15.12.1. Pricing Analysis
        15.12.2. Market Share Analysis, 2022
            15.12.2.1. By Type
            15.12.2.2. By Application
    15.13. Romania
        15.13.1. Pricing Analysis
        15.13.2. Market Share Analysis, 2022
            15.13.2.1. By Type
            15.13.2.2. By Application
    15.14. India
        15.14.1. Pricing Analysis
        15.14.2. Market Share Analysis, 2022
            15.14.2.1. By Type
            15.14.2.2. By Application
    15.15. Bangladesh
        15.15.1. Pricing Analysis
        15.15.2. Market Share Analysis, 2022
            15.15.2.1. By Type
            15.15.2.2. By Application
    15.16. Australia
        15.16.1. Pricing Analysis
        15.16.2. Market Share Analysis, 2022
            15.16.2.1. By Type
            15.16.2.2. By Application
    15.17. New Zealand
        15.17.1. Pricing Analysis
        15.17.2. Market Share Analysis, 2022
            15.17.2.1. By Type
            15.17.2.2. By Application
    15.18. China
        15.18.1. Pricing Analysis
        15.18.2. Market Share Analysis, 2022
            15.18.2.1. By Type
            15.18.2.2. By Application
    15.19. Japan
        15.19.1. Pricing Analysis
        15.19.2. Market Share Analysis, 2022
            15.19.2.1. By Type
            15.19.2.2. By Application
    15.20. South Korea
        15.20.1. Pricing Analysis
        15.20.2. Market Share Analysis, 2022
            15.20.2.1. By Type
            15.20.2.2. By Application
    15.21. GCC Countries
        15.21.1. Pricing Analysis
        15.21.2. Market Share Analysis, 2022
            15.21.2.1. By Type
            15.21.2.2. By Application
    15.22. South Africa
        15.22.1. Pricing Analysis
        15.22.2. Market Share Analysis, 2022
            15.22.2.1. By Type
            15.22.2.2. By Application
    15.23. Israel
        15.23.1. Pricing Analysis
        15.23.2. Market Share Analysis, 2022
            15.23.2.1. By Type
            15.23.2.2. By Application
16. Market Structure Analysis
    16.1. Competition Dashboard
    16.2. Competition Benchmarking
    16.3. Market Share Analysis of Top Players
        16.3.1. By Regional
        16.3.2. By Type
        16.3.3. By Application
17. Competition Analysis
    17.1. Competition Deep Dive
        17.1.1. Profitwell
            17.1.1.1. Overview
            17.1.1.2. Product Portfolio
            17.1.1.3. Profitability by Market Segments
            17.1.1.4. Sales Footprint
            17.1.1.5. Strategy Overview
                17.1.1.5.1. Marketing Strategy
        17.1.2. BlueSnap
            17.1.2.1. Overview
            17.1.2.2. Product Portfolio
            17.1.2.3. Profitability by Market Segments
            17.1.2.4. Sales Footprint
            17.1.2.5. Strategy Overview
                17.1.2.5.1. Marketing Strategy
        17.1.3. CashNotify
            17.1.3.1. Overview
            17.1.3.2. Product Portfolio
            17.1.3.3. Profitability by Market Segments
            17.1.3.4. Sales Footprint
            17.1.3.5. Strategy Overview
                17.1.3.5.1. Marketing Strategy
        17.1.4. Databox
            17.1.4.1. Overview
            17.1.4.2. Product Portfolio
            17.1.4.3. Profitability by Market Segments
            17.1.4.4. Sales Footprint
            17.1.4.5. Strategy Overview
                17.1.4.5.1. Marketing Strategy
        17.1.5. HiPay Intelligence
            17.1.5.1. Overview
            17.1.5.2. Product Portfolio
            17.1.5.3. Profitability by Market Segments
            17.1.5.4. Sales Footprint
            17.1.5.5. Strategy Overview
                17.1.5.5.1. Marketing Strategy
        17.1.6. IXOPAY
            17.1.6.1. Overview
            17.1.6.2. Product Portfolio
            17.1.6.3. Profitability by Market Segments
            17.1.6.4. Sales Footprint
            17.1.6.5. Strategy Overview
                17.1.6.5.1. Marketing Strategy
        17.1.7. MRR.io
            17.1.7.1. Overview
            17.1.7.2. Product Portfolio
            17.1.7.3. Profitability by Market Segments
            17.1.7.4. Sales Footprint
            17.1.7.5. Strategy Overview
                17.1.7.5.1. Marketing Strategy
        17.1.8. Payfirma
            17.1.8.1. Overview
            17.1.8.2. Product Portfolio
            17.1.8.3. Profitability by Market Segments
            17.1.8.4. Sales Footprint
            17.1.8.5. Strategy Overview
                17.1.8.5.1. Marketing Strategy
        17.1.9. PaySketch
            17.1.9.1. Overview
            17.1.9.2. Product Portfolio
            17.1.9.3. Profitability by Market Segments
            17.1.9.4. Sales Footprint
            17.1.9.5. Strategy Overview
                17.1.9.5.1. Marketing Strategy
        17.1.10. RJMetrics
            17.1.10.1. Overview
            17.1.10.2. Product Portfolio
            17.1.10.3. Profitability by Market Segments
            17.1.10.4. Sales Footprint
            17.1.10.5. Strategy Overview
                17.1.10.5.1. Marketing Strategy
        17.1.11. Yapstone
            17.1.11.1. Overview
            17.1.11.2. Product Portfolio
            17.1.11.3. Profitability by Market Segments
            17.1.11.4. Sales Footprint
            17.1.11.5. Strategy Overview
                17.1.11.5.1. Marketing Strategy
18. Assumptions & Acronyms Used
19. Research Methodology
Recommendations

Technology

Mobile Payment Transaction Market

October 2023

REP-GB-262

324 pages

Technology

App Analytics Market

July 2023

REP-GB-15539

324 pages

Explore Technology Insights

View Reports
Future Market Insights

Payment Analytics Software Market

Schedule a Call