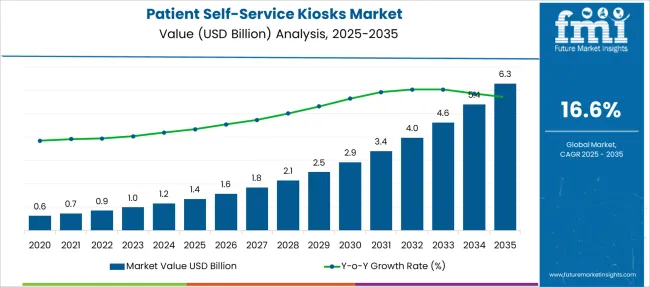
The Patient Self-Service Kiosks Market is estimated to be valued at USD 1.4 billion in 2025 and is projected to reach USD 6.3 billion by 2035, registering a compound annual growth rate (CAGR) of 16.6% over the forecast period.
| Metric | Value |
|---|---|
| Patient Self-Service Kiosks Market Estimated Value in (2025 E) | USD 1.4 billion |
| Patient Self-Service Kiosks Market Forecast Value in (2035 F) | USD 6.3 billion |
| Forecast CAGR (2025 to 2035) | 16.6% |
The patient self-service kiosks market is witnessing steady expansion, influenced by the digital transformation of healthcare infrastructure and the growing demand for contactless patient interactions. Increased focus on operational efficiency, patient data accuracy, and reduced administrative burden is motivating healthcare providers to integrate kiosks for functions like check-in, bill payment, and wayfinding.
Post-pandemic emphasis on infection control and social distancing has further accelerated adoption across both inpatient and outpatient care settings. Healthcare systems are leveraging these kiosks to improve front-desk throughput, enable multilingual accessibility, and automate repetitive processes.
Continuous improvements in kiosk hardware, user interface design, and interoperability with hospital information systems are enabling a more seamless patient experience. Looking forward, integration with electronic health records (EHR), insurance databases, and biometric verification systems is expected to unlock additional capabilities, aligning with the broader push for digital health optimization.
The market is segmented by Product Type, Component, End User, and Applications and region. By Product Type, the market is divided into Freestanding kiosks, Wall-mounted kiosks, Countertop kiosks, and Mobile kiosks. In terms of Component, the market is classified into Touchscreens, Data entry, Barcode readers (QR, 1, and 2 D barcode readers), Keyboard and Trackball, Electronic number pad, Audio speakers, Electronic signature pad, Printer, Point-Of-Sales (POS), Laser printers, Kiosk thermal printers, Cash transaction components, Debit and Credit Card readers, Cash acceptors and recyclers (Bill and Coin), and Magnetic stripe and Chip (EMV)/Optical card scanner. Based on End User, the market is segmented into Hospitals, Clinics, and Medical Centres. By Applications, the market is divided into Patient self-check-in, New-patient registration, Wayfinding assistance, Hospital directory, Update and verification of patient demographics, Multiple language support, Prescription refill ordering, Collection of co-payments and outstanding balances, and Other Applications. Regionally, the market is classified into North America, Latin America, Western Europe, Eastern Europe, Balkan & Baltic Countries, Russia & Belarus, Central Asia, East Asia, South Asia & Pacific, and the Middle East & Africa.
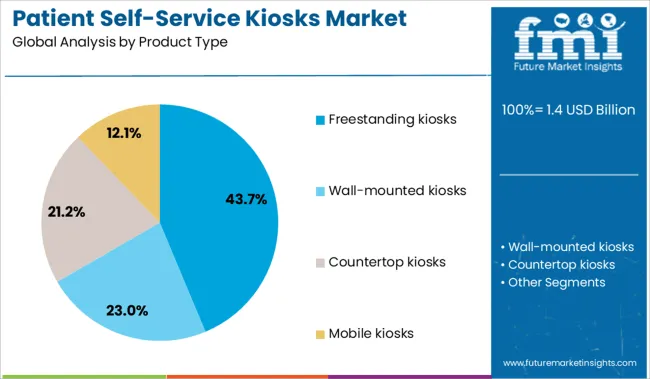
Freestanding kiosks are anticipated to account for 43.7% of the total market revenue in 2025, establishing them as the leading product type. Their popularity stems from ease of installation, all-in-one hardware integration, and adaptability to high-traffic environments such as hospital lobbies and outpatient centers.
These units typically offer enhanced stability, larger display interfaces, and customizable form factors making them well-suited for high-volume patient check-ins and queue management systems. Freestanding kiosks also enable ADA compliance and can accommodate add-ons like printers, scanners, and payment modules, thereby improving utility in multi-functional deployments.
Their minimal infrastructural dependency and mobility support scalability across various facility types, further reinforcing their lead position.
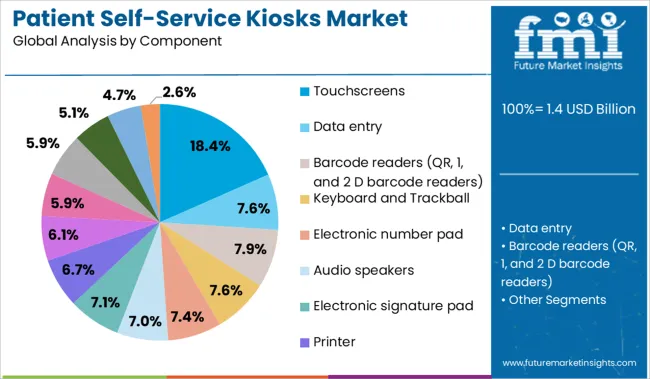
Touchscreens are projected to contribute 18.4% of the total revenue by 2025 within the component category, marking them as the most prominent interactive interface element. The growth of this segment is being influenced by enhanced user familiarity with capacitive and resistive touch technologies, as well as the demand for intuitive, responsive user experiences in healthcare environments.
Advanced touchscreen panels provide high brightness, antimicrobial coatings, and multi-language support, facilitating accessibility for diverse patient populations. Their integration into kiosk designs allows for quick, hygienic navigation and real-time input validation, which is critical in high-accuracy medical workflows.
The transition toward contactless and gesture-based technologies is also contributing to continued innovation within this component category.
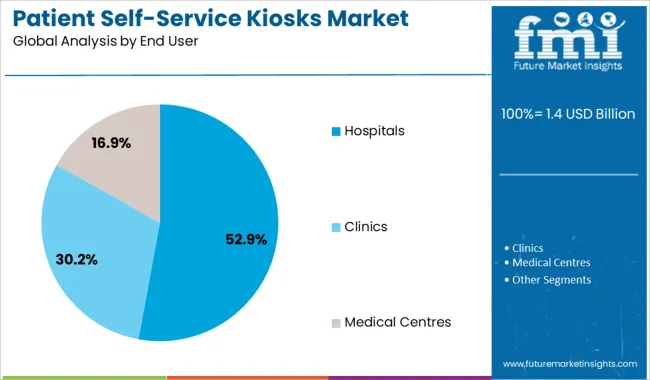
Hospitals are projected to command 52.9% of the total market revenue in 2025, ranking them as the top end user segment for patient self-service kiosks. This leadership is being driven by large patient volumes, complex scheduling systems, and the critical need for efficient administrative throughput.
Hospital adoption is further propelled by institutional priorities around minimizing wait times, improving patient satisfaction scores, and complying with data privacy regulations. Kiosks deployed in hospital settings streamline pre-registration, insurance validation, and consent form collection, allowing clinical staff to focus on care delivery.
Integration with backend hospital systems enhances workflow automation, while patient-facing digital interfaces help meet modern expectations around healthcare access and convenience. As hospitals continue to modernize their front-office infrastructure, kiosk implementation remains a strategic investment.
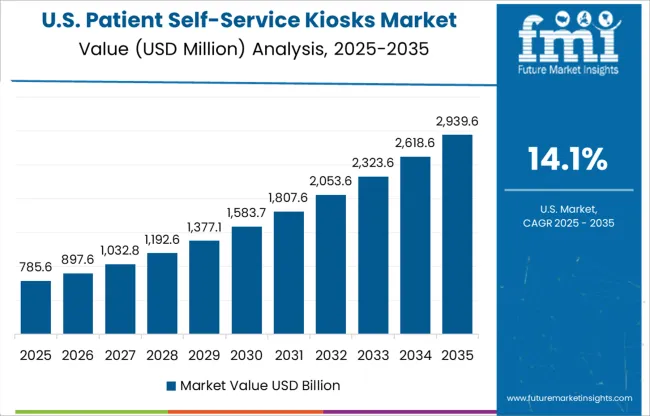
North America is currently the largest market for patient self-service kiosks, and during the forecast period, it is expected that it would remain the top-performing market. North America currently holds a market share of 36.9%.
It is anticipated that the North American digital health market is expected to grow at a CAGR of 27.8% during the forecast period. The patient self-service kiosks play a massive role in assisting patients in taking up virtual appointments as well. This might increase the demand for patient self-service kiosks in North America during the forecast period.
Additionally, a growing geriatric population in the region, coupled with an increase in chronic diseases amongst the general masses, is expected to fuel market growth. Furthermore, a rapid digital transformation of healthcare systems is expected to increase the patient self-service kiosk market share in North America.
The market growth is further bolstered by the active participation of start-ups. For example, Eyenuk is a global AI digital healthcare start-up and market leader in AI eye screening and AI predictive biomarkers and is making use of patient self-service kiosks to provide seamless service. The start-up had recently managed to raise USD 26 million in series A funding.
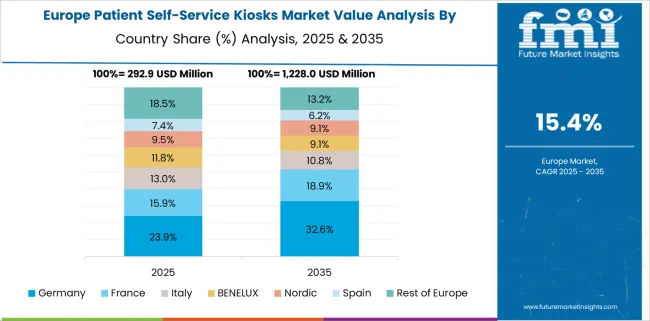
As per the analyst's viewpoint, the Europe market is expected to grow at a massive rate during the forecast period. Massive upgradation of technology, along with excellent internet connectivity and a dearth of medical professionals, is expected to fuel the market growth during the forecast period. Europe currently has a market share of 22.8%.
Increased adoption of smart devices, coupled with deep penetration of the internet in the region, is expected to further fuel the market growth. Moreover, people in this region have started adopting more remote healthcare systems, which might increase the sales of patient self-care service kiosks during the forecast period.
The stats suggest that nearly one-fourth of the total cancer cases around the world are registered in Europe. These suggest the fact that the demand for patient self-service kiosks is expected to increase in Europe.
The Asia Pacific market is expected to grow at a CAGR of an astounding 23%, which is supposed to be the highest CAGR. Rapidly increasing internet penetration, coupled with massive development in the healthcare infrastructure, is expected to drive the Asia Pacific market during the forecast period.
Moreover, the increased adoption of smartphones, coupled with increased usage of clinical information systems, is expected to boost the market growth. The adoption of a clinical information system eliminates the need for an in-person consultation, which presents a huge opportunity in front of the market.
Furthermore, an increase in the initiatives taken by the government and various regulatory authorities to provide the best healthcare facilities is expected to further boost market growth.
Reducing material costs
The usage of self-service kiosks helps in achieving cost-cutting by eliminating the need for hiring front office staff. Because of this, the hospitals do not have to invest in computers and telephones for the employees.
Personalized patient interaction
The adoption of self-service kiosks allows patients to have greater access to manage their journey, thus helping patients have personalized interactions. This helps patients achieve high satisfaction.
Payment collection assistance
Self-service kiosks help in hassle-free payment processes. Moreover, these also intimate the patients about overdue bills.
Improvement in operational efficiency
From checking in for patients to fully processing the payments, the self-service kiosks make operations easy and fast for both patients and hospitals. This enables the working personnel to focus more on important tasks.
Reduction in human errors
The application of patient self-service kiosks helps in reducing the error pertaining to data entry. The reason is that the patients themselves manage their detail, which would most likely increase the accuracy.
High cost of installation
One of the main drawbacks associated with self-service kiosks is the installation cost of these kiosks. The installation charges are more than tens of thousands of dollars a result of which many end users might have to think twice before installing these.
Increasing issues pertaining to cybercrime
Cybercrime is currently one of the biggest threats standing in the way of patient self-service kiosks market growth. One never knows when personal data would get hacked, and the hacker would misuse that data.
The USA is expected to be the largest market for patient self-service kiosks in North America during the forecast period.
Increased investment in Research and Development coupled with technological developments in the healthcare sector, is expected to drive the market during the forecast period. Based on National Health Council Report, more than 40% of the population residing in the USA is suffering from incurable chronic diseases. This as well presents a huge opportunity to the patient self-service kiosks market in the USA.
Based on the regional analysis, China had the highest market share of nearly 24% in 2024. High smartphone and internet penetration in the region makes China the largest market.
Moreover, the region has established a standard as far as a rapid digital transformation of the healthcare system is concerned. Additionally, the region is also home to a large number of elderly populations, which presents huge potential for the market.
If we talk about a country that is expected to grow at the fastest rate, it is Australia. The reason is that there is a growing awareness in the region regarding the usage of digital platforms for managing health records.
Apart from that, even the government in Australia is taking proactive steps to upgrade the existing healthcare infrastructure and is investing heavily in the technological aspects of the healthcare system.
Though the start-up ecosystem of self-serving kiosks is quiet in the healthcare sector, there is a lot happening in the food sector.
Flipdish is an Irish start-up that offers self-service kiosks for restaurants. It allows restaurants to dynamically control their menus by adding items directly from the Flipdish portal.
In January 2025, Flipdish managed to raise USD 100 million in a Series C funding round, which was headed by Tiger Global and Tencent.
The potential start-ups in the patient self-service kiosks market can draw parallels from the self-service kiosks start-ups operating in the food sector and can design their value chain, depending on the available resources.
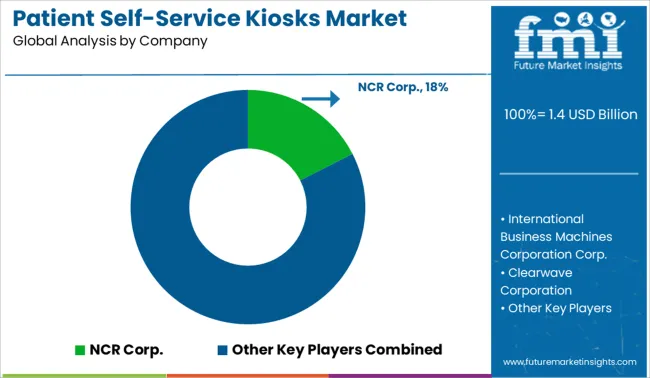
The key players in the patient self-service kiosks market are currently trying to achieve compliance certification to enhance consumer confidence. This is also done in an effort to ensure that the entire architecture protects software and client data.
Apart from that, the key players are also engaged in entering into strategic partnerships to further bolster their business.
Some of the recent developments:
| Report Attribute | Details |
|---|---|
| Growth Rate | CAGR of 16.6% from 2025 to 2035 |
| Base Year for Estimation | 2025 |
| Historical Data | 2020 to 2024 |
| Forecast Period | 2025 to 2035 |
| Quantitative Units | Revenue in USD Million and CAGR from 2025 to 2035 |
| Report Coverage | Revenue Forecast, Volume Forecast, Company Ranking, Competitive Landscape, Growth Factors, Trends, and Pricing Analysis |
| Segments Covered | Product Type, Component, End User, Applications, Region |
| Regions Covered | North America; Latin America; Asia Pacific; Middle East and Africa; Europe |
| Key Countries Profiled | The USA, Canada, Brazil, Argentina, Germany, The United Kingdom, France, Spain, Italy, Nordics, BENELUX, Australia & New Zealand, China, India, GCC Countries, South Africa |
| Key Companies Profiled | International Business Machines Corporation (IBM) Corp.; Clearwave Corporation; PFU-Fujitsu; SlabbKiosks; KIOSK Information Systems Inc.; Phoenix Kiosk Inc.; RedyRef Interactive Kiosks; EMBROSS Group Pty Ltd.; NCR Corp.; Meridian Kiosks LLC; Wincor Nixdorf Ag. |
| Customization | Available Upon Request |
The global patient self-service kiosks market is estimated to be valued at USD 1.4 billion in 2025.
The market size for the patient self-service kiosks market is projected to reach USD 6.3 billion by 2035.
The patient self-service kiosks market is expected to grow at a 16.6% CAGR between 2025 and 2035.
The key product types in patient self-service kiosks market are freestanding kiosks, wall-mounted kiosks, countertop kiosks and mobile kiosks.
In terms of component, touchscreens segment to command 18.4% share in the patient self-service kiosks market in 2025.


Our Research Products

The "Full Research Suite" delivers actionable market intel, deep dives on markets or technologies, so clients act faster, cut risk, and unlock growth.

The Leaderboard benchmarks and ranks top vendors, classifying them as Established Leaders, Leading Challengers, or Disruptors & Challengers.

Locates where complements amplify value and substitutes erode it, forecasting net impact by horizon

We deliver granular, decision-grade intel: market sizing, 5-year forecasts, pricing, adoption, usage, revenue, and operational KPIs—plus competitor tracking, regulation, and value chains—across 60 countries broadly.

Spot the shifts before they hit your P&L. We track inflection points, adoption curves, pricing moves, and ecosystem plays to show where demand is heading, why it is changing, and what to do next across high-growth markets and disruptive tech

Real-time reads of user behavior. We track shifting priorities, perceptions of today’s and next-gen services, and provider experience, then pace how fast tech moves from trial to adoption, blending buyer, consumer, and channel inputs with social signals (#WhySwitch, #UX).

Partner with our analyst team to build a custom report designed around your business priorities. From analysing market trends to assessing competitors or crafting bespoke datasets, we tailor insights to your needs.
Supplier Intelligence
Discovery & Profiling
Capacity & Footprint
Performance & Risk
Compliance & Governance
Commercial Readiness
Who Supplies Whom
Scorecards & Shortlists
Playbooks & Docs
Category Intelligence
Definition & Scope
Demand & Use Cases
Cost Drivers
Market Structure
Supply Chain Map
Trade & Policy
Operating Norms
Deliverables
Buyer Intelligence
Account Basics
Spend & Scope
Procurement Model
Vendor Requirements
Terms & Policies
Entry Strategy
Pain Points & Triggers
Outputs
Pricing Analysis
Benchmarks
Trends
Should-Cost
Indexation
Landed Cost
Commercial Terms
Deliverables
Brand Analysis
Positioning & Value Prop
Share & Presence
Customer Evidence
Go-to-Market
Digital & Reputation
Compliance & Trust
KPIs & Gaps
Outputs
Full Research Suite comprises of:
Market outlook & trends analysis
Interviews & case studies
Strategic recommendations
Vendor profiles & capabilities analysis
5-year forecasts
8 regions and 60+ country-level data splits
Market segment data splits
12 months of continuous data updates
DELIVERED AS:
PDF EXCEL ONLINE
Patient-Controlled Analgesia Pumps Market Size and Share Forecast Outlook 2025 to 2035
Patient Transportation Market Size and Share Forecast Outlook 2025 to 2035
Patient Handling Equipment Market Size and Share Forecast Outlook 2025 to 2035
Patient Monitoring System Market Size and Share Forecast Outlook 2025 to 2035
Patient Positioning Equipment Market Size and Share Forecast Outlook 2025 to 2035
Patient Monitoring Accessories Market Size and Share Forecast Outlook 2025 to 2035
Patient Recliners Market Size and Share Forecast Outlook 2025 to 2035
Patient Monitoring Devices Market Size and Share Forecast Outlook 2025 to 2035
Patient Transport Services Market Size and Share Forecast Outlook 2025 to 2035
Patient Engagement Platforms Market Size and Share Forecast Outlook 2025 to 2035
Patient Registry Software Market Size and Share Forecast Outlook 2025 to 2035
Patient Positioning System Analysis by Product Type and by End User through 2035
Patient Lateral Transfer Market - Innovations, Demand & Forecast 2035
Patient Identification Wristbands Market Analysis – Size, Trends & Forecast 2025 to 2035
Patient Hygiene Aids Market – Demand & Forecast 2024 to 2034
Patient Portal Market – Growth & Forecast 2024-2034
Patient-Controlled Injectors Market
Patient Health Management Market
Patient Monitoring Pods Market
Outpatient Clinics Market Trends and Forecast 2025 to 2035

Thank you!
You will receive an email from our Business Development Manager. Please be sure to check your SPAM/JUNK folder too.
Chat With
MaRIA