Pails Market Size and Share Forecast Outlook 2025 to 2035

The pails market is projected to grow from USD 2.1 billion in 2025 to USD 3.2 billion by 2035, registering a CAGR of 4.1% during the forecast period. Sales in 2024 reached USD 2.0 billion, driven by consistent demand across industrial coatings, food processing, and agrochemical sectors.

Quick Stats of Pails Market

  • Market Value (2025): USD 2.1 billion
  • Forecast Value (2035): USD 3.2 billion
  • Forecast CAGR: 4.1%
  • Material Leader in 2025: Plastic (68% market share)
  • Top End Use: Paints and Coatings (34% share)
  • Key Growth Region: Europe (European Union is the fastest-growing market with 4.4% CAGR)

The market has benefited from enhanced durability standards and logistical efficiency associated with stackable, reusable pail formats, especially in bulk storage and transport use cases. Growth has also been enabled by the rising preference for food-grade plastic and metal pails due to regulatory emphasis on hygienic transport. Long-term traction is expected from their rising integration in decentralized warehousing and farm packaging systems globally.

Plast-Box one of the leading manufacturers of plastic packaging opened another modern production and warehouse facility in Slupsk. New facility showcases advanced infrastructure that successfully combines advanced technology with efficiency. By using modern solutions such as the automation of processes, Plast-Box is set to increase production efficiency and flexibility. “This investment allows us to respond even faster and more accurately to the needs of our customers, wherever they are located in Europe, says Artur R. Skonieczny, Chief Commercial Officer of Plast-Box Group. ‘The modern facility in Slupsk enables us not only to boost our production capacity, but also to introduce greater flexibility in order management, which is crucial in today’s dynamic market reality. For our business partners, this means shorter lead times and still higher service quality for us, this is an opportunity to continue to reinforce our leadership position in the packaging industry”.

Eco-regulatory pressure has led to increased adoption of high-density polyethylene (HDPE) and polypropylene pails that meet both recyclability and food safety requirements. Innovations have focused on tamper-evident closures and odor-resistant interiors suitable for chemicals and edible contents. These design upgrades have improved shelf life, user confidence, and handling ease. Biodegradable coating integrations and solvent-free production lines have also been introduced to meet compliance in food and pharmaceutical packaging scenarios.

The market outlook for pails remains favorable as diversification into food, lubricant, and construction segments accelerates. Emphasis has been placed on product standardization for international bulk supply chains. Moreover, smart inventory tracking features and RFID integration are expected to support the shift toward automation-friendly packaging. Leading suppliers are likely to focus on product reusability, labor-saving ergonomic designs, and alignment with global safety and logistics mandates. Competitive positioning will depend on portfolio diversification, recyclability assurance, and end-user customization. Higher performance expectations will reshape product development strategies through 2035.

Analyzing Pails Market by Top Investment Segment

The market is segmented based on material, capacity, end use, and region. Materials primarily include plastic and metal, selected for their durability, chemical resistance, and compatibility with industrial and food-grade contents. These materials cater to both lightweight and heavy-duty applications, depending on the sector’s safety and shelf-life requirements.

Capacity segments range from up to 5 liters, 6-10 liters, 11-20 liters, and above 20 liters, aligning with transportation, dispensing, and storage demands across industries. End-use sectors include paints & coatings, inks, dyes & pigments, petroleum & lubricants, agrochemicals & fertilizers, food & beverage, and other industrial applications. Regional coverage includes North America, Latin America, East Asia, South Asia & Pacific, Eastern Europe, Western Europe, Oceania, and Middle East & Africa.

Plastic Dominates for Its Lightweight and Chemical Resistance

Plastic is estimated to account for around 68% of the pails market in 2025, due to its durability and cost-efficiency. High-density polyethylene and polypropylene have been predominantly used for their chemical resistance and lightweight characteristics. Their recyclability and impact strength have favored widespread use across construction and chemical sectors. Plastic pails have been chosen for both industrial-grade and consumer-grade products due to their sealing ability and ease of transportation. Advanced molding techniques have enabled custom sizes and shapes suitable for diverse product viscosities.

UV-resistant and food-grade variants have been incorporated for agrochemical and food applications respectively. Increasing demand for sustainable materials has led to the introduction of bio-based and PCR-content plastic pails. Manufacturers have offered tamper-evident and stackable designs to align with logistics and safety protocols.

Plastic pails have remained popular in paints, adhesives, lubricants, and sealants due to their compatibility with both hot and cold fill products. The option for high-resolution printing has improved shelf appeal in retail settings. Regulatory compliance and reduced per-unit cost have strengthened their preference in high-volume production. Global players have developed hybrid solutions combining rigid outer plastic layers with lightweight liners for reduced material consumption. The dominance of plastic pails is expected to continue as industries prioritize reusable and recyclable formats.

Regional packaging laws and plastic bans have influenced material innovations rather than complete shifts. Light weighting and barrier enhancements have improved sustainability metrics. Cost-effectiveness, transport efficiency, and compatibility with filling lines have ensured their continued relevance.
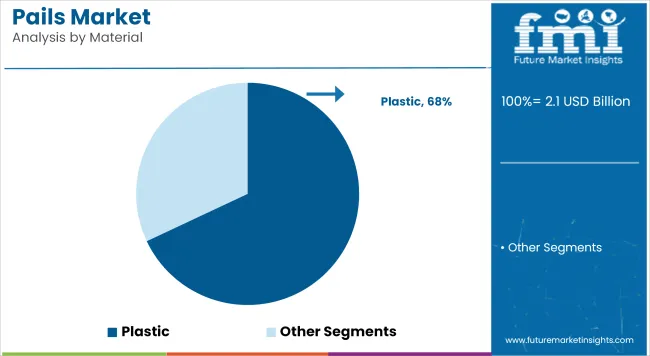
Pails Market Analysis By Material

Paints and Coatings Lead Due to Bulk Filling and Specialized Formulations

Paints and coatings are projected to hold the highest share of approximately 34% in the pails market by 2025. The segment has required pails with high stacking strength and chemical resistance for bulk handling. Both water-based and solvent-based formulations have been packed using airtight plastic or metal pails. Easy pouring spouts and Snap-On lids have supported efficiency in commercial and retail sales channels.

The surge in residential construction and renovation has driven demand for decorative paint pails. Industrial paints and automotive coatings have also contributed to high-volume packaging needs. In-mold labeling and color-coded packaging have been used for product differentiation in multiband portfolios. Pails with built-in liners and dual-layer structures have ensured compatibility with reactive chemical systems.

Paints have required packaging formats resistant to UV, corrosion, and temperature fluctuation. Pails designed with anti-leak features and ergonomic handles have improved end-user safety and ease of use. Market demand has pushed manufacturers to develop pails that comply with strict UN and DOT regulations. The inclusion of tinting and remix features has further diversified product needs.

Global infrastructure expansion, particularly in Asia-Pacific, has maintained growth momentum in the segment. OEMs and paint companies have collaborated to create custom packaging tailored for specific application needs. Innovations such as resalable lids and tamper-evident locking have boosted trust among both DIY and professional users. Paints & coatings are expected to remain the primary driver of unit sales in the industrial pails market.
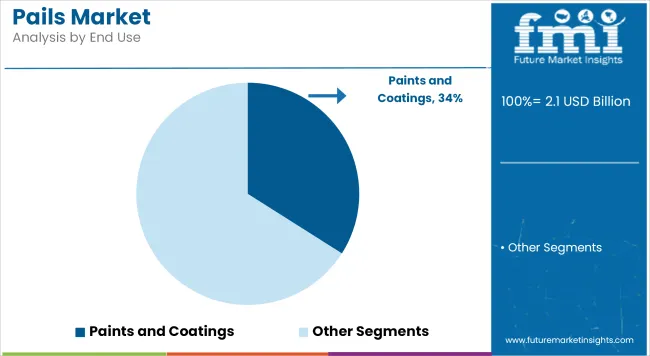
Pails Market Analysis By End Use

Challenges and Opportunities

Challenge

Fluctuating Raw Material Prices and Supply Chain Issues

The Pails Market, plagued by uneven raw material prices, particularly those of metal and plastic (which are both sensitive to world economic ebbs and flows), has been substantially affected. Fluctuations in these prices effect the costs of manufacture and therefore also the pricing strategy of pail producers. Moreover, in the current climate of geopolitical tensions, trade restrictions and logistical bottlenecks affecting supply chains, both lead times and costs for production have become inconsistent.

Environmental Regulations and Sustainability Pressure

With an increased emphasis on global environmental protection, there are ever-denuding regulations surrounding plastic use and garbage management. Demand for ecological, recyclable and biodegradable pail options is on the increase, however changing over to durable and cost-effective, sustainable materials remains an issue faced by the manufacturers.

Opportunity

Rising Demand from Food and Chemical Industries

The demand for sturdy, high quality pails in the food processing, chemicals, paints and construction industries is in any event propelling the market on all its fronts. The availability of pails in which liquid as well as solid materials can be put, together with innovations such as tamper-evident features and improved sealing properties furthers market potential.

Shift toward Sustainable and Customizable Solutions

Growing demand from consumers for sustainable packaging, manufacturers are turning to sustainable materials and business methods that close the loop rather than extend it. Also, the demand for custom pails with branding and ergonomic design has offered an eye-catching way of breaking through to new sources of growth. In some sectors like food packaging or consumer goods sub-divisions, this gives manufacturers the opportunity to innovate.

Country-wise Outlook

United States

In the United States, a market for pails is gradually taking shape. Several industries--from food processing to chemicals and construction--already have proven demands and are gradually expanding their scale of use. Sustainable and reusable packaging solutions is another trend driving the current vogue of pail models being mooted by business enterprises all over China as green ideas. Also, with materials such as high-density polystyrene the industry is developing still further.

Country CAGR (2025 to 2035)
United States 4.0%

United Kingdom

In the UK, the pails market is fueled by growing needs for food & beverage storage solutions as well as for paints and coatings storage vessels. An ongoing effort to cut down on packaging waste through recycle and reuse products has given rise to increasing demand in these areas. And with logistics needs in mind, manufacturers are also looking to the lighter weight and greater stack ability of pails today.

Country CAGR (2025 to 2035)
United Kingdom 4.1%

European Union

The European Union pails market is showing robust growth with the ongoing expansion of its chemical, pharmaceutical and food sectors, the European Union's pails market is booming. Germany and France are leading countries in implementing high-quality, regulation-compliant pail solutions. At the same time, the region-wide tendency to adopt circular economy practices gives us another shot in the arm for our market.

Region CAGR (2025 to 2035)
European Union 4.4%

South Korea

South Korea's pails market has been strongly growing, both in its overall scope and as regards individual application sectors like chemicals or heavy industry. An increasing demand for industrial grade products and a move towards environmentally friendly packaging solutions stand as key drivers. Plus, we see a steady improvement in pail designs: with every year that passes, technology gives more spill- and tamper-proof options of models on the market.

Country CAGR (2025 to 2035)
South Korea 4.3%

Competitive Outlook

The pails market is witnessing steady growth due to rising demand across industries such as chemicals, food & beverage, agriculture, and construction. These containers are essential for storage, transport, and handling of liquids, semi-solids, and granular products. Growth is further supported by increasing demand for sustainable and reusable packaging solutions.
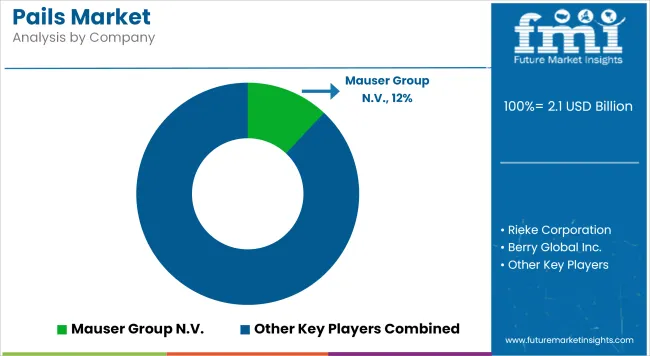
Pails Market Analysis By Company

Key Companies

  • Mauser Group N.V.
  • Rieke Corporation
  • Berry Global Inc.
  • FDL Packaging Group
  • Great Western Containers Inc.
  • Jokey SE
  • Time Technoplast Limited
  • ISI Plast Company
  • Cleveland Steel Container
  • WOLF PLASTIC

Segmentation

By Material Type:

  • Plastic
  • Metal

By End User:

  • Paints & Coatings
  • Inks, Dyes & Pigments
  • Petroleum & Lubricants
  • Agrochemicals & Fertilizers
  • Food & Beverage
  • Other Industrial

By Region:

  • North America
  • Latin America
  • Western Europe
  • Eastern Europe
  • East Asia
  • South Asia Pacific
  • Middle East and Africa

Table of Content

  1. Executive Summary
  2. Industry Introduction, including Taxonomy and Market Definition
  3. Market Trends and Success Factors, including Macro-economic Factors, Market Dynamics, and Recent Industry Developments
  4. Global Market Demand Analysis 2020 to 2024 and Forecast 2025 to 2035, including Historical Analysis and Future Projections
  5. Pricing Analysis
  6. Global Market Analysis 2020 to 2024 and Forecast 2025 to 2035
    • Material Type
    • End User
  7. Global Market Analysis 2020 to 2024 and Forecast 2025 to 2035, By Material Type
    • Plastic
    • Metal
  8. Global Market Analysis 2020 to 2024 and Forecast 2025 to 2035, By End User
    • Paints & Coatings
    • Inks, Dyes & Pigments
    • Petroleum & Lubricants
    • Agrochemicals & Fertilizers
    • Food & Beverage
    • Other Industrial
  9. Global Market Analysis 2020 to 2024 and Forecast 2025 to 2035, By Region
    • North America
    • Latin America
    • Western Europe
    • Eastern Europe
    • East Asia
    • South Asia Pacific
    • Middle East and Africa
  10. North America Sales Analysis 2020 to 2024 and Forecast 2025 to 2035, by Key Segments and Countries
  11. Latin America Sales Analysis 2020 to 2024 and Forecast 2025 to 2035, by Key Segments and Countries
  12. Western Europe Sales Analysis 2020 to 2024 and Forecast 2025 to 2035, by Key Segments and Countries
  13. Eastern Europe Sales Analysis 2020 to 2024 and Forecast 2025 to 2035, by Key Segments and Countries
  14. East Asia Sales Analysis 2020 to 2024 and Forecast 2025 to 2035, by Key Segments and Countries
  15. South Asia Pacific Sales Analysis 2020 to 2024 and Forecast 2025 to 2035, by Key Segments and Countries
  16. Middle East and Africa Sales Analysis 2020 to 2024 and Forecast 2025 to 2035, by Key Segments and Countries
  17. Sales Forecast 2025 to 2035 by Material Type and End User for 30 Countries
  18. Competition Outlook, including Market Structure Analysis, Company Share Analysis by Key Players, and Competition Dashboard
  19. Company Profile
    • Greif Inc.
    • Mauser Group N.V.
    • Rieke Corporation
    • Berry Global Inc.
    • M&M Industries Inc.
    • Involvement Packaging Ltd.
    • IPL Plastics Inc.
    • Plast Service Pack Company
    • Jokey Plastik Wipperfürth GmbH
    • Corcoran Products,

List of Tables

  • Table 1: Global Market Value (USD Million) Forecast by Region, 2020 to 2035
  • Table 2: Global Market Volume (Units) Forecast by Region, 2020 to 2035
  • Table 3: Global Market Value (USD Million) Forecast by Material, 2020 to 2035
  • Table 4: Global Market Volume (Units) Forecast by Material, 2020 to 2035
  • Table 5: Global Market Value (USD Million) Forecast by Capacity, 2020 to 2035
  • Table 6: Global Market Volume (Units) Forecast by Capacity, 2020 to 2035
  • Table 7: Global Market Value (USD Million) Forecast by End Use, 2020 to 2035
  • Table 8: Global Market Volume (Units) Forecast by End Use, 2020 to 2035
  • Table 9: North America Market Value (USD Million) Forecast by Country, 2020 to 2035
  • Table 10: North America Market Volume (Units) Forecast by Country, 2020 to 2035
  • Table 11: North America Market Value (USD Million) Forecast by Material, 2020 to 2035
  • Table 12: North America Market Volume (Units) Forecast by Material, 2020 to 2035
  • Table 13: North America Market Value (USD Million) Forecast by Capacity, 2020 to 2035
  • Table 14: North America Market Volume (Units) Forecast by Capacity, 2020 to 2035
  • Table 15: North America Market Value (USD Million) Forecast by End Use, 2020 to 2035
  • Table 16: North America Market Volume (Units) Forecast by End Use, 2020 to 2035
  • Table 17: Latin America Market Value (USD Million) Forecast by Country, 2020 to 2035
  • Table 18: Latin America Market Volume (Units) Forecast by Country, 2020 to 2035
  • Table 19: Latin America Market Value (USD Million) Forecast by Material, 2020 to 2035
  • Table 20: Latin America Market Volume (Units) Forecast by Material, 2020 to 2035
  • Table 21: Latin America Market Value (USD Million) Forecast by Capacity, 2020 to 2035
  • Table 22: Latin America Market Volume (Units) Forecast by Capacity, 2020 to 2035
  • Table 23: Latin America Market Value (USD Million) Forecast by End Use, 2020 to 2035
  • Table 24: Latin America Market Volume (Units) Forecast by End Use, 2020 to 2035
  • Table 25: Europe Market Value (USD Million) Forecast by Country, 2020 to 2035
  • Table 26: Europe Market Volume (Units) Forecast by Country, 2020 to 2035
  • Table 27: Europe Market Value (USD Million) Forecast by Material, 2020 to 2035
  • Table 28: Europe Market Volume (Units) Forecast by Material, 2020 to 2035
  • Table 29: Europe Market Value (USD Million) Forecast by Capacity, 2020 to 2035
  • Table 30: Europe Market Volume (Units) Forecast by Capacity, 2020 to 2035
  • Table 31: Europe Market Value (USD Million) Forecast by End Use, 2020 to 2035
  • Table 32: Europe Market Volume (Units) Forecast by End Use, 2020 to 2035
  • Table 33: East Asia Market Value (USD Million) Forecast by Country, 2020 to 2035
  • Table 34: East Asia Market Volume (Units) Forecast by Country, 2020 to 2035
  • Table 35: East Asia Market Value (USD Million) Forecast by Material, 2020 to 2035
  • Table 36: East Asia Market Volume (Units) Forecast by Material, 2020 to 2035
  • Table 37: East Asia Market Value (USD Million) Forecast by Capacity, 2020 to 2035
  • Table 38: East Asia Market Volume (Units) Forecast by Capacity, 2020 to 2035
  • Table 39: East Asia Market Value (USD Million) Forecast by End Use, 2020 to 2035
  • Table 40: East Asia Market Volume (Units) Forecast by End Use, 2020 to 2035
  • Table 41: South Asia Market Value (USD Million) Forecast by Country, 2020 to 2035
  • Table 42: South Asia Market Volume (Units) Forecast by Country, 2020 to 2035
  • Table 43: South Asia Market Value (USD Million) Forecast by Material, 2020 to 2035
  • Table 44: South Asia Market Volume (Units) Forecast by Material, 2020 to 2035
  • Table 45: South Asia Market Value (USD Million) Forecast by Capacity, 2020 to 2035
  • Table 46: South Asia Market Volume (Units) Forecast by Capacity, 2020 to 2035
  • Table 47: South Asia Market Value (USD Million) Forecast by End Use, 2020 to 2035
  • Table 48: South Asia Market Volume (Units) Forecast by End Use, 2020 to 2035
  • Table 49: Oceania Market Value (USD Million) Forecast by Country, 2020 to 2035
  • Table 50: Oceania Market Volume (Units) Forecast by Country, 2020 to 2035
  • Table 51: Oceania Market Value (USD Million) Forecast by Material, 2020 to 2035
  • Table 52: Oceania Market Volume (Units) Forecast by Material, 2020 to 2035
  • Table 53: Oceania Market Value (USD Million) Forecast by Capacity, 2020 to 2035
  • Table 54: Oceania Market Volume (Units) Forecast by Capacity, 2020 to 2035
  • Table 55: Oceania Market Value (USD Million) Forecast by End Use, 2020 to 2035
  • Table 56: Oceania Market Volume (Units) Forecast by End Use, 2020 to 2035
  • Table 57: Middle East and Africa Market Value (USD Million) Forecast by Country, 2020 to 2035
  • Table 58: Middle East and Africa Market Volume (Units) Forecast by Country, 2020 to 2035
  • Table 59: Middle East and Africa Market Value (USD Million) Forecast by Material, 2020 to 2035
  • Table 60: Middle East and Africa Market Volume (Units) Forecast by Material, 2020 to 2035
  • Table 61: Middle East and Africa Market Value (USD Million) Forecast by Capacity, 2020 to 2035
  • Table 62: Middle East and Africa Market Volume (Units) Forecast by Capacity, 2020 to 2035
  • Table 63: Middle East and Africa Market Value (USD Million) Forecast by End Use, 2020 to 2035
  • Table 64: Middle East and Africa Market Volume (Units) Forecast by End Use, 2020 to 2035

List of Figures

  • Figure 1: Global Market Value (USD Million) by Material, 2025 to 2035
  • Figure 2: Global Market Value (USD Million) by Capacity, 2025 to 2035
  • Figure 3: Global Market Value (USD Million) by End Use, 2025 to 2035
  • Figure 4: Global Market Value (USD Million) by Region, 2025 to 2035
  • Figure 5: Global Market Value (USD Million) Analysis by Region, 2020 to 2035
  • Figure 6: Global Market Volume (Units) Analysis by Region, 2020 to 2035
  • Figure 7: Global Market Value Share (%) and BPS Analysis by Region, 2025 to 2035
  • Figure 8: Global Market Y-o-Y Growth (%) Projections by Region, 2025 to 2035
  • Figure 9: Global Market Value (USD Million) Analysis by Material, 2020 to 2035
  • Figure 10: Global Market Volume (Units) Analysis by Material, 2020 to 2035
  • Figure 11: Global Market Value Share (%) and BPS Analysis by Material, 2025 to 2035
  • Figure 12: Global Market Y-o-Y Growth (%) Projections by Material, 2025 to 2035
  • Figure 13: Global Market Value (USD Million) Analysis by Capacity, 2020 to 2035
  • Figure 14: Global Market Volume (Units) Analysis by Capacity, 2020 to 2035
  • Figure 15: Global Market Value Share (%) and BPS Analysis by Capacity, 2025 to 2035
  • Figure 16: Global Market Y-o-Y Growth (%) Projections by Capacity, 2025 to 2035
  • Figure 17: Global Market Value (USD Million) Analysis by End Use, 2020 to 2035
  • Figure 18: Global Market Volume (Units) Analysis by End Use, 2020 to 2035
  • Figure 19: Global Market Value Share (%) and BPS Analysis by End Use, 2025 to 2035
  • Figure 20: Global Market Y-o-Y Growth (%) Projections by End Use, 2025 to 2035
  • Figure 21: Global Market Attractiveness by Material, 2025 to 2035
  • Figure 22: Global Market Attractiveness by Capacity, 2025 to 2035
  • Figure 23: Global Market Attractiveness by End Use, 2025 to 2035
  • Figure 24: Global Market Attractiveness by Region, 2025 to 2035
  • Figure 25: North America Market Value (USD Million) by Material, 2025 to 2035
  • Figure 26: North America Market Value (USD Million) by Capacity, 2025 to 2035
  • Figure 27: North America Market Value (USD Million) by End Use, 2025 to 2035
  • Figure 28: North America Market Value (USD Million) by Country, 2025 to 2035
  • Figure 29: North America Market Value (USD Million) Analysis by Country, 2020 to 2035
  • Figure 30: North America Market Volume (Units) Analysis by Country, 2020 to 2035
  • Figure 31: North America Market Value Share (%) and BPS Analysis by Country, 2025 to 2035
  • Figure 32: North America Market Y-o-Y Growth (%) Projections by Country, 2025 to 2035
  • Figure 33: North America Market Value (USD Million) Analysis by Material, 2020 to 2035
  • Figure 34: North America Market Volume (Units) Analysis by Material, 2020 to 2035
  • Figure 35: North America Market Value Share (%) and BPS Analysis by Material, 2025 to 2035
  • Figure 36: North America Market Y-o-Y Growth (%) Projections by Material, 2025 to 2035
  • Figure 37: North America Market Value (USD Million) Analysis by Capacity, 2020 to 2035
  • Figure 38: North America Market Volume (Units) Analysis by Capacity, 2020 to 2035
  • Figure 39: North America Market Value Share (%) and BPS Analysis by Capacity, 2025 to 2035
  • Figure 40: North America Market Y-o-Y Growth (%) Projections by Capacity, 2025 to 2035
  • Figure 41: North America Market Value (USD Million) Analysis by End Use, 2020 to 2035
  • Figure 42: North America Market Volume (Units) Analysis by End Use, 2020 to 2035
  • Figure 43: North America Market Value Share (%) and BPS Analysis by End Use, 2025 to 2035
  • Figure 44: North America Market Y-o-Y Growth (%) Projections by End Use, 2025 to 2035
  • Figure 45: North America Market Attractiveness by Material, 2025 to 2035
  • Figure 46: North America Market Attractiveness by Capacity, 2025 to 2035
  • Figure 47: North America Market Attractiveness by End Use, 2025 to 2035
  • Figure 48: North America Market Attractiveness by Country, 2025 to 2035
  • Figure 49: Latin America Market Value (USD Million) by Material, 2025 to 2035
  • Figure 50: Latin America Market Value (USD Million) by Capacity, 2025 to 2035
  • Figure 51: Latin America Market Value (USD Million) by End Use, 2025 to 2035
  • Figure 52: Latin America Market Value (USD Million) by Country, 2025 to 2035
  • Figure 53: Latin America Market Value (USD Million) Analysis by Country, 2020 to 2035
  • Figure 54: Latin America Market Volume (Units) Analysis by Country, 2020 to 2035
  • Figure 55: Latin America Market Value Share (%) and BPS Analysis by Country, 2025 to 2035
  • Figure 56: Latin America Market Y-o-Y Growth (%) Projections by Country, 2025 to 2035
  • Figure 57: Latin America Market Value (USD Million) Analysis by Material, 2020 to 2035
  • Figure 58: Latin America Market Volume (Units) Analysis by Material, 2020 to 2035
  • Figure 59: Latin America Market Value Share (%) and BPS Analysis by Material, 2025 to 2035
  • Figure 60: Latin America Market Y-o-Y Growth (%) Projections by Material, 2025 to 2035
  • Figure 61: Latin America Market Value (USD Million) Analysis by Capacity, 2020 to 2035
  • Figure 62: Latin America Market Volume (Units) Analysis by Capacity, 2020 to 2035
  • Figure 63: Latin America Market Value Share (%) and BPS Analysis by Capacity, 2025 to 2035
  • Figure 64: Latin America Market Y-o-Y Growth (%) Projections by Capacity, 2025 to 2035
  • Figure 65: Latin America Market Value (USD Million) Analysis by End Use, 2020 to 2035
  • Figure 66: Latin America Market Volume (Units) Analysis by End Use, 2020 to 2035
  • Figure 67: Latin America Market Value Share (%) and BPS Analysis by End Use, 2025 to 2035
  • Figure 68: Latin America Market Y-o-Y Growth (%) Projections by End Use, 2025 to 2035
  • Figure 69: Latin America Market Attractiveness by Material, 2025 to 2035
  • Figure 70: Latin America Market Attractiveness by Capacity, 2025 to 2035
  • Figure 71: Latin America Market Attractiveness by End Use, 2025 to 2035
  • Figure 72: Latin America Market Attractiveness by Country, 2025 to 2035
  • Figure 73: Europe Market Value (USD Million) by Material, 2025 to 2035
  • Figure 74: Europe Market Value (USD Million) by Capacity, 2025 to 2035
  • Figure 75: Europe Market Value (USD Million) by End Use, 2025 to 2035
  • Figure 76: Europe Market Value (USD Million) by Country, 2025 to 2035
  • Figure 77: Europe Market Value (USD Million) Analysis by Country, 2020 to 2035
  • Figure 78: Europe Market Volume (Units) Analysis by Country, 2020 to 2035
  • Figure 79: Europe Market Value Share (%) and BPS Analysis by Country, 2025 to 2035
  • Figure 80: Europe Market Y-o-Y Growth (%) Projections by Country, 2025 to 2035
  • Figure 81: Europe Market Value (USD Million) Analysis by Material, 2020 to 2035
  • Figure 82: Europe Market Volume (Units) Analysis by Material, 2020 to 2035
  • Figure 83: Europe Market Value Share (%) and BPS Analysis by Material, 2025 to 2035
  • Figure 84: Europe Market Y-o-Y Growth (%) Projections by Material, 2025 to 2035
  • Figure 85: Europe Market Value (USD Million) Analysis by Capacity, 2020 to 2035
  • Figure 86: Europe Market Volume (Units) Analysis by Capacity, 2020 to 2035
  • Figure 87: Europe Market Value Share (%) and BPS Analysis by Capacity, 2025 to 2035
  • Figure 88: Europe Market Y-o-Y Growth (%) Projections by Capacity, 2025 to 2035
  • Figure 89: Europe Market Value (USD Million) Analysis by End Use, 2020 to 2035
  • Figure 90: Europe Market Volume (Units) Analysis by End Use, 2020 to 2035
  • Figure 91: Europe Market Value Share (%) and BPS Analysis by End Use, 2025 to 2035
  • Figure 92: Europe Market Y-o-Y Growth (%) Projections by End Use, 2025 to 2035
  • Figure 93: Europe Market Attractiveness by Material, 2025 to 2035
  • Figure 94: Europe Market Attractiveness by Capacity, 2025 to 2035
  • Figure 95: Europe Market Attractiveness by End Use, 2025 to 2035
  • Figure 96: Europe Market Attractiveness by Country, 2025 to 2035
  • Figure 97: East Asia Market Value (USD Million) by Material, 2025 to 2035
  • Figure 98: East Asia Market Value (USD Million) by Capacity, 2025 to 2035
  • Figure 99: East Asia Market Value (USD Million) by End Use, 2025 to 2035
  • Figure 100: East Asia Market Value (USD Million) by Country, 2025 to 2035
  • Figure 101: East Asia Market Value (USD Million) Analysis by Country, 2020 to 2035
  • Figure 102: East Asia Market Volume (Units) Analysis by Country, 2020 to 2035
  • Figure 103: East Asia Market Value Share (%) and BPS Analysis by Country, 2025 to 2035
  • Figure 104: East Asia Market Y-o-Y Growth (%) Projections by Country, 2025 to 2035
  • Figure 105: East Asia Market Value (USD Million) Analysis by Material, 2020 to 2035
  • Figure 106: East Asia Market Volume (Units) Analysis by Material, 2020 to 2035
  • Figure 107: East Asia Market Value Share (%) and BPS Analysis by Material, 2025 to 2035
  • Figure 108: East Asia Market Y-o-Y Growth (%) Projections by Material, 2025 to 2035
  • Figure 109: East Asia Market Value (USD Million) Analysis by Capacity, 2020 to 2035
  • Figure 110: East Asia Market Volume (Units) Analysis by Capacity, 2020 to 2035
  • Figure 111: East Asia Market Value Share (%) and BPS Analysis by Capacity, 2025 to 2035
  • Figure 112: East Asia Market Y-o-Y Growth (%) Projections by Capacity, 2025 to 2035
  • Figure 113: East Asia Market Value (USD Million) Analysis by End Use, 2020 to 2035
  • Figure 114: East Asia Market Volume (Units) Analysis by End Use, 2020 to 2035
  • Figure 115: East Asia Market Value Share (%) and BPS Analysis by End Use, 2025 to 2035
  • Figure 116: East Asia Market Y-o-Y Growth (%) Projections by End Use, 2025 to 2035
  • Figure 117: East Asia Market Attractiveness by Material, 2025 to 2035
  • Figure 118: East Asia Market Attractiveness by Capacity, 2025 to 2035
  • Figure 119: East Asia Market Attractiveness by End Use, 2025 to 2035
  • Figure 120: East Asia Market Attractiveness by Country, 2025 to 2035
  • Figure 121: South Asia Market Value (USD Million) by Material, 2025 to 2035
  • Figure 122: South Asia Market Value (USD Million) by Capacity, 2025 to 2035
  • Figure 123: South Asia Market Value (USD Million) by End Use, 2025 to 2035
  • Figure 124: South Asia Market Value (USD Million) by Country, 2025 to 2035
  • Figure 125: South Asia Market Value (USD Million) Analysis by Country, 2020 to 2035
  • Figure 126: South Asia Market Volume (Units) Analysis by Country, 2020 to 2035
  • Figure 127: South Asia Market Value Share (%) and BPS Analysis by Country, 2025 to 2035
  • Figure 128: South Asia Market Y-o-Y Growth (%) Projections by Country, 2025 to 2035
  • Figure 129: South Asia Market Value (USD Million) Analysis by Material, 2020 to 2035
  • Figure 130: South Asia Market Volume (Units) Analysis by Material, 2020 to 2035
  • Figure 131: South Asia Market Value Share (%) and BPS Analysis by Material, 2025 to 2035
  • Figure 132: South Asia Market Y-o-Y Growth (%) Projections by Material, 2025 to 2035
  • Figure 133: South Asia Market Value (USD Million) Analysis by Capacity, 2020 to 2035
  • Figure 134: South Asia Market Volume (Units) Analysis by Capacity, 2020 to 2035
  • Figure 135: South Asia Market Value Share (%) and BPS Analysis by Capacity, 2025 to 2035
  • Figure 136: South Asia Market Y-o-Y Growth (%) Projections by Capacity, 2025 to 2035
  • Figure 137: South Asia Market Value (USD Million) Analysis by End Use, 2020 to 2035
  • Figure 138: South Asia Market Volume (Units) Analysis by End Use, 2020 to 2035
  • Figure 139: South Asia Market Value Share (%) and BPS Analysis by End Use, 2025 to 2035
  • Figure 140: South Asia Market Y-o-Y Growth (%) Projections by End Use, 2025 to 2035
  • Figure 141: South Asia Market Attractiveness by Material, 2025 to 2035
  • Figure 142: South Asia Market Attractiveness by Capacity, 2025 to 2035
  • Figure 143: South Asia Market Attractiveness by End Use, 2025 to 2035
  • Figure 144: South Asia Market Attractiveness by Country, 2025 to 2035
  • Figure 145: Oceania Market Value (USD Million) by Material, 2025 to 2035
  • Figure 146: Oceania Market Value (USD Million) by Capacity, 2025 to 2035
  • Figure 147: Oceania Market Value (USD Million) by End Use, 2025 to 2035
  • Figure 148: Oceania Market Value (USD Million) by Country, 2025 to 2035
  • Figure 149: Oceania Market Value (USD Million) Analysis by Country, 2020 to 2035
  • Figure 150: Oceania Market Volume (Units) Analysis by Country, 2020 to 2035
  • Figure 151: Oceania Market Value Share (%) and BPS Analysis by Country, 2025 to 2035
  • Figure 152: Oceania Market Y-o-Y Growth (%) Projections by Country, 2025 to 2035
  • Figure 153: Oceania Market Value (USD Million) Analysis by Material, 2020 to 2035
  • Figure 154: Oceania Market Volume (Units) Analysis by Material, 2020 to 2035
  • Figure 155: Oceania Market Value Share (%) and BPS Analysis by Material, 2025 to 2035
  • Figure 156: Oceania Market Y-o-Y Growth (%) Projections by Material, 2025 to 2035
  • Figure 157: Oceania Market Value (USD Million) Analysis by Capacity, 2020 to 2035
  • Figure 158: Oceania Market Volume (Units) Analysis by Capacity, 2020 to 2035
  • Figure 159: Oceania Market Value Share (%) and BPS Analysis by Capacity, 2025 to 2035
  • Figure 160: Oceania Market Y-o-Y Growth (%) Projections by Capacity, 2025 to 2035
  • Figure 161: Oceania Market Value (USD Million) Analysis by End Use, 2020 to 2035
  • Figure 162: Oceania Market Volume (Units) Analysis by End Use, 2020 to 2035
  • Figure 163: Oceania Market Value Share (%) and BPS Analysis by End Use, 2025 to 2035
  • Figure 164: Oceania Market Y-o-Y Growth (%) Projections by End Use, 2025 to 2035
  • Figure 165: Oceania Market Attractiveness by Material, 2025 to 2035
  • Figure 166: Oceania Market Attractiveness by Capacity, 2025 to 2035
  • Figure 167: Oceania Market Attractiveness by End Use, 2025 to 2035
  • Figure 168: Oceania Market Attractiveness by Country, 2025 to 2035
  • Figure 169: Middle East and Africa Market Value (USD Million) by Material, 2025 to 2035
  • Figure 170: Middle East and Africa Market Value (USD Million) by Capacity, 2025 to 2035
  • Figure 171: Middle East and Africa Market Value (USD Million) by End Use, 2025 to 2035
  • Figure 172: Middle East and Africa Market Value (USD Million) by Country, 2025 to 2035
  • Figure 173: Middle East and Africa Market Value (USD Million) Analysis by Country, 2020 to 2035
  • Figure 174: Middle East and Africa Market Volume (Units) Analysis by Country, 2020 to 2035
  • Figure 175: Middle East and Africa Market Value Share (%) and BPS Analysis by Country, 2025 to 2035
  • Figure 176: Middle East and Africa Market Y-o-Y Growth (%) Projections by Country, 2025 to 2035
  • Figure 177: Middle East and Africa Market Value (USD Million) Analysis by Material, 2020 to 2035
  • Figure 178: Middle East and Africa Market Volume (Units) Analysis by Material, 2020 to 2035
  • Figure 179: Middle East and Africa Market Value Share (%) and BPS Analysis by Material, 2025 to 2035
  • Figure 180: Middle East and Africa Market Y-o-Y Growth (%) Projections by Material, 2025 to 2035
  • Figure 181: Middle East and Africa Market Value (USD Million) Analysis by Capacity, 2020 to 2035
  • Figure 182: Middle East and Africa Market Volume (Units) Analysis by Capacity, 2020 to 2035
  • Figure 183: Middle East and Africa Market Value Share (%) and BPS Analysis by Capacity, 2025 to 2035
  • Figure 184: Middle East and Africa Market Y-o-Y Growth (%) Projections by Capacity, 2025 to 2035
  • Figure 185: Middle East and Africa Market Value (USD Million) Analysis by End Use, 2020 to 2035
  • Figure 186: Middle East and Africa Market Volume (Units) Analysis by End Use, 2020 to 2035
  • Figure 187: Middle East and Africa Market Value Share (%) and BPS Analysis by End Use, 2025 to 2035
  • Figure 188: Middle East and Africa Market Y-o-Y Growth (%) Projections by End Use, 2025 to 2035
  • Figure 189: Middle East and Africa Market Attractiveness by Material, 2025 to 2035
  • Figure 190: Middle East and Africa Market Attractiveness by Capacity, 2025 to 2035
  • Figure 191: Middle East and Africa Market Attractiveness by End Use, 2025 to 2035
  • Figure 192: Middle East and Africa Market Attractiveness by Country, 2025 to 2035

Frequently Asked Questions

What was the overall size of the pails market in 2025?

The overall market size for the pails market was USD 2.1 billion in 2025.

How big the bio is based pails market expected in 2035?

The pails market is expected to reach USD 3.2 billion in 2035.

What will drive the demand for pails market during the forecast period?

The demand for pails will be driven by rising consumption in paints & coatings, petroleum & lubricants, and agrochemicals industries, alongside growing preference for durable plastic pails and eco-friendly metal alternatives in food, beverage, and other industrial applications.

List the top 5 countries contributing in pails market?

The top 5 countries which drives the development of pails market are USA, European Union, Japan, South Korea and UK.

Which segment in type is expected to lead pails market?

Plastic Pails demand supplier to command significant share over the assessment period.

Explore Similar Insights

Future Market Insights

Pails Market