Orthopedic Navigation Systems Market Size and Share Forecast Outlook for 2025 to 2035

The orthopedic navigation systems market demonstrates predictable market expansion between 2025 and 2035 due to three primary factors which include precise surgical demands having increased prominence while musculoskeletal disorders rose steeply along with innovated minimal invasive orthopedic techniques.

Real-time data visualization alongside 3D displays offered by orthopedic navigation systems enables better implant positioning and error reduction resulting in superior patient recovery results.

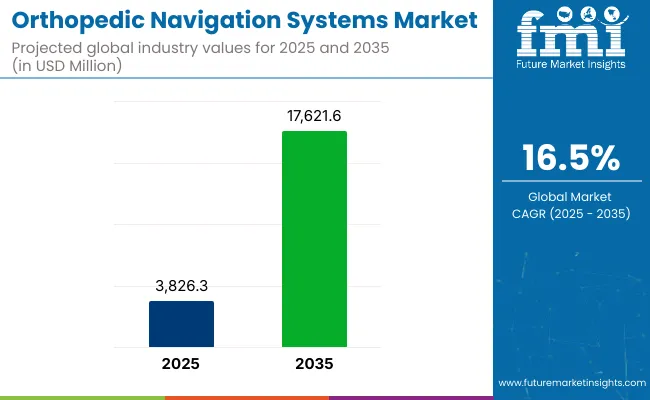
According to market forecasts the segment will exceed USD 3,826.3 million in 2025 before reaching USD 17,621.6 million by 2035 due to an anticipated 16.5% compound annual growth rate between these years.

The market grows because more people age and require joint replacement surgery while doctors accept robotic orthopedic procedures as the norm. Surgical efficiency and accuracy receive additional enhancements through technological innovations which incorporate AI-powered imaging and cloud-based navigation software and robotic system integration.

High machine expenses coupled with restricted accessibility in developing nations along with surgeons' difficult learning process serve as barriers which limit the market's adoption potential. The obstacles are overcome by manufacturers through the development of user-friendly interfaces and modular navigation frameworks and specific training measures that assist clinical adoption.

Key Market Metrics

Metric Value
Industry Size (2025E) USD 3,826.3 million
Industry Value (2035F) USD 17,621.6 million
CAGR (2025 to 2035) 16.5%

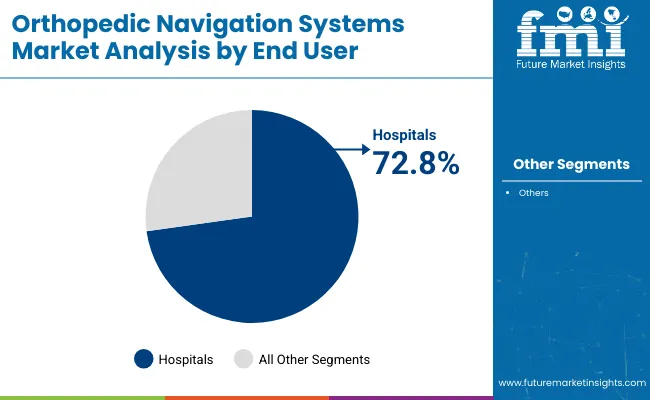
The orthopedic navigation systems market showcases two main segments through technology type and surgical application while experiencing rising customer orders from orthopedic hospitals and specialized surgical facilities.

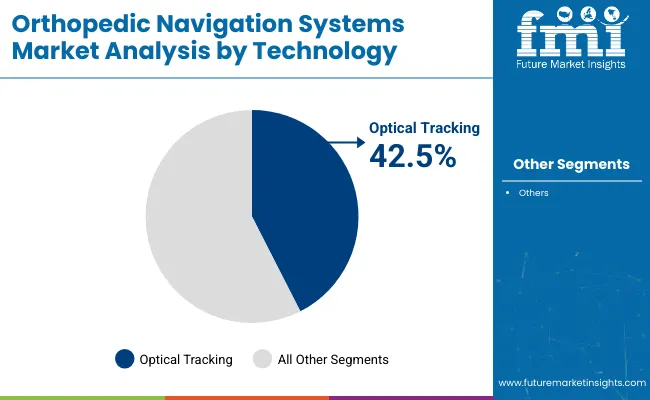
The primary technology groups consist of optical components with electromagnetic instruments and hybrid navigational systems. Optical systems control the market because of their precise performance capabilities while existing as the primary tool for joint replacement surgical procedures.

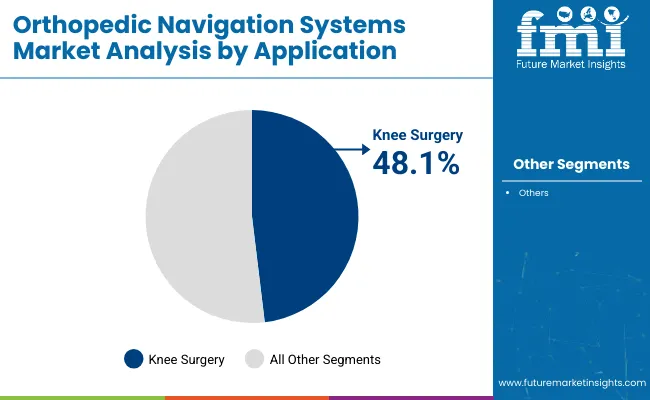
Medical procedures that undergo knee and hip replacements constitute leading market demand trends because navigation-assisted alignment methodology enables superior results and decreases revision necessity rates.

Spine surgical procedures experience quick adoption because they need detailed anatomical guidance while maintaining patient safety. Surgical benefit relies heavily on orthopedic navigation because procedural complexity demands its use for better results and reduced completely and lower postoperative difficulties.

Top Regional Trends Driving Orthopedic Navigation Systems Adoption

North America

The North America orthopedic navigation systems market leads the global landscape owing to well-established healthcare infrastructure, high volume of orthopedic procedures and prototype adoption of surgical technologies. Orthopedic care in North America United States and Canada employs robotic-integrated platforms and ongoing clinical training.

Europe

Aging demographics, increasing elective surgeries, and favourable reimbursement have been driving development within the Europe market. Germany, France, and the UK are at the forefront of smart navigation systems in the public and private healthcare.

Asia-Pacific

The orthopedic navigation systems market is highest in growth in the Asia-Pacific region, attributable to the growing healthcare investments, increasing medical tourism such as in Australia and the expansion of orthopedic surgery networks. Investment on smart hospital technologies to develop surgical precision tools in countries like China, India, Japan and South Korea is a key factor accelerating market adoption.

Challenges and Opportunities

Challenge: High Implementation Costs and Workflow Integration Barriers

High initial costs and complexity of surgical workflows surge; rugged orthopedic navigation systems market key challenge. These systems are expensive to adopt, requiring sophisticated imaging systems, specialized software interfaces and trained operators all major cost factors, especially in the current environment of mid-size hospitals and surgical centers.

In addition, existing navigation technologies may be compatible with traditional operating room (OR) setups, hospital information systems (HIS), and electronic health records (EHRs), which can cause problems with compatibility and disruption of workflows. Surgeons have to get used to this, and because of limited interoperability between systems, the technology may be too late or not used at all in real-time orthopedic surgeries.

Opportunity: Demand for Precision, Minimally Invasive Surgery, and Aging Population

Minimally invasive orthopedic methods guided by precision medicine roughly reflect the looming worldwide market for navigation systems. Due to the increasing incidence of musculoskeletal disorders, osteoarthritis, and traumatic injuries, primarily in the elderly population, hospitals now tend towards navigation systems to ensure greater surgical precision, alignment of the implant, and overall patient progress.

Joint replacements, spine surgeries and trauma cases are increasingly treated with navigation technologies, with benefits that include fewer revisions, faster recovery and lower radiation exposure. Advances in robot-assisted technologies, AI-enabled imaging, and mobile navigation systems are bolstering uptake among high volume surgical centres as well as those with specific specialties.
Shifts in the Orthopedic Navigation Systems Market from 2020 to 2024 and Future Trends 2025 to 2035

Joint reconstruction and spinal surgeries were the first major markets to see steady adoption of the technology between 2020 to 2024 with hospitals prioritizing intraoperative precision and patient safety. Due to integration of real-time imaging, CT-free workflows, robotic arm compatibility and so on, navigation systems followed suit. However, financial barriers, extended training periods, and limited reimbursement coverage precluded widespread use, particularly in resource-limited settings.

From 2025 until 2035, the market will transition to smart, AI-enabled navigation platforms with seamless data integration and real-time surgical analytics. The future systems will include cloud-based planning tools, haptic feedback, AR guidance, and predictive implant placement.

Demand for compact, mobile navigation units will be driven by an increase in day careorthopedic surgeries, customized implants, as well as extra outpatient centres. Moreover, value-based care models and digital patient monitoring will further root navigation systems into the healthcare ecosystem as they enable enhanced surgical efficiency and long-term clinical outcomes.

Market Shifts: A Comparative Analysis 2020 to 2024 vs. 2025 to 2035

Market Shift 2020 to 2024
Regulatory Landscape Focus on device approvals, surgical precision validation, and radiation safety.
Technological Advancements Growth of camera-based and CT-integrated navigation systems.
Sustainability Trends Interest in reusable instruments and imaging efficiency.
Market Competition Dominated by major medical device firms and robotic surgery manufacturers.
Industry Adoption Common in hip and knee replacements, spinal fusions, and trauma care.
Consumer Preferences Focus on shorter recovery time and reduced complications.
Market Growth Drivers Growth fuelled by aging population, surgical accuracy needs, and hospital investments.
Market Shift 2025 to 2035
Regulatory Landscape Emphasis on AI algorithm validation, real-time data security, and interoperability certification.
Technological Advancements Integration of AR overlays, AI surgical planning, and cloud-synced navigation interfaces.
Sustainability Trends Push for energy-efficient systems, digital workflow reduction, and e-waste minimization.
Market Competition Entry of AI-driven surgical tech startups and cloud-based OR navigation providers.
Industry Adoption Expansion into ambulatory surgical centers , pediatric orthopedic , and sports medicine clinics.
Consumer Preferences Preference for customized, digitally tracked, and minimally invasive orthopedic procedures.
Market Growth Drivers Expansion driven by robotics, AI integration, outpatient surgery growth, and personalized care.

Country-Wise Outlook

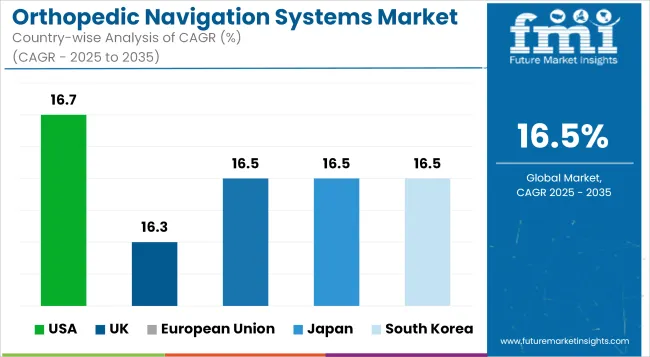
Orthopedic Navigation Systems Market Cagr Analysis By Country

United States

The United States orthopedic navigation systems industry expands quickly because doctors use modern surgical guidance technology more often and surgeons pursue minimally invasive procedures for orthopedic patients while people suffer from more joint conditions.

The growing number of surgical centers and hospitals purchase computer-assisted and image-guided navigation systems because these systems improve medical precision and they minimize recovery time and lead to better health results for patients.

Following the high rate of hip and knee replacement surgeries and the positive payment systems and dominant position of medical technology companiesadoption is swiftly increasing. Both robotic-assisted orthopedic platforms and real-time imaging software receive ongoing innovation that drives the expansion of the USA market.

Country CAGR (2025 to 2035)
USA 16.7%

United Kingdom

UK orthopedic navigation systems market will thrive on increasing use of digital appliances in surgical orthopedic, rising emphasis on minimizing the chances of revision surgeries and NHS backing precision care-based solutions. With respect to orthopedic procedures, intraoperative navigation systems are used by surgeons for improved alignment and implant placement.

In addition, the increasing prevalence of osteoarthritis and sports-related injuries, coupled with technological advancements in robotic-assisted joint surgeries, is creating demand for navigation-enabled surgical platforms. Investments in smart operating rooms and orthopedic robotics are also driving adoption across public and private hospitals.

Country CAGR (2025 to 2035)
UK 16.3%

European Union

The European Union orthopedic navigation systems market is driven by demographic trends, such as an aging population and high rates of orthopedic surgeries, as well as government initiatives to promote healthcare digitization. Europe has seen early adoption of AI-assisted and sensor-integrated navigation tools in orthopedic operating rooms, with countries such as Germany, France, and Netherlands leading the way.

European medtech companies are pouring millions into the development of augmented reality (AR), 3D imaging, and preoperative planning software that helps surgeons translate mapping to very complex and precise procedures. A yet another factor adding to market growth across orthopedic clinics and surgical centers is the region-wise focus on value-based care, patient safety, as well as outcome optimization.

Region CAGR (2025 to 2035)
European Union 16.5%

Japan

Japan is showing moderate growth in the orthopedic navigation systems industry due to an aging population, high prevalence of degenerative joint diseases, and support for precision medicine. In Japan, orthopedic surgeons are incorporating navigation systems and robotics into their operating procedures, performing work such as spinal surgeries and total joint replacements.

As minimally invasive techniques and patient-specific instrumentation in surgery continue to be at the forefront of research, the demand for real-time image-guided platforms as well as smart navigation devices will be driven to demonstrate that their use can significantly affect the surgical process in the context of Japanese hospitals. Japanese local medical device makers are also developing compact, highly accurate navigation systems that best suit Japan’s health care system.

Country CAGR (2025 to 2035)
Japan 16.5%

South Korea

The South Korea orthopedic navigation systems market is expected to grow in the forecast period owing to the factors such as an increase in smart hospitals investment, a growing acceptance of robotic-assisted surgery and an increase in orthopedic disease burden. On the surgery side, hospitals are employing navigation systems that leverage 3D imaging and intraoperative sensors to optimize surgical precision and minimize complication rates.

South Korea is taking on the role as market edifice in the field of other adaptive approaches to surgical procedure, like spine alignment, trauma reconstruction and knee arthroplasty, benefitting from the leadership in medical robotics and digital surgery platforms. Adoption across the country is also being accelerated by government initiatives driving digitized healthcare and surgical innovation.

Country CAGR (2025 to 2035)
South Korea 16.5%

Segmentation Outlook - Orthopedic Navigation Systems Market

Knee navigation systems and optical technologies lead precision-based orthopedic surgery across global healthcare facilities

The continuous growth of the orthopedic navigation systems market is attributed to the increasing demand for accurate, minimally invasive, and patient-specific orthopedic surgeries. Real-time guidance and intraoperative imaging are increasingly used by surgeons to improve outcomes and minimize risks in joint reconstruction and spinal procedures.

A detailed overview of orthopedic tools analysis by type is provided, as hospitals and surgical units overhaul their orthopedicdivisions commercial knee navigation solutions and optical-based solutions lie within the forefront of device implementation and modernization. These distinctions improve surgical precision, decrease complications, and allow orthopedic teams to provide optimal functional recovery for their patients.

Orthopedic surgeries assisted by navigation facilitate ideal alignment and position in joint replacements, and enhance decision-making during spinal surgeries. The demand for advanced surgical solutions is increasing as the world population ages and the burden of musculoskeletal disorders grows.

Across the globe, the orthopedic caseload is heavily knee-related while optical navigation platforms deliver surgeons the visual precision and integration necessary for successful outcomes. These segments provide insight into current clinical priorities, but also help shape the future direction of orthopedic technology development and investment.

Knee navigation systems lead adoption in orthopedic departments due to high procedure volume and alignment accuracy

Field of the invention in recent years, knee navigation systems have become widely utilized in orthopedic operating rooms of varying capacities due to their einzigartigen capability to offer increased precision and consistency associated with both total and partial knee arthroplasty methods.

These systems assist in precise alignment of the prosthetic components with the specific anatomy of the patient, resulting in improved function of the joint, decreased wear of the implant, and an overall reduction in the rates of revision surgery. As knee replacements are one of the most common orthopedic surgeries worldwide, navigation-assisted systems are an important progression for high-volume hospitals and specialized orthopedic clinics alike.

Knee navigation systems allow surgeons to visualize the femur and tibia in real time, track bone landmarks, and guide Resections within millimeter level. This assistance intra-operatively minimizes the risk for malalignment a key risk factor for implant failure and allows for patient-specific planning based on balancing soft tissues and correction of the mechanical axis. Such navigation systems further facilitate workflow with intuitive user interfaces, real-time feedback, and compatibility with surgical instruments, minimizing guesswork and improving reproducibility between cases.

Knee navigation systems have been incorporated into minimally invasive procedures and computer-assisted surgery protocols. These advancements result in less tissue disruption and lead to faster recovery and better postoperative outcomes in patients with osteoarthritis or traumatic knee damage. Joint reconstruction programs focusing on quality, safety, and value-based care metrics now consider these systems as a necessary upgrade.

Randomised clinical trials are still confirming the advantages knee navigation, with studies that are reporting increased long-term survivorship of the implants and better patient satisfaction. Healthcare payers and hospital administrators see these systems as tools that enable value-driven orthopedic care. As reimbursement practices adapt to incentivize clinical outcomes, knee navigation technologies will see broad adoption across different healthcare markets.

Knee navigation expands in public hospitals, specialized clinics, and ambulatory surgery centers

Knee surgical navigation systems are employed across multiple healthcare settings. These are adopted by public hospitals to standardize outcomes and manage high surgical volumes. They are increasingly incorporated into advanced procedural offerings at orthopedic specialty centers that attract patients who want precise, outcome-oriented interventions.

Embarking on the expansion of orthopedic services, ambulatory surgery centers (ASCs) have utilized navigation technology in an effort to build procedural confidence and decrease intraoperative variability in outpatient knee replacement.

As a response, medical device companies have developed portable, user-friendly navigation platforms to support smaller surgical settings. These systems take very little time to implement, in addition to integrating into existing imaging infrastructure, allowing for greater access, and usability. With increasing demand for knee intervention, and the expectation of maintaining standards of quality of care, knee navigation systems are well placed to provide the technology backbone to facilitate high-throughput, accurate and patient specific interventions.

Optical navigation technology leads the market through high accuracy, real-time visualization, and broad surgical integration

Optical navigation systems account for the largest share of orthopedic navigation technology as they allow for highly accurate, image-guided assistance through real-time camera tracking and reflective marker arrays. Some of these systems use infrared or visible light cameras in the operating room to track instruments and bone landmarks throughout the operation. Optical platforms provide a new way to create a virtual map of the anatomy to visualize joint orientation, tool trajectories, and implant positions with precision far superior to that of manual techniques.

Advantages of optical technology subject to its non-invasive tracking accuracy and the ability to integrate guided preoperative imaging such as CT or MRI scans. Intraoperatively, through a constant updating of tracking information, the system can provide real-time direction and reference for the respective alignment of cuts, placement of implants and assessment of anatomical geometries. This smooth integration assists surgeons to avoid soft tissue damage, maintain mechanical alignment, and improve the longevity of the implant particularly in joint replacement and spinal processes.

Hospitals favour optical systems because they are more reliable, emit less radiation and can be used for more types of orthopedic procedures. As these systems do not require intraoperative fluoroscopy, they present a safer option for both surgical teams and patients. Intraoperatively, their real-time visualization capabilities also minimize uncertainty and enable adjustments based on the real anatomical landscape rather than estimates.

Optical systems for surgery have become the norm in teaching hospitals and academic medical centers, as these environments are characterized by the necessity of advanced training and high complexity of cases requiring surgical support. Optical systems also lend themselves well to collaborative surgeries and procedural education, where numerous members of the team need to see and understand each step of the surgery as it is conducted.

Optical systems expand across hip, spine, and trauma surgery through scalability and versatility

While being the most critical component of knee surgeries, optical navigation systems also assist in hip replacements, spinal instrumentation, and complex trauma operations. In spinal surgery, these systems direct screw insertion, reduce nerve injuries, and enhance alignment during deformity corrections. The precision of spine surgery has been enhanced by optical tracking systems, enabling surgeons to safely traverse difficult vertebral anatomy with minimal use of fluoroscopy.

Optical systems play a significant role in measuring leg length, cup orientation, and offset during hip arthroplasty surgery to achieve symmetrical reconstruction. These abilities enhance joint function while minimizing complications like dislocation and limb length discrepancy. Trauma surgeons use optical guidance for fracture fixation, especially pelvic and acetabular fractures for which anatomical visualization is limited. These applications demonstrate the wide range of applicability and robustness of optical navigation platforms.

Robotic integration, AI, and augmented reality overlays are still being employed to refine optical systems by manufacturers. These enhanced features are designed to increase precision and reduce variability even more while providing customized solutions according to patient-specific anatomy. With orthopedic care continuing on its journey towards technology enabled precision, optical navigation systems will remain the gold standard of innovation and the preferred clinical systems.

Competitive Outlook

The orthopedic navigation systems market is a specialized and competitive sector within the orthopedic medical technology industry and is propelled by the increasing demand for minimally invasive surgeries and the need for more accurate implant positioning and procedural precision.

These systems support surgeons in intraoperative decision-making in knee or hip replacements and spinal procedures through image-guided, computer-assisted, and robotic integrated navigation. Critical players are orienting around AI-driven surgical planning, intraoperative data visualization and integration with robotic platforms. It serves medical device companies, orthopedic technology companies and imaging equipment makers that serve hospitals, surgical centers and academic research institutions.

Market Share Analysis by Company

Company Name Estimated Market Share (%)
Stryker Corporation 20-25%
Zimmer Biomet Holdings, Inc. 18-22%
Medtronic plc 12-16%
Smith & Nephew plc 8-12%
Brainlab AG 5-9%
Other Companies (combined) 25-30%

Key Company Offerings and Activities

Orthopedic Navigation Systems Market Analysis By Company

Company Name Key Offerings/Activities
Stryker Corporation Offers Mako SmartRobotics ™ system, combining 3D CT-based planning with robotic-arm assisted orthopedic procedures.
Zimmer Biomet Holdings, Inc. Provides Rosa® Knee and Hip systems, focusing on real-time feedback and precise implant positioning for joint replacement surgeries.
Medtronic plc Develops StealthStation ™ surgical navigation platforms, integrating AI and neuronavigation capabilities into orthopedic spine procedures.
Smith & Nephew plc Offers NAVIO™ Surgical System, delivering robot-free navigation and intraoperative mapping for knee arthroplasty.
Brainlab AG Specializes in image-guided orthopedic navigation, offering customizable planning platforms and seamless integration with existing OR system.

Key Company Insights

Stryker Corporation

Stryker dominates the orthopedic navigation segment with its MakoSmartRobotics™ platform, enabling robotic-assisted total knee, hip, and partial knee procedures with enhanced precision and patient-specific planning.

Zimmer Biomet Holdings, Inc.

Zimmer Biomet is known for its robotic-assisted and navigation-integrated surgical platforms, delivering quantitative data and dynamic soft tissue balancing during implant procedures.

Medtronic plc

Medtronic’s StealthStation™ systems are widely used in spine and neurosurgery, providing integrated imaging, trajectory guidance, and surgical analytics.

Smith & Nephew plc

Smith & Nephew’s NAVIO™ Surgical System supports real-time bone mapping and ligament balancing, without requiring preoperative imaging or CT scans.

Brainlab AG

Brainlab offers advanced software-driven navigation systems, optimizing surgical workflows with imaging, trajectory tracking, and interoperability across multiple surgical disciplines.

Other Key Players (25-30% Combined)

Several other companies contribute to the orthopedic navigation systems market, focusing on AI-enhanced navigation, compact system designs, and expanded application coverage in extremities and trauma care:

  • Globus Medical, Inc.
  • B.Braun Melsungen AG (Aesculap)
  • DePuySynthes (Johnson & Johnson)
  • OrthAlign, Inc.
  • Kinamed, Inc.
  • Scopis GmbH (acquired by Medtronic)
  • Fiagon GmbH

Orthopedic Navigation Systems Industry Analysis by Technology, Application, and End User

By Application:

  • Knee
  • Hip
  • Spine

By Technology:

  • Electromagnetic
  • Optical
  • Other Technologies

By End Use:

  • Hospitals
  • Ambulatory Surgery Centers

By Region:

  • North America
  • Latin America
  • Western Europe
  • Eastern Europe
  • East Asia
  • South Asia Pacific
  • Middle East and Africa

Table of Content

  1. Executive Summary
  2. Industry Introduction, including Taxonomy and Market Definition
  3. Market Trends and Success Factors, including Macro-economic Factors, Market Dynamics, and Recent Industry Developments
  4. Global Market Demand Analysis 2020 to 2024 and Forecast 2025 to 2035, including Historical Analysis and Future Projections
  5. Global Market Analysis 2020 to 2024 and Forecast 2025 to 2035
    • Technology
    • Application
    • End Use
  6. Global Market Analysis 2020 to 2024 and Forecast 2025 to 2035, By Technology
    • Electromagnetic
    • Optical
    • Other Technologies
  7. Global Market Analysis 2020 to 2024 and Forecast 2025 to 2035, By Application
    • Knee
    • Hip
    • Spine
  8. Global Market Analysis 2020 to 2024 and Forecast 2025 to 2035, By End Use
    • Hospitals
    • Ambulatory Surgery Centers
  9. Global Market Analysis 2020 to 2024 and Forecast 2025 to 2035, By Region
    • North America
    • Latin America
    • Western Europe
    • Eastern Europe
    • East Asia
    • South Asia Pacific
    • Middle East and Africa
  10. North America Sales Analysis 2020 to 2024 and Forecast 2025 to 2035, by Key Segments and Countries
  11. Latin America Sales Analysis 2020 to 2024 and Forecast 2025 to 2035, by Key Segments and Countries
  12. Western Europe Sales Analysis 2020 to 2024 and Forecast 2025 to 2035, by Key Segments and Countries
  13. Eastern Europe Sales Analysis 2020 to 2024 and Forecast 2025 to 2035, by Key Segments and Countries
  14. East Asia Sales Analysis 2020 to 2024 and Forecast 2025 to 2035, by Key Segments and Countries
  15. South Asia Pacific Sales Analysis 2020 to 2024 and Forecast 2025 to 2035, by Key Segments and Countries
  16. Middle East and Africa Sales Analysis 2020 to 2024 and Forecast 2025 to 2035, by Key Segments and Countries
  17. Sales Forecast 2025 to 2035 by Technology, Application, and End Use for 30 Countries
  18. Competition Outlook, including Market Structure Analysis, Company Share Analysis by Key Players, and Competition Dashboard
  19. Company Profile
    • Stryker Corporation
    • Medtronic plc
    • Zimmer Biomet Holdings, Inc.
    • Smith & Nephew plc
    • Brainlab AG
    • B. Braun Melsungen AG
    • DePuy Synthes (Johnson & Johnson)
    • OrthAlign, Inc.
    • Amplitude Surgical
    • Exactech, Inc.

List of Tables

Table 1: Global Market Value (US$ Bn), By Application, 2018 to 2022

Table 2: Global Market Value (US$ Bn), By Application, 2023 to 2033

Table 3: Global Market Value (US$ Bn), By Application, 2018 to 2022

Table 4: Global Market Value (US$ Bn), By Application, 2023 to 2033

Table 5: Global Market Value (US$ Bn), By Technology, 2018 to 2022

Table 6: Global Market Value (US$ Bn), By Technology, 2023 to 2033

Table 7: Global Market, By Region, 2018 to 2022

Table 8: Global Market, By Region, 2023 to 2033

Table 9: North America Market Value (US$ Bn), By Application, 2018 to 2022

Table 10: North America Market Value (US$ Bn), By Application, 2023 to 2033

Table 11: North America Market Value (US$ Bn), By Application, 2018 to 2022

Table 12: North America Market Value (US$ Bn), By Application, 2023 to 2033

Table 13: North America Market Value (US$ Bn), By Technology, 2018 to 2022

Table 14: North America Market Value (US$ Bn), By Technology, 2023 to 2033

Table 15: North America Market, By Country, 2018 to 2022

Table 16: North America Market, By Country, 2023 to 2033

Table 17: Latin America Market Value (US$ Bn), By Application, 2018 to 2022

Table 18: Latin America Market Value (US$ Bn), By Application, 2023 to 2033

Table 19: Latin America Market Value (US$ Bn), By Application, 2018 to 2022

Table 20: Latin America Market Value (US$ Bn), By Application, 2023 to 2033

Table 21: Latin America Market Value (US$ Bn), By Technology, 2018 to 2022

Table 22: Latin America Market Value (US$ Bn), By Technology, 2023 to 2033

Table 23: Latin America Market, By Country, 2018 to 2022

Table 24: Latin America Market, By Country, 2023 to 2033

Table 25: Europe Market Value (US$ Bn), By Application, 2018 to 2022

Table 26: Europe Market Value (US$ Bn), By Application, 2023 to 2033

Table 27: Europe Market Value (US$ Bn), By Application, 2018 to 2022

Table 28: Europe Market Value (US$ Bn), By Application, 2023 to 2033

Table 29: Europe Market Value (US$ Bn), By Technology, 2018 to 2022

Table 30: Europe Market Value (US$ Bn), By Technology, 2023 to 2033

Table 31: Europe Market, By Country, 2018 to 2022

Table 32: Europe Market, By Country, 2023 to 2033

Table 33: Asia Pacific Market Value (US$ Bn), By Application, 2018 to 2022

Table 34: Asia Pacific Market Value (US$ Bn), By Application, 2023 to 2033

Table 35: Asia Pacific Market Value (US$ Bn), By Application, 2018 to 2022

Table 36: Asia Pacific Market Value (US$ Bn), By Application, 2023 to 2033

Table 37: Asia Pacific Market Value (US$ Bn), By Technology, 2018 to 2022

Table 38: Asia Pacific Market Value (US$ Bn), By Technology, 2023 to 2033

Table 39: Asia Pacific Market, By Country, 2018 to 2022

Table 40: Asia Pacific Market, By Country, 2023 to 2033

Table 41: MEA Market Value (US$ Bn), By Application, 2018 to 2022

Table 42: MEA Market Value (US$ Bn), By Application, 2023 to 2033

Table 43: MEA Market Value (US$ Bn), By Application, 2018 to 2022

Table 44: MEA Market Value (US$ Bn), By Application, 2023 to 2033

Table 45: MEA Market Value (US$ Bn), By Technology, 2018 to 2022

Table 46: MEA Market Value (US$ Bn), By Technology, 2023 to 2033

Table 47: MEA Market, By Country, 2018 to 2022

Table 48: MEA Market, By Country, 2023 to 2033

Table 49: Global Market Incremental $ Opportunity, By Application, 2018 to 2022

Table 50: Global Market Incremental $ Opportunity, By Application, 2023 to 2033

Table 51: Global Market Incremental $ Opportunity, By Technology, 2018 to 2022

Table 52: Global Market Incremental $ Opportunity, By Region, 2023 to 2033

Table 53: North America Market Incremental $ Opportunity, By Application, 2018 to 2022

Table 54: North America Market Incremental $ Opportunity, By Application, 2023 to 2033

Table 55: North America Market Incremental $ Opportunity, By Technology, 2018 to 2022

Table 56: North America Market Incremental $ Opportunity, By Country, 2023 to 2033

Table 57: Latin America Market Incremental $ Opportunity, By Application, 2018 to 2022

Table 58: Latin America Market Incremental $ Opportunity, By Application, 2023 to 2033

Table 59: Latin America Market Incremental $ Opportunity, By Technology, 2018 to 2022

Table 60: Latin America Market Incremental $ Opportunity, By Country, 2023 to 2033

Table 61: Europe Market Incremental $ Opportunity, By Application, 2018 to 2022

Table 62: Europe Market Incremental $ Opportunity, By Application, 2023 to 2033

Table 63: Europe Market Incremental $ Opportunity, By Technology, 2018 to 2022

Table 64: Europe Market Incremental $ Opportunity, By Country, 2023 to 2033

Table 65: Asia Pacific Market Incremental $ Opportunity, By Application, 2018 to 2022

Table 66: Asia Pacific Market Incremental $ Opportunity, By Application, 2023 to 2033

Table 67: Asia Pacific Market Incremental $ Opportunity, By Technology, 2018 to 2022

Table 68: Asia Pacific Market Incremental $ Opportunity, By Country, 2023 to 2033

Table 69: MEA Market Incremental $ Opportunity, By Application, 2018 to 2022

Table 70: MEA Market Incremental $ Opportunity, By Application, 2023 to 2033

Table 71: MEA Market Incremental $ Opportunity, By Technology, 2018 to 2022

Table 72: MEA Market Incremental $ Opportunity, By Country, 2023 to 2033

List of Figures

Figure 1: Global Market Value (US$ Bn) and Year-on-Year Growth, 2018 to 2033

Figure 2: Global Market Absolute $ Historical Gain (2018 to 2022) and Opportunity (2023 to 2033), US$ Bn

Figure 3: Global Market Share, By Application, 2023 & 2033

Figure 4: Global Market Y-o-Y Growth Projections, By Application – 2023 to 2033

Figure 5: Global Market Attractiveness Index, By Application – 2023 to 2033

Figure 6: Global Market Share, By Application, 2023 & 2033

Figure 7: Global Market Y-o-Y Growth Projections, By Technology – 2023 to 2033

Figure 8: Global Market Attractiveness Index, By Technology – 2023 to 2033

Figure 9: Global Market Share, By Technology, 2023 & 2033

Figure 10: Global Market Y-o-Y Growth Projections, By End-use – 2023 to 2033

Figure 11: Global Market Attractiveness Index, By End-use – 2023 to 2033

Figure 12: Global Market Share, By Region, 2023 & 2033

Figure 13: Global Market Y-o-Y Growth Projections, By Region – 2023 to 2033

Figure 14: Global Market Attractiveness Index, By Region – 2023 to 2033

Figure 15: North America Market Value (US$ Bn) and Year-on-Year Growth, 2018 to 2033

Figure 16: North America Market Absolute $ Opportunity Historical (2018 to 2022) and Forecast Period (2023 to 2033), US$ Bn

Figure 17: North America Market Share, By Application, 2023 & 2033

Figure 18: North America Market Y-o-Y Growth Projections, By Application – 2023 to 2033

Figure 19: North America Market Attractiveness Index, By Application – 2023 to 2033

Figure 20: North America Market Share, By Application, 2023 & 2033

Figure 21: North America Market Y-o-Y Growth Projections, By Technology – 2023 to 2033

Figure 22: North America Market Attractiveness Index, By Technology – 2023 to 2033

Figure 23: North America Market Share, By Technology, 2023 & 2033

Figure 24: North America Market Y-o-Y Growth Projections, By End-use – 2023 to 2033

Figure 25: North America Market Attractiveness Index, By End-use – 2023 to 2033

Figure 26: North America Market Share, By Country, 2023 & 2033

Figure 27: North America Market Y-o-Y Growth Projections, By Country – 2023 to 2033

Figure 28: North America Market Attractiveness Index, By Country – 2023 to 2033

Figure 29: Latin America Market Value (US$ Bn) and Year-on-Year Growth, 2018 to 2033

Figure 30: Latin America Market Absolute $ Opportunity Historical (2018 to 2022) and Forecast Period (2023 to 2033), US$ Bn

Figure 31: Latin America Market Share, By Application, 2023 & 2033

Figure 32: Latin America Market Y-o-Y Growth Projections, By Application– 2023 to 2033

Figure 33: Latin America Market Attractiveness Index, By Application– 2023 to 2033

Figure 34: Latin America Market Share, By Application, 2023 & 2033

Figure 35: Latin America Market Y-o-Y Growth Projections, By Technology– 2023 to 2033

Figure 36: Latin America Market Attractiveness Index, By Technology– 2023 to 2033

Figure 37: Latin America Market Share, By Technology, 2023 & 2033

Figure 38: Latin America Market Y-o-Y Growth Projections, By End-use– 2023 to 2033

Figure 39: Latin America Market Attractiveness Index, By End-use– 2023 to 2033

Figure 40: Latin America Market Share, By Country, 2023 & 2033

Figure 41: Latin America Market Y-o-Y Growth Projections, By Country – 2023 to 2033

Figure 42: Latin America Market Attractiveness Index, By Country – 2023 to 2033

Figure 43: Europe Market Value (US$ Bn) and Year-on-Year Growth, 2018 to 2033

Figure 44: Europe Market Absolute $ Opportunity Historical (2018 to 2022) and Forecast Period (2023 to 2033), US$ Bn

Figure 45: Europe Market Share, By Application, 2023 & 2033

Figure 46: Europe Market Y-o-Y Growth Projections, By Application– 2023 to 2033

Figure 47: Europe Market Attractiveness Index, By Application– 2023 to 2033

Figure 48: Europe Market Share, By Application, 2023 & 2033

Figure 49: Europe Market Y-o-Y Growth Projections, By Technology– 2023 to 2033

Figure 50: Europe Market Attractiveness Index, By Technology– 2023 to 2033

Figure 51: Europe Market Share, By Technology, 2023 & 2033

Figure 52: Europe Market Y-o-Y Growth Projections, By End-use– 2023 to 2033

Figure 53: Europe Market Attractiveness Index, By End-use– 2023 to 2033

Figure 54: Europe Market Share, By Country, 2023 & 2033

Figure 55: Europe Market Y-o-Y Growth Projections, By Country – 2023 to 2033

Figure 56: Europe Market Attractiveness Index, By Country – 2023 to 2033

Figure 57: MEA Market Value (US$ Bn) and Year-on-Year Growth, 2018 to 2033

Figure 58: MEA Market Absolute $ Opportunity Historical (2018 to 2022) and Forecast Period (2023 to 2033), US$ Bn

Figure 59: MEA Market Share, By Application, 2023 & 2033

Figure 60: MEA Market Y-o-Y Growth Projections, By Application– 2023 to 2033

Figure 61: MEA Market Attractiveness Index, By Application– 2023 to 2033

Figure 62: MEA Market Share, By Application, 2023 & 2033

Figure 63: MEA Market Y-o-Y Growth Projections, By Application– 2023 to 2033

Figure 64: MEA Market Attractiveness Index, By Application– 2023 to 2033

Figure 65: MEA Market Share, By Technology, 2023 & 2033

Figure 66: MEA Market Y-o-Y Growth Projections, By End-use– 2023 to 2033

Figure 67: MEA Market Attractiveness Index, By End-use– 2023 to 2033

Figure 68: MEA Market Share, By Country, 2023 & 2033

Figure 69: MEA Market Y-o-Y Growth Projections, By Country – 2023 to 2033

Figure 70: MEA Market Attractiveness Index, By Country – 2023 to 2033

Figure 71: Asia Pacific Market Value (US$ Bn) and Year-on-Year Growth, 2018 to 2033

Figure 72: Asia Pacific Market Absolute $ Opportunity Historical (2018 to 2022) and Forecast Period (2023 to 2033), US$ Bn

Figure 73: Asia Pacific Market Share, By Application, 2023 & 2033

Figure 74: Asia Pacific Market Y-o-Y Growth Projections, By Application– 2023 to 2033

Figure 75: Asia Pacific Market Attractiveness Index, By Application– 2023 to 2033

Figure 76: Asia Pacific Market Share, By Application, 2023 & 2033

Figure 77: Asia Pacific Market Y-o-Y Growth Projections, By Technology– 2023 to 2033

Figure 78: Asia Pacific Market Attractiveness Index, By Technology– 2023 to 2033

Figure 79: Asia Pacific Market Share, By Technology, 2023 & 2033

Figure 80: Asia Pacific Market Y-o-Y Growth Projections, By End-use– 2023 to 2033

Figure 81: Asia Pacific Market Attractiveness Index, By End-use– 2023 to 2033

Figure 82: Asia Pacific Market Share, By Country, 2023 & 2033

Figure 83: Asia Pacific Market Y-o-Y Growth Projections, By Country – 2023 to 2033

Figure 84: Asia Pacific Market Attractiveness Index, By Country – 2023 to 2033

Figure 85: US Market Value (US$ Bn) and Forecast, 2023 to 2033

Figure 86: US Market Share, By Application, 2022

Figure 87: US Market Share, By Application, 2022

Figure 88: US Market Share, By Technology, 2022

Figure 89: Canada Market Value (US$ Bn) and Forecast, 2023 to 2033

Figure 90: Canada Market Share, By Application, 2022

Figure 91: Canada Market Share, By Application, 2022

Figure 92: Canada Market Share, By Technology, 2022

Figure 93: Brazil Market Value (US$ Bn) and Forecast, 2023 to 2033

Figure 94: Brazil Market Share, By Application, 2022

Figure 95: Brazil Market Share, By Application, 2022

Figure 96: Brazil Market Share, By Technology, 2022

Figure 97: Mexico Market Value (US$ Bn) and Forecast, 2023 to 2033

Figure 98: Mexico Market Share, By Application, 2022

Figure 99: Mexico Market Share, By Application, 2022

Figure 100: Mexico Market Share, By Technology, 2022

Figure 101: Germany Market Value (US$ Bn) and Forecast, 2023 to 2033

Figure 102: Germany Market Share, By Application, 2022

Figure 103: Germany Market Share, By Application, 2022

Figure 104: Germany Market Share, By Technology, 2022

Figure 105: United kingdom Market Value (US$ Bn) and Forecast, 2023 to 2033

Figure 106: United kingdom Market Share, By Application, 2022

Figure 107: United kingdom Market Share, By Application, 2022

Figure 108: United kingdom Market Share, By Technology, 2022

Figure 109: France Market Value (US$ Bn) and Forecast, 2023 to 2033

Figure 110: France Market Share, By Application, 2022

Figure 111: France Market Share, By Application, 2022

Figure 112: France Market Share, By Technology, 2022

Figure 113: Italy Market Value (US$ Bn) and Forecast, 2023 to 2033

Figure 114: Italy Market Share, By Application, 2022

Figure 115: Italy Market Share, By Application, 2022

Figure 116: Italy Market Share, By Technology, 2022

Figure 117: India Market Value (US$ Bn) and Forecast, 2023 to 2033

Figure 118: India Market Share, By Application, 2022

Figure 119: India Market Share, By Application, 2022

Figure 120: India Market Share, By Technology, 2022

Figure 121: Russia Countries Market Value (US$ Bn) and Forecast, 2023 to 2033

Figure 122: Russia Countries Market Share, By Application, 2022

Figure 123: Russia Countries Market Share, By Application, 2022

Figure 124: Russia Countries Market Share, By Technology, 2022

Figure 125: China Market Value (US$ Bn) and Forecast, 2023 to 2033

Figure 126: China Market Share, By Application, 2022

Figure 127: China Market Share, By Application, 2022

Figure 128: China Market Share, By Technology, 2022

Figure 129: Japan Market Value (US$ Bn) and Forecast, 2023 to 2033

Figure 130: Japan Market Share, By Application, 2022

Figure 131: Japan Market Share, By Application, 2022

Figure 132: Japan Market Share, By Technology, 2022

Figure 133: South Korea Market Value (US$ Bn) and Forecast, 2023 to 2033

Figure 134: South Korea Market Share, By Application, 2022

Figure 135: South Korea Market Share, By Application, 2022

Figure 136: South Korea Market Share, By Technology, 2022

Figure 137: Spain Market Value (US$ Bn) and Forecast, 2023 to 2033

Figure 138: Spain Market Share, By Application, 2022

Figure 139: Spain Market Share, By Application, 2022

Figure 140: Spain Market Share, By Technology, 2022

Figure 141: South Africa Market Value (US$ Bn) and Forecast, 2023 to 2033

Figure 142: South Africa Market Share, By Application, 2022

Figure 143: South Africa Market Share, By Application, 2022

Figure 144: South Africa Market Share, By Technology, 2022

Figure 145: Saudi Arabia Market Value (US$ Bn) and Forecast, 2023 to 2033

Figure 146: Saudi Arabia Market Share, By Application, 2022

Figure 147: Saudi Arabia Market Share, By Application, 2022

Figure 148: Saudi Arabia Market Share, By Technology, 2022

Frequently Asked Questions

What was the overall size of the orthopedic navigation systems market in 2025?

The overall market size for the orthopedic navigation systems market was USD 3,826.3 million in 2025.

How big is the orthopedic navigation systems market expected to be in 2035?

The orthopedic navigation systems market is expected to reach USD 17,621.6 million in 2035.

What will drive the demand for the orthopedic navigation systems market during the forecast period?

The increasing demand for precision in joint replacement surgeries, rising adoption of minimally invasive procedures, and growing use of advanced optical technologies fuel the orthopedic navigation systems market during the forecast period.

List the top 5 countries contributing to the orthopedic navigation systems market.

The top 5 countries driving the development of the orthopedic navigation systems market are the USA, UK, European Union, Japan, and South Korea.

Which segment in type is expected to lead in the orthopedic navigation systems market?

Knee navigation systems and optical technologies lead market growth to command a significant share over the assessment period.

Explore Similar Insights

Future Market Insights

Orthopedic Navigation Systems Market