Oncology Information Systems Market Size and Share Forecast Outlook 2025 to 2035

The global spending on oncology information systems market is estimated to be valued at USD 3.2 billion in 2025 and is projected to reach USD 6.4 billion by 2035, registering a compound annual growth rate of 7.2% over the forecast period.
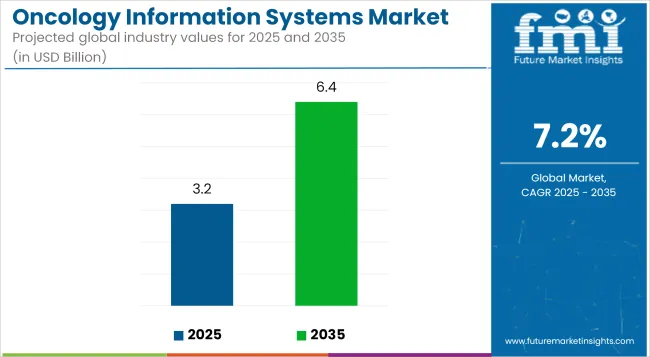
‍Quick Stats for Oncology Information Systems Market

  • Industry Value (2025): USD 3.2 billion
  • Forecast Value (2035): USD 6.4 billion
  • Forecast CAGR: 7.2%
  • Leading Segment in 2025: Software (Solution)
  • Key Growth Region: Asia-Pacific (China, India, Japan, South Korea)
  • Top Key Players: Varian Medical Systems, Elekta AB, Koninklijke Philips N.V., McKesson Corporation, Siemens Healthineers, Cerner Corporation, Epic Systems Corporation, GE Healthcare, CureMD
Oncology Information Systems Market Industry Value Analysis
Metric Value
Market Size in 2025 USD 3.2 billion
Projected Market Size in 2035 USD 6.4 billion
CAGR (2025 to 2035) 7.2%

The oncology information systems market is evolving rapidly due to rising cancer cases and the need for integrated, data-driven care. Hospitals and Cancer Research Institutes are adopting oncology information systems platforms to streamline workflows, enhance patient data accuracy and support personalized treatment planning.

Technological advancements like AI integration and cloud-based deployment are accelerating adoption, especially in resource-constrained settings. Healthcare policies promoting digital transformation and value-based care are further propelling demand. Additionally, the need for interoperability with existing EHRs is shaping vendor strategies and innovation.

As healthcare providers focus on efficiency, precision medicine, and outcome-based care, oncology information systems is positioned as a critical enabler of future-ready oncology infrastructure. Growth opportunities lie in cloud adoption, real-time analytics, and cross-platform integration.

Analyzing Oncology Information Systems Market by Top Investment Segments

Software Segment Leads the Market Owing to Digitization of Oncology Workflow and Demand for Interoperable Data Systems

The software segment has been observed to dominate the oncology information systems market, accounting for approximately 58% of revenue share in 2025. This growth has been primarily driven by the increasing integration of digital tools across oncology practices.

Comprehensive patient data management, electronic health records (EHR), and clinical decision support systems have been widely adopted to enhance treatment accuracy and workflow efficiency. The need to consolidate patient information, streamline treatment planning, and comply with regulatory standards has further accelerated software adoption.

Cloud-based platforms and AI-powered analytics have also been embedded to improve predictive modeling and patient monitoring. Moreover, the flexibility to interface with other hospital systems has been cited as a major enabler of this segment's success.

Vendor investments in modular, interoperable solutions have been prioritized by healthcare institutions to support precision oncology approaches. As oncology practices become more digitally mature, the preference for software-centric oncology information systems platforms is expected to remain high across developed and emerging markets.
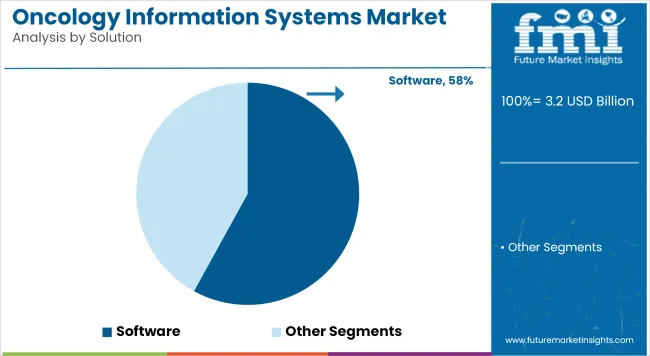
Oncology Information Systems Market Analysis By Solution

Fully Integrated Systems Dominates Due to Centralized Decision-Making and Seamless Multi-Department Connectivity

In 2025, fully integrated platforms is estimated to account a revenue share of 65.3%. This dominance has been linked to growing clinical emphasis on centralized systems that reduce duplication of work and unify diagnostic, therapeutic, and administrative workflows. Fully integrated systems have been widely preferred by healthcare providers to achieve seamless coordination between radiology, oncology, pathology, and patient records.

These systems have also enabled synchronized scheduling, billing, and outcome tracking, thereby improving operational efficiency. Their adoption has been reinforced by the pressing need to reduce medical errors and improve compliance with institutional protocols. Hospitals and cancer research institutes have increasingly opted for these platforms to reduce dependency on disparate systems and optimize staff productivity.

The integration of clinical intelligence tools within these oncology information systems platforms has also enhanced treatment planning capabilities, particularly in multi-specialty environments. As treatment complexity increases, integrated systems are expected to remain the preferred deployment model across oncology networks.

Clinical Diagnostics & Treatment Pathway Leads Market Owing to Rising Demand for Early Detection and Personalized Cancer Care

With a 72.1% revenue share, the clinical diagnostics & treatment segment has emerged as the most dominant application in the oncology information systems market in 2025. This prominence has been supported by the increasing prioritization of early-stage cancer detection and data-driven treatment planning across oncology departments.

The integration of imaging data, pathology results, and genetic insights into a unified system has been enabled by oncology information systems platforms, streamlining clinical decisions and enhancing outcome predictability.

Greater focus on real-time monitoring, radiotherapy planning, and biomarker-driven protocols has also fueled the usage of oncology information systems in this application area. Furthermore, the shift toward value-based healthcare delivery has placed strong emphasis on patient-centric diagnostics and precision therapy, making this application a critical focus for both public and private cancer centers.

Challenges and Opportunities

Challenge

Integration with Existing Healthcare Systems

There are enormous challenges for the Oncology Information Systems (OIS) market as new technologies are integrated into an existing medical environment and infrastructure. However, many healthcare facilities still use old systems unable to connect with modern oncology information systems. The result is data silos and inefficiencies.

Regulatory Compliance and Data Security

OIS providers face another obstacle in the form of strong regulatory requirements concerning patient data privacy (such as HIPAA in the USA or GDPR in Europe). How to be in compliance yet retain seamless interoperability and secure storage of patient data is an area for concern still being hammered out by all players in this market.

Opportunity

Advancements in AI and Big Data Analytics

Artificial intelligence (AI) and vast data analyses have taken hold in oncology. This is a huge opportunity for the OIS market. AI-fuelled analyses will help oncologists with finer diagnoses and treatment recommendations by examining through large amounts of patient data, and imaging and genetic information.

Rising Incidence of Cancer and Demand for Personalized Medicine

A growing cancer burden means the demand for advanced oncology information systems is on the increase around the world. Also, the transition from standardized therapy to targeted medicine-drugs and radiation modified depending upon a patient's genetic profile or combination of molecular markersmakes it all the more crucial to have a solid OIS platform than can effectively handle complex patient data.

Country-wise Outlook

United States

A growing market for oncology information systems in the United States comes as a result of an increasing incidence of cancer and a concerted upgrading in healthcare infrastructure. Also important are the installing of electronic health records (EHRs) on behalf of healthcare professionals and the move from paper charts to various cloud-based solutions for patient management.

Further business incentives are provided through government initiatives toward the digital transformation and precision of medical services. For major health care agencies and educational institutions, the introduction of AI-driven solutions that assist in diagnosing and treating cancer is a concrete step towards making the conduct of their business more science-based.

Country CAGR (2025 to 2035)
United States 7.0%

United Kingdom

The United Kingdom's OIS market is shifting toward mainstream as more cases of cancer arrive and improved digital healthcare systems are established. By integrating AI and big data analytics into oncology systems, the quality of care available to cancer patients is raised.

Initiatives to expand cancer research and make the health service digital by the British government offer OIS supplier’s ample opportunities. As well the energy and creativity which technology firms bring to oncology software solutions as they join forces with medical research establishments.

Country CAGR (2025 to 2035)
United Kingdom 7.3%

European Union

In the European Union, the market for Oncology Information Systems has turned into a big business; more and more people under treatment for cancer means both better analytic quality depending on big data and tighter healthcare controls leading towards digitalization In AI-driven patient management platforms and cloud-based oncology systems Europe is a major user region, with leaders such as Germany turning to these new technology advances.

Even more important is the European emphasis on early cancer detection and precision medicine, both of which serve to reinforce demand for OIS solutions. European nations are beginning to invest heavily in digital healthcare infrastructure as they facilitate interoperability among themselves.

Country CAGR (2025 to 2035)
European Union 7.5%

South Korea

South Korea’s advanced healthcare system and emphasis on AI-driven medical innovations is driving the OIS market. The emphasis on precision medicine alongside introduction of big data analytics into oncology services is raising demand for these systems.

Incorporating government policies supporting innovation in healthcare IT and cancer research are fuelling market expansion. Collaborations between major hospitals or research institutions and software companies are creating AI integrated oncology information systems to cater for personalized treatment.

Country CAGR (2025 to 2035)
South Korea 7.4%

Competition Outlook

The oncology information systems market is experiencing dynamic competition, fueled by innovation in AI-based decision support, cloud deployment, and modular system design. Vendors are prioritizing solutions that integrate seamlessly with EHRs and support real-time monitoring and personalized oncology care. Strategic collaborations with hospitals and research institutions are being used to boost adoption and global reach.

Emphasis on cybersecurity and data privacy compliance is also shaping vendor positioning. Additionally, market players are aggressively expanding into emerging economies, where digital health infrastructure is rapidly evolving. This shift is intensifying competition and driving product differentiation based on interoperability, regulatory alignment, and clinical efficiency.

Key Development
  • In 2024, Prognos Health launched Prognos Oncology, a real-world data platform providing unprecedented access to harmonized, multi-source oncology data. This platform aims to help pharmaceutical companies accelerate commercial launch planning and activation of life-saving cancer therapies by offering diverse genomics data, exclusive insights, and transparent data sources.
  • In 2024, GE HealthCare launched AI-enhanced oncology solutions at ESTRO 2024, including Revolution RT for better imaging accuracy, and an updated iRT platform integrating technologies like MIM Software. These innovations aim to streamline radiation therapy workflows for faster, more personalized cancer care.
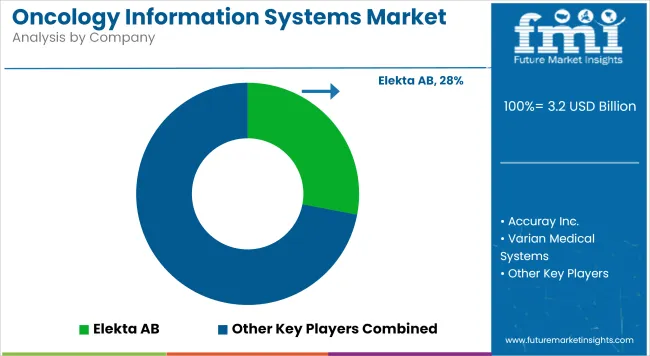
Oncology Information Systems Market Analysis By Company

Companies

  • Varian Medical Systems, Inc.
  • Elekta AB
  • RaySearch Laboratories
  • Cerner Corporation
  • Koninklijke Philips N.V
  • FLATIRON HEALTH
  • MCKESSON CORPORATION
  • Magentus
  • Ohum Healthcare Solutions
  • Cencora Corporation
  • Altai, Inc
  • Oncentric
  • BMSI Partners, Inc.

Key Segments

By Product:

  • Solutions
    • Patient Information Systems
    • Treatment Planning Systems
  • Professional Services

By Application:

  • Medical Oncology
  • Radiation Oncology
  • Surgical Oncology

By Region:

  • North America
  • Latin America
  • Western Europe
  • Eastern Europe
  • East Asia
  • South Asia Pacific
  • Middle East and Africa

Table of Content

  1. Executive Summary
  2. Industry Introduction, including Taxonomy and Market Definition
  3. Market Trends and Success Factors, including Macro-economic Factors, Market Dynamics, and Recent Industry Developments
  4. Global Market Demand Analysis 2020 to 2024 and Forecast 2025 to 2035, including Historical Analysis and Future Projections
  5. Pricing Analysis
  6. Global Market Analysis 2020 to 2024 and Forecast 2025 to 2035
    • Product
    • Application
  7. Global Market Analysis 2020 to 2024 and Forecast 2025 to 2035, By Product
    • Patient Information Systems
    • Professional Services
  8. Global Market Analysis 2020 to 2024 and Forecast 2025 to 2035, By Application
    • Medical Oncology
    • Radiation Oncology
    • Surgical Oncology
  9. Global Market Analysis 2020 to 2024 and Forecast 2025 to 2035, By Region
    • North America
    • Latin America
    • Western Europe
    • Eastern Europe
    • East Asia
    • South Asia Pacific
    • Middle East and Africa
  10. North America Sales Analysis 2020 to 2024 and Forecast 2025 to 2035, by Key Segments and Countries
  11. Latin America Sales Analysis 2020 to 2024 and Forecast 2025 to 2035, by Key Segments and Countries
  12. Western Europe Sales Analysis 2020 to 2024 and Forecast 2025 to 2035, by Key Segments and Countries
  13. Eastern Europe Sales Analysis 2020 to 2024 and Forecast 2025 to 2035, by Key Segments and Countries
  14. East Asia Sales Analysis 2020 to 2024 and Forecast 2025 to 2035, by Key Segments and Countries
  15. South Asia Pacific Sales Analysis 2020 to 2024 and Forecast 2025 to 2035, by Key Segments and Countries
  16. Middle East and Africa Sales Analysis 2020 to 2024 and Forecast 2025 to 2035, by Key Segments and Countries
  17. Sales Forecast 2025 to 2035 by Product and Application for 30 Countries
  18. Competition Outlook, including Market Structure Analysis, Company Share Analysis by Key Players, and Competition Dashboard
  19. Company Profile
    • Elekta AB
    • Accuray Inc.
    • Varian Medical Systems
    • RaySearch Laboratories
    • Cerner Corp.
    • BrainLab
    • Philips Healthcare
    • Prowess, Inc.
    • DOSIsoft S.A.
    • ViewRay Inc.

List of Tables

  • Table 1: Global Market Value (USD Million) Forecast by Region, 2020 to 2035
  • Table 2: Global Market Value (USD Million) Forecast by Product, 2020 to 2035
  • Table 3: Global Market Value (USD Million) Forecast by Application, 2020 to 2035
  • Table 4: North America Market Value (USD Million) Forecast by Country, 2020 to 2035
  • Table 5: North America Market Value (USD Million) Forecast by Product, 2020 to 2035
  • Table 6: North America Market Value (USD Million) Forecast by Application, 2020 to 2035
  • Table 7: Latin America Market Value (USD Million) Forecast by Country, 2020 to 2035
  • Table 8: Latin America Market Value (USD Million) Forecast by Product, 2020 to 2035
  • Table 9: Latin America Market Value (USD Million) Forecast by Application, 2020 to 2035
  • Table 10: Western Europe Market Value (USD Million) Forecast by Country, 2020 to 2035
  • Table 11: Western Europe Market Value (USD Million) Forecast by Product, 2020 to 2035
  • Table 12: Western Europe Market Value (USD Million) Forecast by Application, 2020 to 2035
  • Table 13: Eastern Europe Market Value (USD Million) Forecast by Country, 2020 to 2035
  • Table 14: Eastern Europe Market Value (USD Million) Forecast by Product, 2020 to 2035
  • Table 15: Eastern Europe Market Value (USD Million) Forecast by Application, 2020 to 2035
  • Table 16: South Asia and Pacific Market Value (USD Million) Forecast by Country, 2020 to 2035
  • Table 17: South Asia and Pacific Market Value (USD Million) Forecast by Product, 2020 to 2035
  • Table 18: South Asia and Pacific Market Value (USD Million) Forecast by Application, 2020 to 2035
  • Table 19: East Asia Market Value (USD Million) Forecast by Country, 2020 to 2035
  • Table 20: East Asia Market Value (USD Million) Forecast by Product, 2020 to 2035
  • Table 21: East Asia Market Value (USD Million) Forecast by Application, 2020 to 2035
  • Table 22: Middle East and Africa Market Value (USD Million) Forecast by Country, 2020 to 2035
  • Table 23: Middle East and Africa Market Value (USD Million) Forecast by Product, 2020 to 2035
  • Table 24: Middle East and Africa Market Value (USD Million) Forecast by Application, 2020 to 2035

List of Figures

  • Figure 1: Global Market Value (USD Million) by Product, 2025 to 2035
  • Figure 2: Global Market Value (USD Million) by Application, 2025 to 2035
  • Figure 3: Global Market Value (USD Million) by Region, 2025 to 2035
  • Figure 4: Global Market Value (USD Million) Analysis by Region, 2020 to 2035
  • Figure 5: Global Market Value Share (%) and BPS Analysis by Region, 2025 to 2035
  • Figure 6: Global Market Y-o-Y Growth (%) Projections by Region, 2025 to 2035
  • Figure 7: Global Market Value (USD Million) Analysis by Product, 2020 to 2035
  • Figure 8: Global Market Value Share (%) and BPS Analysis by Product, 2025 to 2035
  • Figure 9: Global Market Y-o-Y Growth (%) Projections by Product, 2025 to 2035
  • Figure 10: Global Market Value (USD Million) Analysis by Application, 2020 to 2035
  • Figure 11: Global Market Value Share (%) and BPS Analysis by Application, 2025 to 2035
  • Figure 12: Global Market Y-o-Y Growth (%) Projections by Application, 2025 to 2035
  • Figure 13: Global Market Attractiveness by Product, 2025 to 2035
  • Figure 14: Global Market Attractiveness by Application, 2025 to 2035
  • Figure 15: Global Market Attractiveness by Region, 2025 to 2035
  • Figure 16: North America Market Value (USD Million) by Product, 2025 to 2035
  • Figure 17: North America Market Value (USD Million) by Application, 2025 to 2035
  • Figure 18: North America Market Value (USD Million) by Country, 2025 to 2035
  • Figure 19: North America Market Value (USD Million) Analysis by Country, 2020 to 2035
  • Figure 20: North America Market Value Share (%) and BPS Analysis by Country, 2025 to 2035
  • Figure 21: North America Market Y-o-Y Growth (%) Projections by Country, 2025 to 2035
  • Figure 22: North America Market Value (USD Million) Analysis by Product, 2020 to 2035
  • Figure 23: North America Market Value Share (%) and BPS Analysis by Product, 2025 to 2035
  • Figure 24: North America Market Y-o-Y Growth (%) Projections by Product, 2025 to 2035
  • Figure 25: North America Market Value (USD Million) Analysis by Application, 2020 to 2035
  • Figure 26: North America Market Value Share (%) and BPS Analysis by Application, 2025 to 2035
  • Figure 27: North America Market Y-o-Y Growth (%) Projections by Application, 2025 to 2035
  • Figure 28: North America Market Attractiveness by Product, 2025 to 2035
  • Figure 29: North America Market Attractiveness by Application, 2025 to 2035
  • Figure 30: North America Market Attractiveness by Country, 2025 to 2035
  • Figure 31: Latin America Market Value (USD Million) by Product, 2025 to 2035
  • Figure 32: Latin America Market Value (USD Million) by Application, 2025 to 2035
  • Figure 33: Latin America Market Value (USD Million) by Country, 2025 to 2035
  • Figure 34: Latin America Market Value (USD Million) Analysis by Country, 2020 to 2035
  • Figure 35: Latin America Market Value Share (%) and BPS Analysis by Country, 2025 to 2035
  • Figure 36: Latin America Market Y-o-Y Growth (%) Projections by Country, 2025 to 2035
  • Figure 37: Latin America Market Value (USD Million) Analysis by Product, 2020 to 2035
  • Figure 38: Latin America Market Value Share (%) and BPS Analysis by Product, 2025 to 2035
  • Figure 39: Latin America Market Y-o-Y Growth (%) Projections by Product, 2025 to 2035
  • Figure 40: Latin America Market Value (USD Million) Analysis by Application, 2020 to 2035
  • Figure 41: Latin America Market Value Share (%) and BPS Analysis by Application, 2025 to 2035
  • Figure 42: Latin America Market Y-o-Y Growth (%) Projections by Application, 2025 to 2035
  • Figure 43: Latin America Market Attractiveness by Product, 2025 to 2035
  • Figure 44: Latin America Market Attractiveness by Application, 2025 to 2035
  • Figure 45: Latin America Market Attractiveness by Country, 2025 to 2035
  • Figure 46: Western Europe Market Value (USD Million) by Product, 2025 to 2035
  • Figure 47: Western Europe Market Value (USD Million) by Application, 2025 to 2035
  • Figure 48: Western Europe Market Value (USD Million) by Country, 2025 to 2035
  • Figure 49: Western Europe Market Value (USD Million) Analysis by Country, 2020 to 2035
  • Figure 50: Western Europe Market Value Share (%) and BPS Analysis by Country, 2025 to 2035
  • Figure 51: Western Europe Market Y-o-Y Growth (%) Projections by Country, 2025 to 2035
  • Figure 52: Western Europe Market Value (USD Million) Analysis by Product, 2020 to 2035
  • Figure 53: Western Europe Market Value Share (%) and BPS Analysis by Product, 2025 to 2035
  • Figure 54: Western Europe Market Y-o-Y Growth (%) Projections by Product, 2025 to 2035
  • Figure 55: Western Europe Market Value (USD Million) Analysis by Application, 2020 to 2035
  • Figure 56: Western Europe Market Value Share (%) and BPS Analysis by Application, 2025 to 2035
  • Figure 57: Western Europe Market Y-o-Y Growth (%) Projections by Application, 2025 to 2035
  • Figure 58: Western Europe Market Attractiveness by Product, 2025 to 2035
  • Figure 59: Western Europe Market Attractiveness by Application, 2025 to 2035
  • Figure 60: Western Europe Market Attractiveness by Country, 2025 to 2035
  • Figure 61: Eastern Europe Market Value (USD Million) by Product, 2025 to 2035
  • Figure 62: Eastern Europe Market Value (USD Million) by Application, 2025 to 2035
  • Figure 63: Eastern Europe Market Value (USD Million) by Country, 2025 to 2035
  • Figure 64: Eastern Europe Market Value (USD Million) Analysis by Country, 2020 to 2035
  • Figure 65: Eastern Europe Market Value Share (%) and BPS Analysis by Country, 2025 to 2035
  • Figure 66: Eastern Europe Market Y-o-Y Growth (%) Projections by Country, 2025 to 2035
  • Figure 67: Eastern Europe Market Value (USD Million) Analysis by Product, 2020 to 2035
  • Figure 68: Eastern Europe Market Value Share (%) and BPS Analysis by Product, 2025 to 2035
  • Figure 69: Eastern Europe Market Y-o-Y Growth (%) Projections by Product, 2025 to 2035
  • Figure 70: Eastern Europe Market Value (USD Million) Analysis by Application, 2020 to 2035
  • Figure 71: Eastern Europe Market Value Share (%) and BPS Analysis by Application, 2025 to 2035
  • Figure 72: Eastern Europe Market Y-o-Y Growth (%) Projections by Application, 2025 to 2035
  • Figure 73: Eastern Europe Market Attractiveness by Product, 2025 to 2035
  • Figure 74: Eastern Europe Market Attractiveness by Application, 2025 to 2035
  • Figure 75: Eastern Europe Market Attractiveness by Country, 2025 to 2035
  • Figure 76: South Asia and Pacific Market Value (USD Million) by Product, 2025 to 2035
  • Figure 77: South Asia and Pacific Market Value (USD Million) by Application, 2025 to 2035
  • Figure 78: South Asia and Pacific Market Value (USD Million) by Country, 2025 to 2035
  • Figure 79: South Asia and Pacific Market Value (USD Million) Analysis by Country, 2020 to 2035
  • Figure 80: South Asia and Pacific Market Value Share (%) and BPS Analysis by Country, 2025 to 2035
  • Figure 81: South Asia and Pacific Market Y-o-Y Growth (%) Projections by Country, 2025 to 2035
  • Figure 82: South Asia and Pacific Market Value (USD Million) Analysis by Product, 2020 to 2035
  • Figure 83: South Asia and Pacific Market Value Share (%) and BPS Analysis by Product, 2025 to 2035
  • Figure 84: South Asia and Pacific Market Y-o-Y Growth (%) Projections by Product, 2025 to 2035
  • Figure 85: South Asia and Pacific Market Value (USD Million) Analysis by Application, 2020 to 2035
  • Figure 86: South Asia and Pacific Market Value Share (%) and BPS Analysis by Application, 2025 to 2035
  • Figure 87: South Asia and Pacific Market Y-o-Y Growth (%) Projections by Application, 2025 to 2035
  • Figure 88: South Asia and Pacific Market Attractiveness by Product, 2025 to 2035
  • Figure 89: South Asia and Pacific Market Attractiveness by Application, 2025 to 2035
  • Figure 90: South Asia and Pacific Market Attractiveness by Country, 2025 to 2035
  • Figure 91: East Asia Market Value (USD Million) by Product, 2025 to 2035
  • Figure 92: East Asia Market Value (USD Million) by Application, 2025 to 2035
  • Figure 93: East Asia Market Value (USD Million) by Country, 2025 to 2035
  • Figure 94: East Asia Market Value (USD Million) Analysis by Country, 2020 to 2035
  • Figure 95: East Asia Market Value Share (%) and BPS Analysis by Country, 2025 to 2035
  • Figure 96: East Asia Market Y-o-Y Growth (%) Projections by Country, 2025 to 2035
  • Figure 97: East Asia Market Value (USD Million) Analysis by Product, 2020 to 2035
  • Figure 98: East Asia Market Value Share (%) and BPS Analysis by Product, 2025 to 2035
  • Figure 99: East Asia Market Y-o-Y Growth (%) Projections by Product, 2025 to 2035
  • Figure 100: East Asia Market Value (USD Million) Analysis by Application, 2020 to 2035
  • Figure 101: East Asia Market Value Share (%) and BPS Analysis by Application, 2025 to 2035
  • Figure 102: East Asia Market Y-o-Y Growth (%) Projections by Application, 2025 to 2035
  • Figure 103: East Asia Market Attractiveness by Product, 2025 to 2035
  • Figure 104: East Asia Market Attractiveness by Application, 2025 to 2035
  • Figure 105: East Asia Market Attractiveness by Country, 2025 to 2035
  • Figure 106: Middle East and Africa Market Value (USD Million) by Product, 2025 to 2035
  • Figure 107: Middle East and Africa Market Value (USD Million) by Application, 2025 to 2035
  • Figure 108: Middle East and Africa Market Value (USD Million) by Country, 2025 to 2035
  • Figure 109: Middle East and Africa Market Value (USD Million) Analysis by Country, 2020 to 2035
  • Figure 110: Middle East and Africa Market Value Share (%) and BPS Analysis by Country, 2025 to 2035
  • Figure 111: Middle East and Africa Market Y-o-Y Growth (%) Projections by Country, 2025 to 2035
  • Figure 112: Middle East and Africa Market Value (USD Million) Analysis by Product, 2020 to 2035
  • Figure 113: Middle East and Africa Market Value Share (%) and BPS Analysis by Product, 2025 to 2035
  • Figure 114: Middle East and Africa Market Y-o-Y Growth (%) Projections by Product, 2025 to 2035
  • Figure 115: Middle East and Africa Market Value (USD Million) Analysis by Application, 2020 to 2035
  • Figure 116: Middle East and Africa Market Value Share (%) and BPS Analysis by Application, 2025 to 2035
  • Figure 117: Middle East and Africa Market Y-o-Y Growth (%) Projections by Application, 2025 to 2035
  • Figure 118: Middle East and Africa Market Attractiveness by Product, 2025 to 2035
  • Figure 119: Middle East and Africa Market Attractiveness by Application, 2025 to 2035
  • Figure 120: Middle East and Africa Market Attractiveness by Country, 2025 to 2035

Frequently Asked Questions

What was the overall size of the oncology information systems market in 2025?

The overall market size for oncology information systems market was USD 3.2 billion in 2025.

How big the bio is based oncology information systems market expected in 2035?

The oncology information systems market is expected to reach USD 6.4 billion in 2035.

What will drive the demand for oncology information systems market during the forecast period?

The demand for oncology information systems will be driven by rising cancer cases, advancements in treatment planning, increasing adoption of digital healthcare solutions, and growing demand for integrated patient management and professional services.

List the top 5 countries contributing in oncology information systems market?

The top 5 countries which drives the development of oncology information systems market are USA, European Union, Japan, South Korea and UK.

Which segment in type is expected to lead oncology information systems market?

Solutions Segment demand supplier to command significant share over the assessment period.

Explore Similar Insights

Future Market Insights

Oncology Information Systems Market