Oil and Gas Hose Assemblies Market Size and Share Forecast Outlook 2025 to 2035

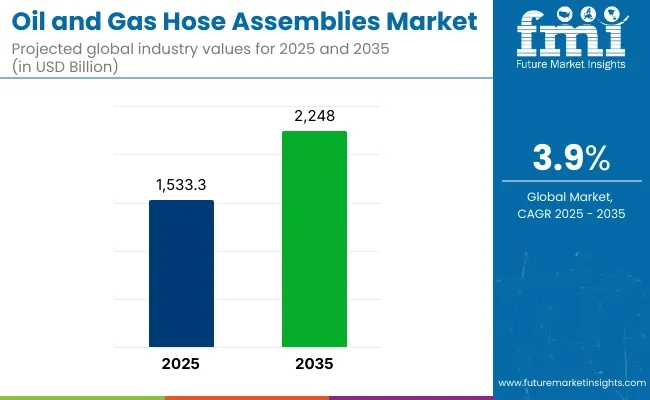
The oil and gas hose assemblies market is estimated to generate a market size of USD 1.53 billion in 2025 and is expected to reach USD 2.25 billion by 2035, reflecting a compound annual growth rate (CAGR) of 3.9% during the forecast period.

Hose assemblies are essential in the oil and gas industry for the transportation of oil, gas, and other fluids under high-pressure conditions. These assemblies ensure the safe and efficient transfer of materials between drilling rigs, pipelines, and storage tanks, making them a crucial component of the oil and gas infrastructure.

A primary driver of the market’s growth is the increasing global demand for energy, particularly from emerging economies that are expanding their industrial and transportation sectors. As exploration and production activities increase, the need for reliable and durable hose assemblies to handle the transportation of oil, gas, and chemicals is also rising.

The growing focus on offshore drilling and exploration, particularly in deep-water and ultra-deep-water fields, is further driving the need for advanced hose assembly solutions capable of withstanding harsh marine environments and extreme pressures.

Recent developments in the oil and gas hose assemblies market include advancements in materials and technologies used to enhance hose durability and performance. Manufacturers are investing in high-quality materials, such as thermoplastic elastomers and stainless steel, to improve resistance to abrasion, corrosion, and extreme temperatures.

These innovations are making hose assemblies more reliable and long-lasting, which is crucial in ensuring safety and efficiency during oil and gas operations. Additionally, the integration of smart technologies into hose assemblies, such as sensors that monitor pressure and temperature in real-time, is adding an extra layer of performance and safety.
Oil And Gas Hose Assemblies Market

Attribute Value
Market Size in 2025 USD 1.53 billion
Market Size in 2035 USD 2.25 billion
CAGR (2025 to 2035) 3.9%

On June 25, 2024, ERIKS North America announced the completion of a £35,000 upgrade to its Hose Technology Center in Northampton. The enhancement increases pallet storage capacity by 40%, boosts technical capabilities, and improves safety performance, positioning the center to better meet growing customer demand and support the oil and gas industry. This was officially announced in the company's press release.

As the oil and gas industry continues to expand, particularly in offshore and deep-water exploration, the oil and gas hose assemblies market is expected to experience continued growth. Ongoing advancements in material science and the adoption of smart technologies will further enhance the market’s potential, driving long-term demand for reliable hose assembly solutions.

Analyzing Oil and Gas Hose Assemblies Market by Top Investment Segments

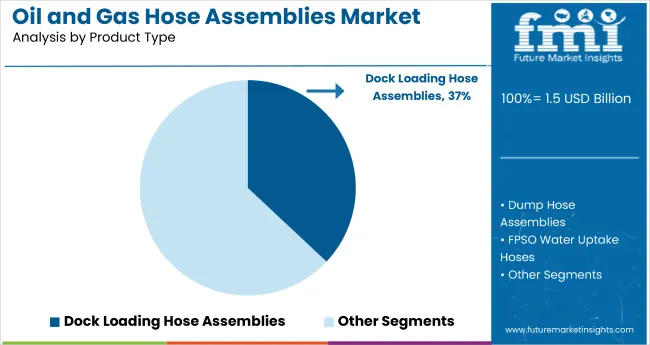
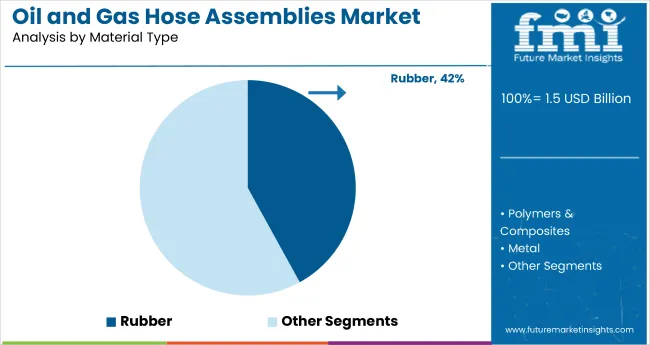
The global oil and gas hose assemblies market is projected to grow steadily from 2025 to 2035. In 2025, dock loading assemblies are expected to capture 37.0% of the product type segment, while rubber is projected to hold 42.0% of the material type segment. Key players include Trelleborg, ContiTech, and Parker Hannifin.
Dock Loading Assemblies Gain Demand with Rising Marine Transfers

The dock loading assemblies segment is projected to account for 37.0% of the product type market share in 2025. These assemblies are essential for transferring petroleum and chemical products between marine vessels and onshore storage during import and export operations. As global maritime trade in crude oil and LNG expands, the need for reliable, durable, and high-flow capacity hose systems at ports is surging.

Manufacturers such as Trelleborg and Dunlop Oil & Marine are offering advanced dock loading solutions designed to handle aggressive media under fluctuating pressure and temperature conditions. Innovations include reinforced hoses with improved chemical resistance, anti-static liners, and integrated safety systems to prevent spills or blowouts.

With increasing investments in terminal infrastructure across regions like the Middle East and Southeast Asia, dock loading assemblies are also seeing adoption in multiproduct loading scenarios. As international safety norms evolve and marine logistics scale up, dock loading assemblies are expected to remain integral to secure and efficient oil and gas transfer operations.
Rubber Segment Strengthens as Flexible and Resilient Material Choice

The rubber segment is expected to capture 42.0% of the material type segment market share in 2025. Rubber remains a preferred material for oil and gas hose assemblies due to its superior flexibility, abrasion resistance, and adaptability across a wide range of operating environments. Its resilience under high-pressure and high-temperature conditions makes it ideal for both upstream and downstream applications.

Parker Hannifin and ContiTech are leading the development of rubber hose assemblies using synthetic compounds like nitrile and EPDM to enhance resistance to oils, chemicals, and environmental wear. These materials are especially valuable in dynamic offshore environments, where hoses must endure constant flexing and exposure to saltwater, UV radiation, and hydrocarbons.

Additionally, the increasing use of floating production systems and subsea installations is driving demand for rubber-based hose systems with reinforced layers and improved fatigue performance. As energy projects shift toward more complex and remote environments, the rubber segment is expected to see ongoing innovation and high market relevance in the years ahead.

Challenges and Opportunities

Challenges

High Operational Costs and Stringent Safety Regulations

One big problem in the oil and gas hose assemblies market t is the high price of strong, high-pressure hoses. This is extra tough for sea and deep-water uses. Strict safety and green rules, which must meet standards like API, ISO, and DNV-GL, make it hard for makers too.

Hoses need to be looked at, fixed, and swapped often to stop leaks and blasts. This adds more trouble for oil and gas firms.

Opportunities

Smart Hose Technology, LNG Expansion, and Hydrogen-Ready Hose Assemblies

Even with problems, the oil and gas hose assemblies market demonstrates significant potential for expansion. Smart hose tech, which has real-time checks, leak finders, and IoT-run tracking, is making things safer and better.

The rise of LNG transport and fueling systems, which need top-quality cold hoses for liquid natural gas moving, is bringing new market chances. Plus, more use of hydrogen-friendly hoses, backing the worldwide move to cleaner power, should help market growth.

New light, strong hoses for offshore use that last longer and need less care, is also set to speed up market growth.
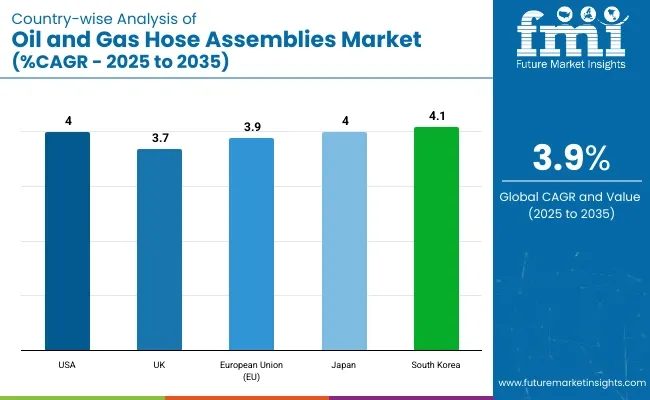
Country-wise Insights

United States

The oil and gas hose assemblies market in the USA is growing well. More offshore searching, bigger spending on shale gas, and high need for tough hoses are pushing this growth. The EPA and API set rules for safety, emissions, and materials.

New LNG setups, more use of bendable hoses for offshore jobs, and more smart systems to check hoses are boosting the market. Also, new light and strong hoses for deep waters are changing the market.

Country CAGR (2025 to 2035)
USA 4.0%

United Kingdom

The oil and gas hose assemblies market is growing in the UK. Big investments in North Sea oil and gas push this growth. There is more focus on cutting emissions and strict safety rules for offshore work. The HSE and the OGA handle hose safety and environmental rules.

The rise of top hydraulic hose assemblies helps growth. There’s a need for light and bendy hoses for FPSO uses. Fireproof and static-free hoses are also on the rise. New AI tech helps maintain hoses and shapes industry trends too.

Country CAGR (2025 to 2035)
UK 3.7%

European Union

The European market for oil and gas hose assemblies is growing steadily. It grows because of strict EU green rules, more use of LNG as a bridge fuel, and new money being put into refinery updates. Groups like ECHA and EMSA make sure hoses are safe and the right kind for offshore use.

Germany, France, and Italy are big on using cold hoses for LNG moves. They spend more on tough hoses needed for refining and green hydrogen tasks, which need special hoses. Also, looking into hoses that can be recycled or are bio-based helps lower the environmental impact and supports market growth.

Region CAGR (2025 to 2035)
European Union (EU) 3.9%

Country Wise Analysis Of Oil And Gas Hose Assemblies Market

Japan

The market for oil and gas hose assemblies in Japan is growing. Higher need for LNG brings growth. Investments in hydrogen fuel are also rising. Strong government backing for clean energy moves is key. The Japanese Ministry of Economy, Trade, and Industry and Japan Oil, Gas and Metals National Corporation set hose rules for energy uses.

Japanese companies are putting money into new types of flexible hoses for very cold uses. They are also creating hoses that resist rust for sea platforms. High-quality hoses for moving hydrogen and ammonia fuels are on the rise too. New hose designs that fight wear and can handle ground shake are changing trends.

Country CAGR (2025 to 2035)
Japan 4.0%

South Korea

In South Korea, oil and gas hose assemblies market is seeing steady growth. This growth comes from LNG infrastructure, use of high-pressure hoses in ships and offshore projects, and more money in digital tools to watch hose performance. The Ministry of Trade, Industry, and Energy (MOTIE), along with the Korea Gas Safety Corporation (KGS), directs safety rules for these hose assemblies.

Deep-sea drilling hoses and the demand for flexible, lightweight LNG transfer hoses are also driving the market. Projects in renewable energy are requiring new hose solutions too. Plus, money is going into smart hose tech with real-time wear checks for better upkeep.

Country CAGR (2025 to 2035)
South Korea 4.1%

Competitive Outlook

The Market for oil and gas hose assemblies is growing. This rise comes from the need for tough, high-pressure hoses in upstream, midstream, and downstream work. Growth is due to more oil and gas searches, strict safety rules, and better hose materials and tech.

Firms aim for top-notch, rust-proof, heat-resistant hoses to boost safety, work quality, and life in tough spots. The market has top hose makers, oil field tool sellers, and fluid transfer tech teams. Each group helps with new ideas in flexible hoses, cold transfer hoses, and hydraulic hose systems.
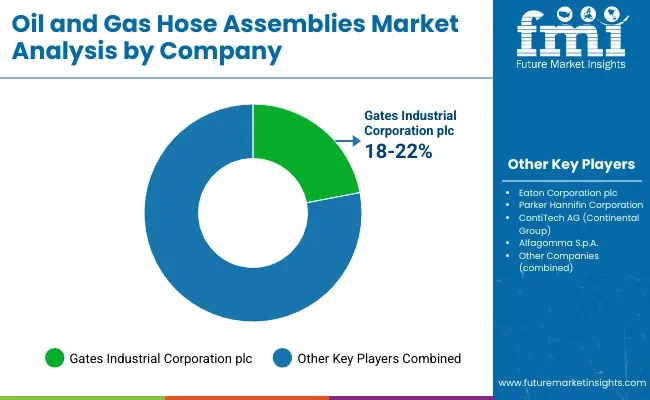
Oil And Gas Hose Assemblies Market By Company

Other Key Players

Several hose manufacturers, oilfield service providers, and industrial fluid transfer specialists contribute to advancements in hose reinforcement, flexibility, and safety compliance. These include:

  • Trelleborg AB - Specializes in marine and floating oil transfer hose systems
  • Gutteling BV - Develops cryogenic and LNG hose assemblies for specialized applications
  • Kuriyama of America, Inc. - Focuses on chemical-resistant and high-pressure oil and gas hoses
  • Dunlop Hiflex (Bridgestone Corporation) - Provides customized offshore drilling and hydraulic hose solutions
  • Manuli Hydraulics - Manufactures high-pressure and thermoplastic hose assemblies for extreme oilfield environments

Report Scope Table - Oil and Gas Hose Assemblies Market

Report Attributes Details
Current Total Market Size (2025) USD 1.53 billion
Projected Market Size (2035) USD 2.25 billion
CAGR (2025 to 2035) 3.9%
Base Year for Estimation 2024
Historical Period 2020 to 2024
Projections Period 2025 to 2035
Quantitative Units USD billion for dollar sales
Product Types Analyzed (Segment 1) Dock Loading Hose Assemblies, Dump Hose Assemblies, FPSO Water Uptake Hoses, Jumper Hose Assemblies, Bunkering Hose Assemblies, Drilling Mud Hose Assemblies, Frac Hose Assemblies, Other Custom Hose Assemblies
Material Types Analyzed (Segment 2) Rubber, Polymers & Composites, Metal
Application Types Analyzed (Segment 3) Downstream, Midstream, Upstream
Pressure Intake Types Analyzed (Segment 4) Low Pressure, Medium Pressure, High Pressure
Regions Covered North America, Latin America, Western Europe, Eastern Europe, East Asia, South Asia Pacific, Middle East and Africa
Countries Covered United States, Canada, Mexico, Brazil, Argentina, Germany, France, United Kingdom, Italy, Spain, Netherlands, China, India, Japan, South Korea, ANZ, GCC Countries, South Africa
Key Players influencing the Oil and Gas Hose Assemblies Market Gates Corporation, Eaton Corporation Plc, Continental AG, Trelleborg AB, ERIKS, Parker Hannifin, Manuli Hydraulics, ALFA GOMMA, Kuriyama Holdings Corporation, Powertrack International LLC
Additional Attributes dollar sales, CAGR trends, product type segmentation, material type distribution, application-based demand, pressure intake categories, competitor dollar sales & market share, regional trends

Oil and Gas Hose Assemblies Industry Analysis by Top Investment Segments

By Product Type:

  • Dock Loading Hose Assemblies
  • Dump Hose Assemblies
  • FPSO Water Uptake Hoses
  • Jumper Hose Assemblies
  • Bunkering Hose Assemblies
  • Drilling Mud Hose Assemblies
  • Frac Hose Assemblies
  • Other Custom Hose Assemblies

By Material Type:

  • Rubber
  • Polymers & Composites
  • Metal

By Application Type:

  • Downstream
  • Midstream
  • Upstream

By Pressure Intake:

  • Low Pressure
  • Medium Pressure
  • High Pressure

By Region:

  • North America
  • Latin America
  • Western Europe
  • Eastern Europe
  • East Asia
  • South Asia Pacific
  • Middle East and Africa

Table of Content

  1. Executive Summary
  2. Industry Introduction, including Taxonomy and Market Definition
  3. Market Trends and Success Factors, including Macro-economic Factors, Market Dynamics, and Recent Industry Developments
  4. Global Market Demand Analysis 2020 to 2024 and Forecast 2025 to 2035, including Historical Analysis and Future Projections
  5. Pricing Analysis
  6. Global Market Analysis 2020 to 2024 and Forecast 2025 to 2035
    • By Product Type
    • By Material Type
    • By Application Type
    • By Pressure Intake
    • By Region
  7. Global Market Analysis 2020 to 2024 and Forecast 2025 to 2035, By Product Type
    • Dock Loading Hose Assemblies
    • Dump Hose Assemblies
    • FPSO Water Uptake Hoses
    • Jumper Hose Assemblies
    • Bunkering Hose Assemblies
    • Drilling Mud Hose Assemblies
    • Frac Hose Assemblies
    • Other Custom Hose Assemblies
  8. Global Market Analysis 2020 to 2024 and Forecast 2025 to 2035, By Material Type
    • Rubber
    • Polymers & Composites
    • Metal
  9. Global Market Analysis 2020 to 2024 and Forecast 2025 to 2035, By Application Type
    • Downstream
    • Midstream
    • Upstream
  10. Global Market Analysis 2020 to 2024 and Forecast 2025 to 2035, By Pressure Intake
    • Low Pressure
    • Medium Pressure
    • High Pressure
  11. Global Market Analysis 2020 to 2024 and Forecast 2025 to 2035, By Region
    • North America
    • Latin America
    • Western Europe
    • Eastern Europe
    • East Asia
    • South Asia Pacific
    • Middle East and Africa
  12. North America Sales Analysis 2020 to 2024 and Forecast 2025 to 2035, by Key Segments and Countries
  13. Latin America Sales Analysis 2020 to 2024 and Forecast 2025 to 2035, by Key Segments and Countries
  14. Western Europe Sales Analysis 2020 to 2024 and Forecast 2025 to 2035, by Key Segments and Countries
  15. Eastern Europe Sales Analysis 2020 to 2024 and Forecast 2025 to 2035, by Key Segments and Countries
  16. East Asia Sales Analysis 2020 to 2024 and Forecast 2025 to 2035, by Key Segments and Countries
  17. South Asia Pacific Sales Analysis 2020 to 2024 and Forecast 2025 to 2035, by Key Segments and Countries
  18. Middle East and Africa Sales Analysis 2020 to 2024 and Forecast 2025 to 2035, by Key Segments and Countries
  19. Sales Forecast 2025 to 2035 by Product Type, Material Type, Application Type, and Pressure Intake for 30 Countries
  20. Competition Outlook, including Market Structure Analysis, Company Share Analysis by Key Players, and Competition Dashboard
  21. Company Profile
    • Gates Corporation
    • Eaton Corporation Plc
    • Continental AG
    • Trelleborg AB
    • ERIKS
    • Parker Hannifin
    • Manuli Hydraulics
    • ALFA GOMMA
    • Kuriyama Holdings Corporation
    • Powertrack International LLC

List of Tables

  • Table 1: Global Market Value (USD Million) Forecast by Region, 2020 to 2035
  • Table 2: Global Market Volume (Feet) Forecast by Region, 2020 to 2035
  • Table 3: Global Market Value (USD Million) Forecast by Product Type, 2020 to 2035
  • Table 4: Global Market Volume (Feet) Forecast by Product Type, 2020 to 2035
  • Table 5: Global Market Value (USD Million) Forecast by Material Type, 2020 to 2035
  • Table 6: Global Market Volume (Feet) Forecast by Material Type, 2020 to 2035
  • Table 7: Global Market Value (USD Million) Forecast by Application Type, 2020 to 2035
  • Table 8: Global Market Volume (Feet) Forecast by Application Type, 2020 to 2035
  • Table 9: Global Market Value (USD Million) Forecast by Pressure Intake, 2020 to 2035
  • Table 10: Global Market Volume (Feet) Forecast by Pressure Intake, 2020 to 2035
  • Table 11: North America Market Value (USD Million) Forecast by Country, 2020 to 2035
  • Table 12: North America Market Volume (Feet) Forecast by Country, 2020 to 2035
  • Table 13: North America Market Value (USD Million) Forecast by Product Type, 2020 to 2035
  • Table 14: North America Market Volume (Feet) Forecast by Product Type, 2020 to 2035
  • Table 15: North America Market Value (USD Million) Forecast by Material Type, 2020 to 2035
  • Table 16: North America Market Volume (Feet) Forecast by Material Type, 2020 to 2035
  • Table 17: North America Market Value (USD Million) Forecast by Application Type, 2020 to 2035
  • Table 18: North America Market Volume (Feet) Forecast by Application Type, 2020 to 2035
  • Table 19: North America Market Value (USD Million) Forecast by Pressure Intake, 2020 to 2035
  • Table 20: North America Market Volume (Feet) Forecast by Pressure Intake, 2020 to 2035
  • Table 21: Latin America Market Value (USD Million) Forecast by Country, 2020 to 2035
  • Table 22: Latin America Market Volume (Feet) Forecast by Country, 2020 to 2035
  • Table 23: Latin America Market Value (USD Million) Forecast by Product Type, 2020 to 2035
  • Table 24: Latin America Market Volume (Feet) Forecast by Product Type, 2020 to 2035
  • Table 25: Latin America Market Value (USD Million) Forecast by Material Type, 2020 to 2035
  • Table 26: Latin America Market Volume (Feet) Forecast by Material Type, 2020 to 2035
  • Table 27: Latin America Market Value (USD Million) Forecast by Application Type, 2020 to 2035
  • Table 28: Latin America Market Volume (Feet) Forecast by Application Type, 2020 to 2035
  • Table 29: Latin America Market Value (USD Million) Forecast by Pressure Intake, 2020 to 2035
  • Table 30: Latin America Market Volume (Feet) Forecast by Pressure Intake, 2020 to 2035
  • Table 31: Europe Market Value (USD Million) Forecast by Country, 2020 to 2035
  • Table 32: Europe Market Volume (Feet) Forecast by Country, 2020 to 2035
  • Table 33: Europe Market Value (USD Million) Forecast by Product Type, 2020 to 2035
  • Table 34: Europe Market Volume (Feet) Forecast by Product Type, 2020 to 2035
  • Table 35: Europe Market Value (USD Million) Forecast by Material Type, 2020 to 2035
  • Table 36: Europe Market Volume (Feet) Forecast by Material Type, 2020 to 2035
  • Table 37: Europe Market Value (USD Million) Forecast by Application Type, 2020 to 2035
  • Table 38: Europe Market Volume (Feet) Forecast by Application Type, 2020 to 2035
  • Table 39: Europe Market Value (USD Million) Forecast by Pressure Intake, 2020 to 2035
  • Table 40: Europe Market Volume (Feet) Forecast by Pressure Intake, 2020 to 2035
  • Table 41: Asia Pacific Market Value (USD Million) Forecast by Country, 2020 to 2035
  • Table 42: Asia Pacific Market Volume (Feet) Forecast by Country, 2020 to 2035
  • Table 43: Asia Pacific Market Value (USD Million) Forecast by Product Type, 2020 to 2035
  • Table 44: Asia Pacific Market Volume (Feet) Forecast by Product Type, 2020 to 2035
  • Table 45: Asia Pacific Market Value (USD Million) Forecast by Material Type, 2020 to 2035
  • Table 46: Asia Pacific Market Volume (Feet) Forecast by Material Type, 2020 to 2035
  • Table 47: Asia Pacific Market Value (USD Million) Forecast by Application Type, 2020 to 2035
  • Table 48: Asia Pacific Market Volume (Feet) Forecast by Application Type, 2020 to 2035
  • Table 49: Asia Pacific Market Value (USD Million) Forecast by Pressure Intake, 2020 to 2035
  • Table 50: Asia Pacific Market Volume (Feet) Forecast by Pressure Intake, 2020 to 2035
  • Table 51: MEA Market Value (USD Million) Forecast by Country, 2020 to 2035
  • Table 52: MEA Market Volume (Feet) Forecast by Country, 2020 to 2035
  • Table 53: MEA Market Value (USD Million) Forecast by Product Type, 2020 to 2035
  • Table 54: MEA Market Volume (Feet) Forecast by Product Type, 2020 to 2035
  • Table 55: MEA Market Value (USD Million) Forecast by Material Type, 2020 to 2035
  • Table 56: MEA Market Volume (Feet) Forecast by Material Type, 2020 to 2035
  • Table 57: MEA Market Value (USD Million) Forecast by Application Type, 2020 to 2035
  • Table 58: MEA Market Volume (Feet) Forecast by Application Type, 2020 to 2035
  • Table 59: MEA Market Value (USD Million) Forecast by Pressure Intake, 2020 to 2035
  • Table 60: MEA Market Volume (Feet) Forecast by Pressure Intake, 2020 to 2035

List of Figures

  • Figure 1: Global Market Value (USD Million) by Product Type, 2025 to 2035
  • Figure 2: Global Market Value (USD Million) by Material Type, 2025 to 2035
  • Figure 3: Global Market Value (USD Million) by Application Type, 2025 to 2035
  • Figure 4: Global Market Value (USD Million) by Pressure Intake, 2025 to 2035
  • Figure 5: Global Market Value (USD Million) by Region, 2025 to 2035
  • Figure 6: Global Market Value (USD Million) Analysis by Region, 2020 to 2035
  • Figure 7: Global Market Volume (Feet) Analysis by Region, 2020 to 2035
  • Figure 8: Global Market Value Share (%) and BPS Analysis by Region, 2025 to 2035
  • Figure 9: Global Market Y-o-Y Growth (%) Projections by Region, 2025 to 2035
  • Figure 10: Global Market Value (USD Million) Analysis by Product Type, 2020 to 2035
  • Figure 11: Global Market Volume (Feet) Analysis by Product Type, 2020 to 2035
  • Figure 12: Global Market Value Share (%) and BPS Analysis by Product Type, 2025 to 2035
  • Figure 13: Global Market Y-o-Y Growth (%) Projections by Product Type, 2025 to 2035
  • Figure 14: Global Market Value (USD Million) Analysis by Material Type, 2020 to 2035
  • Figure 15: Global Market Volume (Feet) Analysis by Material Type, 2020 to 2035
  • Figure 16: Global Market Value Share (%) and BPS Analysis by Material Type, 2025 to 2035
  • Figure 17: Global Market Y-o-Y Growth (%) Projections by Material Type, 2025 to 2035
  • Figure 18: Global Market Value (USD Million) Analysis by Application Type, 2020 to 2035
  • Figure 19: Global Market Volume (Feet) Analysis by Application Type, 2020 to 2035
  • Figure 20: Global Market Value Share (%) and BPS Analysis by Application Type, 2025 to 2035
  • Figure 21: Global Market Y-o-Y Growth (%) Projections by Application Type, 2025 to 2035
  • Figure 22: Global Market Value (USD Million) Analysis by Pressure Intake, 2020 to 2035
  • Figure 23: Global Market Volume (Feet) Analysis by Pressure Intake, 2020 to 2035
  • Figure 24: Global Market Value Share (%) and BPS Analysis by Pressure Intake, 2025 to 2035
  • Figure 25: Global Market Y-o-Y Growth (%) Projections by Pressure Intake, 2025 to 2035
  • Figure 26: Global Market Attractiveness by Product Type, 2025 to 2035
  • Figure 27: Global Market Attractiveness by Material Type, 2025 to 2035
  • Figure 28: Global Market Attractiveness by Application Type, 2025 to 2035
  • Figure 29: Global Market Attractiveness by Pressure Intake, 2025 to 2035
  • Figure 30: Global Market Attractiveness by Region, 2025 to 2035
  • Figure 31: North America Market Value (USD Million) by Product Type, 2025 to 2035
  • Figure 32: North America Market Value (USD Million) by Material Type, 2025 to 2035
  • Figure 33: North America Market Value (USD Million) by Application Type, 2025 to 2035
  • Figure 34: North America Market Value (USD Million) by Pressure Intake, 2025 to 2035
  • Figure 35: North America Market Value (USD Million) by Country, 2025 to 2035
  • Figure 36: North America Market Value (USD Million) Analysis by Country, 2020 to 2035
  • Figure 37: North America Market Volume (Feet) Analysis by Country, 2020 to 2035
  • Figure 38: North America Market Value Share (%) and BPS Analysis by Country, 2025 to 2035
  • Figure 39: North America Market Y-o-Y Growth (%) Projections by Country, 2025 to 2035
  • Figure 40: North America Market Value (USD Million) Analysis by Product Type, 2020 to 2035
  • Figure 41: North America Market Volume (Feet) Analysis by Product Type, 2020 to 2035
  • Figure 42: North America Market Value Share (%) and BPS Analysis by Product Type, 2025 to 2035
  • Figure 43: North America Market Y-o-Y Growth (%) Projections by Product Type, 2025 to 2035
  • Figure 44: North America Market Value (USD Million) Analysis by Material Type, 2020 to 2035
  • Figure 45: North America Market Volume (Feet) Analysis by Material Type, 2020 to 2035
  • Figure 46: North America Market Value Share (%) and BPS Analysis by Material Type, 2025 to 2035
  • Figure 47: North America Market Y-o-Y Growth (%) Projections by Material Type, 2025 to 2035
  • Figure 48: North America Market Value (USD Million) Analysis by Application Type, 2020 to 2035
  • Figure 49: North America Market Volume (Feet) Analysis by Application Type, 2020 to 2035
  • Figure 50: North America Market Value Share (%) and BPS Analysis by Application Type, 2025 to 2035
  • Figure 51: North America Market Y-o-Y Growth (%) Projections by Application Type, 2025 to 2035
  • Figure 52: North America Market Value (USD Million) Analysis by Pressure Intake, 2020 to 2035
  • Figure 53: North America Market Volume (Feet) Analysis by Pressure Intake, 2020 to 2035
  • Figure 54: North America Market Value Share (%) and BPS Analysis by Pressure Intake, 2025 to 2035
  • Figure 55: North America Market Y-o-Y Growth (%) Projections by Pressure Intake, 2025 to 2035
  • Figure 56: North America Market Attractiveness by Product Type, 2025 to 2035
  • Figure 57: North America Market Attractiveness by Material Type, 2025 to 2035
  • Figure 58: North America Market Attractiveness by Application Type, 2025 to 2035
  • Figure 59: North America Market Attractiveness by Pressure Intake, 2025 to 2035
  • Figure 60: North America Market Attractiveness by Country, 2025 to 2035
  • Figure 61: Latin America Market Value (USD Million) by Product Type, 2025 to 2035
  • Figure 62: Latin America Market Value (USD Million) by Material Type, 2025 to 2035
  • Figure 63: Latin America Market Value (USD Million) by Application Type, 2025 to 2035
  • Figure 64: Latin America Market Value (USD Million) by Pressure Intake, 2025 to 2035
  • Figure 65: Latin America Market Value (USD Million) by Country, 2025 to 2035
  • Figure 66: Latin America Market Value (USD Million) Analysis by Country, 2020 to 2035
  • Figure 67: Latin America Market Volume (Feet) Analysis by Country, 2020 to 2035
  • Figure 68: Latin America Market Value Share (%) and BPS Analysis by Country, 2025 to 2035
  • Figure 69: Latin America Market Y-o-Y Growth (%) Projections by Country, 2025 to 2035
  • Figure 70: Latin America Market Value (USD Million) Analysis by Product Type, 2020 to 2035
  • Figure 71: Latin America Market Volume (Feet) Analysis by Product Type, 2020 to 2035
  • Figure 72: Latin America Market Value Share (%) and BPS Analysis by Product Type, 2025 to 2035
  • Figure 73: Latin America Market Y-o-Y Growth (%) Projections by Product Type, 2025 to 2035
  • Figure 74: Latin America Market Value (USD Million) Analysis by Material Type, 2020 to 2035
  • Figure 75: Latin America Market Volume (Feet) Analysis by Material Type, 2020 to 2035
  • Figure 76: Latin America Market Value Share (%) and BPS Analysis by Material Type, 2025 to 2035
  • Figure 77: Latin America Market Y-o-Y Growth (%) Projections by Material Type, 2025 to 2035
  • Figure 78: Latin America Market Value (USD Million) Analysis by Application Type, 2020 to 2035
  • Figure 79: Latin America Market Volume (Feet) Analysis by Application Type, 2020 to 2035
  • Figure 80: Latin America Market Value Share (%) and BPS Analysis by Application Type, 2025 to 2035
  • Figure 81: Latin America Market Y-o-Y Growth (%) Projections by Application Type, 2025 to 2035
  • Figure 82: Latin America Market Value (USD Million) Analysis by Pressure Intake, 2020 to 2035
  • Figure 83: Latin America Market Volume (Feet) Analysis by Pressure Intake, 2020 to 2035
  • Figure 84: Latin America Market Value Share (%) and BPS Analysis by Pressure Intake, 2025 to 2035
  • Figure 85: Latin America Market Y-o-Y Growth (%) Projections by Pressure Intake, 2025 to 2035
  • Figure 86: Latin America Market Attractiveness by Product Type, 2025 to 2035
  • Figure 87: Latin America Market Attractiveness by Material Type, 2025 to 2035
  • Figure 88: Latin America Market Attractiveness by Application Type, 2025 to 2035
  • Figure 89: Latin America Market Attractiveness by Pressure Intake, 2025 to 2035
  • Figure 90: Latin America Market Attractiveness by Country, 2025 to 2035
  • Figure 91: Europe Market Value (USD Million) by Product Type, 2025 to 2035
  • Figure 92: Europe Market Value (USD Million) by Material Type, 2025 to 2035
  • Figure 93: Europe Market Value (USD Million) by Application Type, 2025 to 2035
  • Figure 94: Europe Market Value (USD Million) by Pressure Intake, 2025 to 2035
  • Figure 95: Europe Market Value (USD Million) by Country, 2025 to 2035
  • Figure 96: Europe Market Value (USD Million) Analysis by Country, 2020 to 2035
  • Figure 97: Europe Market Volume (Feet) Analysis by Country, 2020 to 2035
  • Figure 98: Europe Market Value Share (%) and BPS Analysis by Country, 2025 to 2035
  • Figure 99: Europe Market Y-o-Y Growth (%) Projections by Country, 2025 to 2035
  • Figure 100: Europe Market Value (USD Million) Analysis by Product Type, 2020 to 2035
  • Figure 101: Europe Market Volume (Feet) Analysis by Product Type, 2020 to 2035
  • Figure 102: Europe Market Value Share (%) and BPS Analysis by Product Type, 2025 to 2035
  • Figure 103: Europe Market Y-o-Y Growth (%) Projections by Product Type, 2025 to 2035
  • Figure 104: Europe Market Value (USD Million) Analysis by Material Type, 2020 to 2035
  • Figure 105: Europe Market Volume (Feet) Analysis by Material Type, 2020 to 2035
  • Figure 106: Europe Market Value Share (%) and BPS Analysis by Material Type, 2025 to 2035
  • Figure 107: Europe Market Y-o-Y Growth (%) Projections by Material Type, 2025 to 2035
  • Figure 108: Europe Market Value (USD Million) Analysis by Application Type, 2020 to 2035
  • Figure 109: Europe Market Volume (Feet) Analysis by Application Type, 2020 to 2035
  • Figure 110: Europe Market Value Share (%) and BPS Analysis by Application Type, 2025 to 2035
  • Figure 111: Europe Market Y-o-Y Growth (%) Projections by Application Type, 2025 to 2035
  • Figure 112: Europe Market Value (USD Million) Analysis by Pressure Intake, 2020 to 2035
  • Figure 113: Europe Market Volume (Feet) Analysis by Pressure Intake, 2020 to 2035
  • Figure 114: Europe Market Value Share (%) and BPS Analysis by Pressure Intake, 2025 to 2035
  • Figure 115: Europe Market Y-o-Y Growth (%) Projections by Pressure Intake, 2025 to 2035
  • Figure 116: Europe Market Attractiveness by Product Type, 2025 to 2035
  • Figure 117: Europe Market Attractiveness by Material Type, 2025 to 2035
  • Figure 118: Europe Market Attractiveness by Application Type, 2025 to 2035
  • Figure 119: Europe Market Attractiveness by Pressure Intake, 2025 to 2035
  • Figure 120: Europe Market Attractiveness by Country, 2025 to 2035
  • Figure 121: Asia Pacific Market Value (USD Million) by Product Type, 2025 to 2035
  • Figure 122: Asia Pacific Market Value (USD Million) by Material Type, 2025 to 2035
  • Figure 123: Asia Pacific Market Value (USD Million) by Application Type, 2025 to 2035
  • Figure 124: Asia Pacific Market Value (USD Million) by Pressure Intake, 2025 to 2035
  • Figure 125: Asia Pacific Market Value (USD Million) by Country, 2025 to 2035
  • Figure 126: Asia Pacific Market Value (USD Million) Analysis by Country, 2020 to 2035
  • Figure 127: Asia Pacific Market Volume (Feet) Analysis by Country, 2020 to 2035
  • Figure 128: Asia Pacific Market Value Share (%) and BPS Analysis by Country, 2025 to 2035
  • Figure 129: Asia Pacific Market Y-o-Y Growth (%) Projections by Country, 2025 to 2035
  • Figure 130: Asia Pacific Market Value (USD Million) Analysis by Product Type, 2020 to 2035
  • Figure 131: Asia Pacific Market Volume (Feet) Analysis by Product Type, 2020 to 2035
  • Figure 132: Asia Pacific Market Value Share (%) and BPS Analysis by Product Type, 2025 to 2035
  • Figure 133: Asia Pacific Market Y-o-Y Growth (%) Projections by Product Type, 2025 to 2035
  • Figure 134: Asia Pacific Market Value (USD Million) Analysis by Material Type, 2020 to 2035
  • Figure 135: Asia Pacific Market Volume (Feet) Analysis by Material Type, 2020 to 2035
  • Figure 136: Asia Pacific Market Value Share (%) and BPS Analysis by Material Type, 2025 to 2035
  • Figure 137: Asia Pacific Market Y-o-Y Growth (%) Projections by Material Type, 2025 to 2035
  • Figure 138: Asia Pacific Market Value (USD Million) Analysis by Application Type, 2020 to 2035
  • Figure 139: Asia Pacific Market Volume (Feet) Analysis by Application Type, 2020 to 2035
  • Figure 140: Asia Pacific Market Value Share (%) and BPS Analysis by Application Type, 2025 to 2035
  • Figure 141: Asia Pacific Market Y-o-Y Growth (%) Projections by Application Type, 2025 to 2035
  • Figure 142: Asia Pacific Market Value (USD Million) Analysis by Pressure Intake, 2020 to 2035
  • Figure 143: Asia Pacific Market Volume (Feet) Analysis by Pressure Intake, 2020 to 2035
  • Figure 144: Asia Pacific Market Value Share (%) and BPS Analysis by Pressure Intake, 2025 to 2035
  • Figure 145: Asia Pacific Market Y-o-Y Growth (%) Projections by Pressure Intake, 2025 to 2035
  • Figure 146: Asia Pacific Market Attractiveness by Product Type, 2025 to 2035
  • Figure 147: Asia Pacific Market Attractiveness by Material Type, 2025 to 2035
  • Figure 148: Asia Pacific Market Attractiveness by Application Type, 2025 to 2035
  • Figure 149: Asia Pacific Market Attractiveness by Pressure Intake, 2025 to 2035
  • Figure 150: Asia Pacific Market Attractiveness by Country, 2025 to 2035
  • Figure 151: MEA Market Value (USD Million) by Product Type, 2025 to 2035
  • Figure 152: MEA Market Value (USD Million) by Material Type, 2025 to 2035
  • Figure 153: MEA Market Value (USD Million) by Application Type, 2025 to 2035
  • Figure 154: MEA Market Value (USD Million) by Pressure Intake, 2025 to 2035
  • Figure 155: MEA Market Value (USD Million) by Country, 2025 to 2035
  • Figure 156: MEA Market Value (USD Million) Analysis by Country, 2020 to 2035
  • Figure 157: MEA Market Volume (Feet) Analysis by Country, 2020 to 2035
  • Figure 158: MEA Market Value Share (%) and BPS Analysis by Country, 2025 to 2035
  • Figure 159: MEA Market Y-o-Y Growth (%) Projections by Country, 2025 to 2035
  • Figure 160: MEA Market Value (USD Million) Analysis by Product Type, 2020 to 2035
  • Figure 161: MEA Market Volume (Feet) Analysis by Product Type, 2020 to 2035
  • Figure 162: MEA Market Value Share (%) and BPS Analysis by Product Type, 2025 to 2035
  • Figure 163: MEA Market Y-o-Y Growth (%) Projections by Product Type, 2025 to 2035
  • Figure 164: MEA Market Value (USD Million) Analysis by Material Type, 2020 to 2035
  • Figure 165: MEA Market Volume (Feet) Analysis by Material Type, 2020 to 2035
  • Figure 166: MEA Market Value Share (%) and BPS Analysis by Material Type, 2025 to 2035
  • Figure 167: MEA Market Y-o-Y Growth (%) Projections by Material Type, 2025 to 2035
  • Figure 168: MEA Market Value (USD Million) Analysis by Application Type, 2020 to 2035
  • Figure 169: MEA Market Volume (Feet) Analysis by Application Type, 2020 to 2035
  • Figure 170: MEA Market Value Share (%) and BPS Analysis by Application Type, 2025 to 2035
  • Figure 171: MEA Market Y-o-Y Growth (%) Projections by Application Type, 2025 to 2035
  • Figure 172: MEA Market Value (USD Million) Analysis by Pressure Intake, 2020 to 2035
  • Figure 173: MEA Market Volume (Feet) Analysis by Pressure Intake, 2020 to 2035
  • Figure 174: MEA Market Value Share (%) and BPS Analysis by Pressure Intake, 2025 to 2035
  • Figure 175: MEA Market Y-o-Y Growth (%) Projections by Pressure Intake, 2025 to 2035
  • Figure 176: MEA Market Attractiveness by Product Type, 2025 to 2035
  • Figure 177: MEA Market Attractiveness by Material Type, 2025 to 2035
  • Figure 178: MEA Market Attractiveness by Application Type, 2025 to 2035
  • Figure 179: MEA Market Attractiveness by Pressure Intake, 2025 to 2035
  • Figure 180: MEA Market Attractiveness by Country, 2025 to 2035

Frequently Asked Questions

What was the overall size of the oil and gas hose assemblies market in 2025?

The overall market size for the oil and gas hose assemblies market was USD 1.53 billion in 2025.

How big is the oil and gas hose assemblies market expected to be in 2035?

The oil and gas hose assemblies market is expected to reach USD 2.25 billion in 2035.

What will drive the demand for the oil and gas hose assemblies market during the forecast period?

Increasing oil and gas exploration activities, rising demand for flexible and durable hose solutions, and advancements in high-pressure and corrosion-resistant hose materials will drive market growth.

List the top 5 countries contributing to the oil and gas hose assemblies market?

The USA, Saudi Arabia, China, Russia, and Canada are key contributors.

Which segment in type is expected to lead in the oil and gas hose assemblies market?

Hydraulic hose assemblies are expected to dominate due to their high-pressure resistance and critical role in offshore and onshore drilling operations.

Explore Similar Insights

Future Market Insights

Oil and Gas Hose Assemblies Market