The Offshore Structural Analysis Software Market is estimated to be valued at USD 746.0 million in 2025 and is projected to reach USD 1262.3 million by 2035, registering a compound annual growth rate (CAGR) of 5.4% over the forecast period.
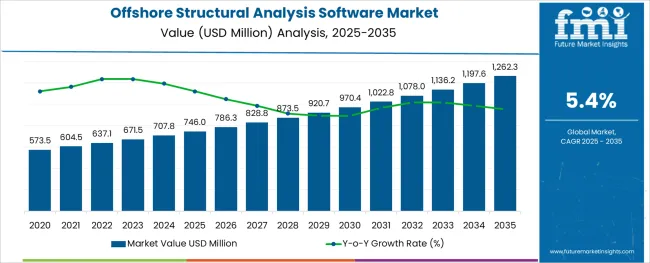
The offshore structural analysis software market has witnessed consistent growth as energy, maritime, and infrastructure operators increasingly prioritize safety, operational efficiency, and regulatory compliance in complex marine environments. The demand for precise, simulation-based structural assessment tools has intensified with the global expansion of offshore wind projects, oil & gas platforms, and subsea infrastructure installations.
Additionally, the rising emphasis on digital transformation within offshore engineering workflows has propelled the adoption of integrated, cloud-enabled software solutions capable of delivering real-time structural performance data and predictive maintenance insights. In the coming years, market momentum is expected to strengthen as engineering firms and offshore asset owners invest in advanced analysis platforms capable of managing dynamic environmental loads, fatigue analysis, and complex geometries associated with next-generation offshore structures.
The sector’s growth outlook is further supported by the increasing application of AI-driven analytics, digital twin models, and remote inspection technologies, ensuring that offshore projects remain operationally resilient and compliant with stringent global safety standards while reducing costs and improving lifecycle asset management.
The market is segmented by Components and End-use Industry and region. By Components, the market is divided into Software and Services. In terms of End-use Industry, the market is classified into Maritime, Oil & Gas, Power Generation, and Government and Defense. Regionally, the market is classified into North America, Latin America, Western Europe, Eastern Europe, Balkan & Baltic Countries, Russia & Belarus, Central Asia, East Asia, South Asia & Pacific, and the Middle East & Africa.
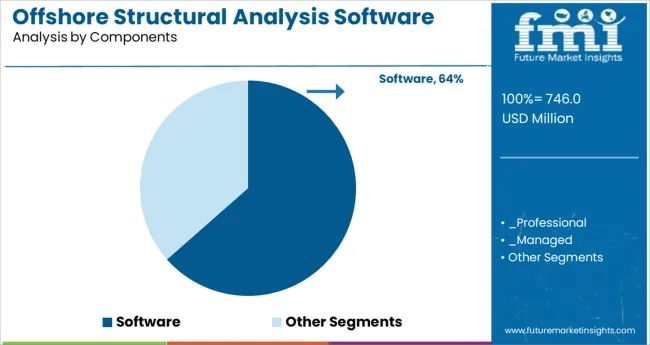
The software segment held a dominant 63.5% market share in the offshore structural analysis software market, driven by the essential role these solutions play in enabling accurate, reliable, and real-time structural simulations for offshore assets. The segment’s growth has been underpinned by the increasing complexity of offshore infrastructure projects, where precise modeling of environmental loads, fatigue behavior, and material stresses is critical to operational integrity and regulatory compliance.
With energy firms, EPC contractors, and offshore design specialists seeking to reduce project risk and lifecycle costs, demand for feature-rich, interoperable, and cloud-compatible software platforms has remained consistently high. The proliferation of offshore wind farms, floating production units, and subsea pipelines has further elevated the reliance on specialized software capable of handling nonlinear analysis, fluid-structure interaction, and dynamic response calculations.
As offshore project scopes expand into deeper waters and harsher environmental conditions, software solutions offering AI-powered analytics, integrated digital twin frameworks, and remote collaboration functionalities are expected to reinforce the segment’s market leadership and long-term adoption rates.
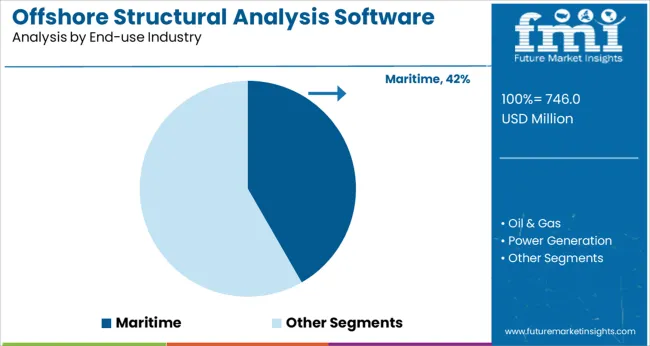
In terms of end-use industries, the maritime segment led with a 41.7% market share, maintaining its position as the principal application area for offshore structural analysis software. This dominance is attributed to the sector’s stringent structural safety requirements, the growing complexity of offshore vessel designs, and the increasing deployment of floating production, storage, and offloading (FPSO) units, offshore support vessels, and subsea transport systems.
Structural analysis software enables maritime operators to accurately model vessel responses to wave, wind, and current-induced loads, optimize structural configurations, and ensure compliance with international marine classification standards. The segment’s sustained growth has also been bolstered by ongoing investment in offshore wind turbine installation vessels and floating liquefied natural gas (FLNG) platforms, necessitating advanced simulation capabilities.
Additionally, rising environmental and operational safety expectations have prompted maritime asset owners to adopt predictive analysis and digital twin technologies for structural integrity monitoring. As regulatory frameworks tighten and offshore logistics become more complex, the maritime industry’s reliance on robust, simulation-driven analysis platforms is projected to secure continued segmental growth.
The offshore structural analysis software market is predicted to increase due to factors such as rising demand for cost-effective offshore engineering, rising demand from the oil and gas industry, and rising desire for an environmentally friendly work environment.
The increasing demand for offshore structural analysis software by technological advancements, architects and engineers, and the increasing importance of engineers, architects, and contractors on the use of this software are some of the other factors that are expected to drive the growth of the offshore structural analysis software market in the forecast period.
Other significant drivers for the global offshore structural analysis software market in the coming years include rising demand for offshore structures with rising expenditure in the oil and gas industry, increased maintenance power, increased use of cloud-based computing and deployment services, and increasing awareness of the effective and timely analysis of various offshore structures.
As a result, these offshore structure features lead to open up opportunities in the offshore structural analysis software market. Trends in the offshore structural analysis software market, such as technical advancements in subsea protecting structures, skidding systems, drilling templates, platforms, tension decks, and substitutes connected to offshore structures, will expand profitable opportunities for the market's growth in the near future.
However, the high investment cost and the difficulty faced by ground-level personnel in implementing offshore structural analysis software are the factors most likely to stymie the market's expansion in the next few years.
A major obstacle is a scarcity of people with combined abilities in both software platforms and offshore structural analysis, which prohibits enterprises from adopting offshore structural analysis software, stifling the market's growth. Trained and skilled personnel are required for operational efficiency and to take a competitive advantage in the offshore structural analysis software market.
Component, end-user industry, and region have all been used to segment the global offshore structural analysis software market. The market is divided into two components: software and services, with software being further divided into cloud and on-premise, and services is divided into managed and professional. The market is divided into four segments based on end-use industries: oil and gas, marine, government and defense, and power generation.
Based on components, the software segment is anticipated to have the highest CAGR of 5.7% during the forecast period. The offshore structural analysis software market for on-premise software is projected to be quite appealing. This is owing to the widespread use of on-premise software around the world, as well as security worries about internet or cloud-based software.
Cloud-based software, on the other hand, is predicted to have a high CAGR index of 5.7% for offshore structural analysis software. This is mostly due to increased demand from end-users, such as architects, contractors, engineers, and owners in the oil and gas, maritime, power generation, and government and defense industries, for cost-effective, dynamic, and efficient offshore structural analysis software.
With a projected CAGR of 5.9%, the oil and gas segment would contribute the greatest share of the market by end-user. The improved benefits of offshore structure analysis software in the oil and gas segment, such as safety standards, design compliance, and virtual asset creation, as well as improved offshore workforce collaboration, are likely to promote its adoption in the forecast years.
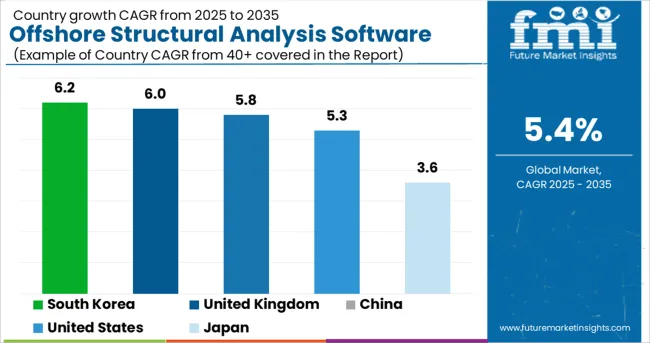
| Regions | CAGR (2025 to 2035) |
|---|---|
| United States | 5.3% |
| United Kingdom | 6% |
| China | 5.8% |
| Japan | 3.6% |
| South Korea | 6.2% |
Due to the growing demand for structures with high maintenance power, Asia Pacific formerly dominated the offshore structural analysis software industry. Additionally, rising investments in the oil and gas industry are likely to propel the offshore structure analysis software market in the area during the research period.
As of the growing awareness of offshore structural analysis software in North America, the market for offshore structural analysis software is expected to increase significantly, with a CAGR of 5.3% and an anticipated market value of 181.8 million. The offshore structural analysis software market in North America would increase due to the presence of key suppliers in the region and technical advancements in offshore projects.
North America's offshore structural analysis software market is dominated by the USA and Canada. The market in this region will increase at a quicker rate than the market in other regions.
The development of cloud-based services is expected to accelerate the expansion of the offshore structural analysis software market in the area in the coming years by lowering the high maintenance and running costs associated with the program.
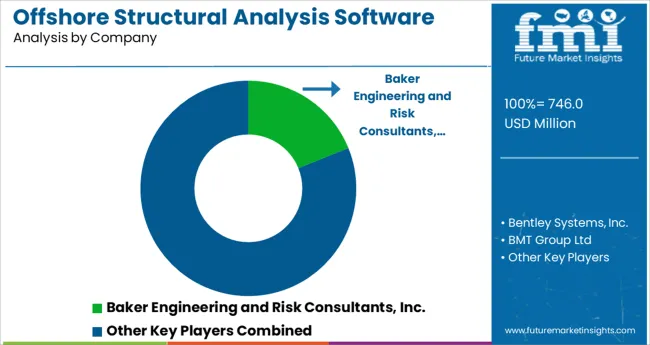
The offshore structural analysis software market report's competitive scenario analyses evaluate, and position firms based on a variety of performance factors. The financial performance of organizations over the last few years, growth plans, new product launches, investments, product innovations, market share growth, and so on are some of the elements analyzed in this research.
Players in the offshore structural analysis software market are primarily focused on the creation of creative and efficient services. The findings illustrate how rivals are capitalizing on the potential in the offshore structural analysis software market. The following are some of the most recent advancements in the network telemetry market:
The global offshore structural analysis software market is estimated to be valued at USD 746.0 million in 2025.
It is projected to reach USD 1,262.3 million by 2035.
The market is expected to grow at a 5.4% CAGR between 2025 and 2035.
The key product types are software, _professional, _managed, services, _cloud and _on-premise.
maritime segment is expected to dominate with a 41.7% industry share in 2025.


Full Research Suite comprises of:
Market outlook & trends analysis
Interviews & case studies
Strategic recommendations
Vendor profiles & capabilities analysis
5-year forecasts
8 regions and 60+ country-level data splits
Market segment data splits
12 months of continuous data updates
DELIVERED AS:
PDF EXCEL ONLINE
Offshore Wind Market Forecast and Outlook 2025 to 2035
Offshore Wind Turbine Bearing Market Size and Share Forecast Outlook 2025 to 2035
Offshore Platform Electrification Market Size and Share Forecast Outlook 2025 to 2035
Offshore Drilling Riser Market Size and Share Forecast Outlook 2025 to 2035
Offshore Crane Market Size and Share Forecast Outlook 2025 to 2035
Offshore Wind Turbine Blade Market Size and Share Forecast Outlook 2025 to 2035
Offshore Wind Turbine Market Size and Share Forecast Outlook 2025 to 2035
Offshore Pipeline Infrastructure Market Size and Share Forecast Outlook 2025 to 2035
Offshore Wind Energy Market Size and Share Forecast Outlook 2025 to 2035
Offshore ROV Market Growth – Trends & Forecast 2024-2034
Offshore Equipment Market
Offshore Wind Energy Infrastructure Market
Fixed Offshore Wind Energy Market Size and Share Forecast Outlook 2025 to 2035
Export Offshore Wind Cable Market Size and Share Forecast Outlook 2025 to 2035
Floating Offshore Wind Energy Market Size and Share Forecast Outlook 2025 to 2035
Inter Array Offshore Wind Cable Market Size and Share Forecast Outlook 2025 to 2035
Structural Waterproofing Services Market Size and Share Forecast Outlook 2025 to 2035
Structural Health Monitoring Market Size and Share Forecast Outlook 2025 to 2035
Structural Copper Wire Market Size and Share Forecast Outlook 2025 to 2035
Structural Heart Devices Market Size and Share Forecast Outlook 2025 to 2035

Thank you!
You will receive an email from our Business Development Manager. Please be sure to check your SPAM/JUNK folder too.
Chat With
MaRIA