Occupancy Sensor Market Size and Share Forecast Outlook 2025 to 2035

The Occupancy Sensor Market is estimated to be valued at USD 3.0 billion in 2025 and is projected to reach USD 9.2 billion by 2035, registering a compound annual growth rate (CAGR) of 12.0% over the forecast period.
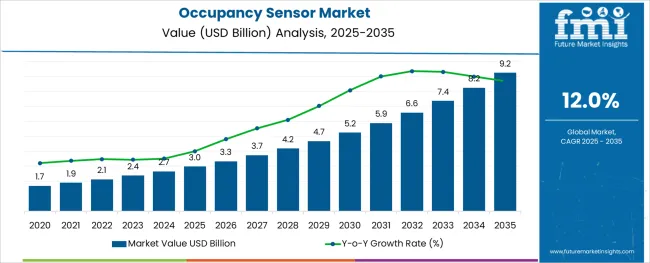
Quick Stats for Occupancy Sensor Market

  • Industry Value (2025): USD 3.0 billion
  • Forecast Value (2035): USD 9.2 billion
  • Forecast CAGR: 12.0%
  • Leading Segment: Wireless Network Occupancy Sensor (58.0%)
  • Key Growth Region: North America, Asia-Pacific, Europe
  • Top Key Players: Acuity Brands Inc., Honeywell International Inc., Schneider Electric SA, Johnson Controls Inc., Eaton Corporation Plc., Texas Instruments Inc., Leviton Manufacturing Co., Inc., Lutron Electronics Co., Inc., Legrand SA, Hubbell Incorporated

Occupancy Sensor Market

Rationale for Segmental Growth in the Occupancy Sensor Market

Market Overview

The occupancy sensor market is experiencing strong momentum, fueled by regulatory mandates for energy conservation, rising adoption of smart building systems, and the integration of IoT-enabled infrastructure. These sensors play a pivotal role in automating lighting, HVAC, and security systems by detecting motion or presence, thereby reducing energy waste and improving building operational efficiency.

he shift toward contactless technologies and touch-free environments has further accelerated adoption across both new construction and retrofit projects. Technological advancements in sensor sensitivity, wireless connectivity, and AI-based motion recognition have expanded use cases across commercial, residential, and institutional buildings. Future growth is expected to be supported by ongoing urbanization, green building certifications, and the implementation of intelligent occupancy-based automation in smart city frameworks.

The convergence of building management systems (BMS) with cloud-based analytics is paving the way for real-time optimization and predictive control, making occupancy sensors a cornerstone of next-generation energy infrastructure.

Segmental Analysis

The market is segmented by Network Connectivity Type and Application Type and region. By Network Connectivity Type, the market is divided into Wireless Network Occupancy Sensor and Wired Network Occupancy Sensor. In terms of Application Type, the market is classified into Occupancy Sensor for Commercial Applications, Occupancy Sensors for Government Establishments, Occupancy Sensors for Industrial Applications, and Occupancy Sensor for Residential Sectors. Regionally, the market is classified into North America, Latin America, Western Europe, Eastern Europe, Balkan & Baltic Countries, Russia & Belarus, Central Asia, East Asia, South Asia & Pacific, and the Middle East & Africa.
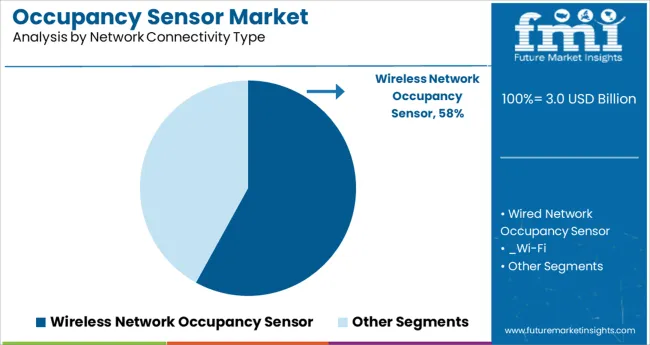
Insights into the Wireless Network Connectivity Segment

Occupancy Sensor Market Analysis By Network Connectivity Type

Wireless network occupancy sensors are expected to account for 58.0% of the total market revenue in 2025, establishing them as the leading connectivity type. This dominance is being driven by the ease of installation, scalability, and cost efficiency offered by wireless systems, particularly in retrofit environments where wired configurations are impractical or expensive. Wireless sensors support seamless integration with building management platforms and enable remote configuration, firmware updates, and data analytics without physical intervention.

The proliferation of standardized wireless protocols such as Zigbee, Z-Wave, Bluetooth Low Energy (BLE), and LoRaWAN has enhanced interoperability across multi-vendor ecosystems, fostering broader deployment across smart offices, campuses, and industrial facilities.

As smart building projects continue to prioritize flexibility and minimal infrastructure disruption, wireless sensors are increasingly favored for their adaptability, energy efficiency, and real-time responsiveness in dynamic occupancy scenarios.
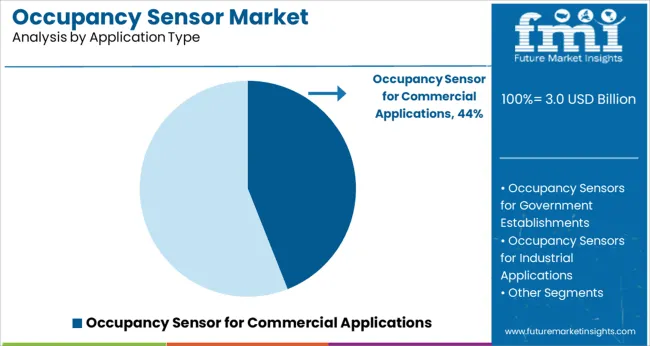
Insights into the Commercial Application Segment

Occupancy Sensor Market Analysis By Application Type

Occupancy sensors used in commercial applications are projected to capture 44.0% of the total market revenue in 2025, making this the leading application segment. Growth in this segment is being driven by large-scale adoption in office buildings, retail stores, educational institutions, and healthcare facilities seeking to lower operational costs through automated lighting and HVAC control.

Sensors used in commercial environments are often integrated with centralized BMS platforms, offering advanced scheduling, usage analytics, and compliance reporting. The high foot traffic and varied occupancy patterns in commercial buildings make them ideal candidates for motion detection and ambient sensing technologies that improve energy performance without manual intervention.

Increased emphasis on sustainability certifications such as LEED and WELL Building Standard is encouraging developers and facility managers to deploy occupancy sensors as a means to meet energy efficiency benchmarks. The ability to reduce energy usage while improving occupant comfort and security has firmly positioned this segment at the forefront of adoption trends.

Technology-Enabled Smart Products Drive Occupancy Sensor Market Growth

The growing popularity of energy-efficient sensors is one of the major factors that contribute to the global occupancy sensor market's growth. With government policies pertaining to energy savings and the continuous advancement of advanced and cost-effective occupancy sensors, the global occupancy sensor market is expected to expand over the forecast period.

Global occupancy market growth has been boosted by advanced occupancy sensors like intelligent occupancy sensors, image processing occupancy sensors, and microphonics. Increasingly, lighting controllers are becoming increasingly popular in smart homes, as well as the growing popularity of wireless occupancy sensors, which is positively affecting the growth of the occupancy sensor market. Additionally, under the current technological landscape, key players in the occupancy sensor market are expected to experience high growth opportunities in the coming years.

Furthermore, the development of smart cities has also been shown to be a major factor that encourages growth in the economy. As part of intelligent parking solutions, these sensors are used to monitor parking spaces and control congestion. Occupancy sensors must be implemented both indoors and outdoors to minimize energy consumption and light pollution created in the environment. As a result, all of these factors contribute to the market growth of occupancy sensors.

What are the Key Factors Limiting the Global Occupancy Sensor Market?

The inconsistency of wireless network systems and false triggering of switches is anticipated to hamper market growth during the forecast period. Occupancy sensors that trigger incorrectly have been a major roadblock to the growth of the studied market for the last decade.

Sensors will falsely trigger when there is movement in the space. Due to their sensitivity to a wide range of motion, they also react to movements that are not related to occupants. False triggers may occur as a result of sunlight shining on the sensor, persons passing close to it, or machinery heating objects that are positioned nearby. Likewise, sensors don't work well in partitioned offices. Lighting systems and other components that are connected to them have a much shorter life expectancy if sensors are continuously on and off.
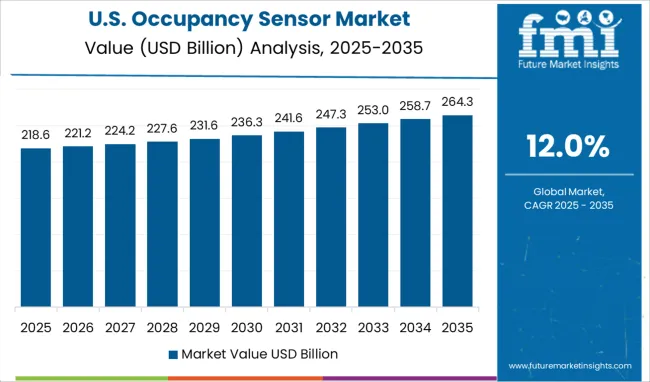
Why is North America the Leading Market for Occupancy Sensors?

United States Occupancy Sensor Market

North America is expected to be the largest market for occupancy sensors in the market. These regions have a higher market for occupancy sensors for commercial and residential buildings than any other region in the world. As of 2025, occupancy sensors are expected to account for 38% of the market in these regions.

The region's occupancy sensor value chain is highly organized and regulated. As a result, customer orders and installation are streamlined. Due to advancements in products and alliances between manufacturers, the North American occupancy sensor is expected to maintain its lead in the market.

Due to its cost-effective matrix, technology plays a critical role in this sector. As a result of developments in several sectors and the growth of wireless network infrastructure, the United States is leading the market. As a result, it is predicted that the USA market will be heavily influenced by the growing demand for HVAC systems in this region.
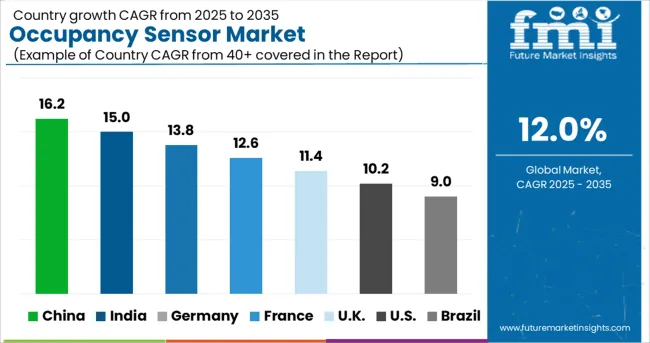
How is Europe fostering Wireless Occupancy Sensor Market Growth?

Country Wise Analysis Of Occupancy Sensor Market

Europe has witnessed a higher 7% CAGR in occupancy sensors in the market. Europe has benefited significantly from increased construction activity, contributing to the growth of occupancy sensor sales in the market. Home automation and smart lighting are expected to gain traction in Europe, driven by strong activity in the smart home space in the United Kingdom.

The occupancy sensors are expected to hold a 24.5% market share in 2025. Since wireless networks are less expensive to install and have better connectivity than wired networks, their demand is expected to grow over the forecast period. Sensors that detect occupancy are lightweight and can be attached to walls with hooks, magnetic tape, or screws. Wireless occupancy sensors will also be in high demand due to their ease of integration with other wireless controls, devices, and networks in this region.

Category-wise Insights

What is the Impact of Wi-Fi on the Occupancy Sensor Market?

Sensors that are connected to Wi-Fi are placed around an indoor space to do Wi-Fi positioning. Increasing demand for 5G networks has boosted the market growth for wi-fi in various regions and occupancy sensors globally. The use of desk occupancy sensors is growing in popularity because they are placed under desks to detect when the desks are occupied or empty.

The temperature and humidity values of the place where this sensor is installed can also be measured by the sensor's built-in sensor. Recent studies have suggested that the amount of energy consumed for reheating can be reduced by 38% by adjusting HVAC systems according to the number of individuals inside a room. Furthermore, accurate estimation of occupants of rooms improves the building's security and safety. Occupancy sensors are expected to become more prevalent in the market as more and more rooms are equipped with wireless networks.

Why Occupancy Sensors are deployed the most for Residential Purposes?

Based on application type, the market is segmented into government, industrial, commercial, and residential sectors. The residential building market is expected to grow at a CAGR of 9.6% over the forecast period. The latest technology plays a key role in helping homeowners manage their energy consumption, reduce costs, and maintain a green environment in their houses. People are increasingly implementing occupancy sensors at their residences due to home automation trends and a desire to reduce electricity bills.

In recent years, owing to the increasing demand for surveillance and security systems in residential buildings, there has been strong growth in the occupancy sensor market. As disposable income increases, home automation technology is used more often in residences. Not only does the technology automate the house's devices, but it also makes it more secure. In addition, residents are becoming more aware of smart homes and automation, which is expected to drive the need for occupancy sensors in residential buildings. Furthermore, residential buildings need solutions that can reduce their power consumption to decrease the per capita electricity consumption.

What Role do Start-ups Play in Occupancy Sensor Technology?

With the rise in popularity of smart cities and smart construction, start-ups are introducing occupancy sensors to the market. Additionally, to offering wireless occupancy sensors, these technology start-up companies also engage in a wide range of production and distribution activities. Since the use of wireless occupancy sensors in residential buildings has evolved dramatically, the majority of wireless occupancy sensors are deployed across a variety of technologies.
  • Known Quantity Sensors was founded in the year 2020, in Atlanta, United States. Building, automation, and real estate occupancy sensors are provided by Known Quantity Sensors using AI-based image processing. In the images of the building, the occupancy sensor integrates a camera and computing module that determines motion, faces, and people.
  • Antalis Things was founded in 2020 in headquartered in Torrelodones, Spain. Antalis Things manufactures devices capable of connecting to the Internet of Things. The range of products includes occupancy sensors, logistics tracking systems, humidity sensors, asset tracking systems, lighting controls, and temperature sensors. Additionally, a combination of the above-mentioned products can be combined with additional sensors that can be customized according to the needs of the clients. It has a wide range of applications, including smart tracking, retail, smart office, and intelligent lighting. Partnering with Sigfox is part of the company's strategy.
  • Enlighted was established in 2009 in Sunnyvale, United States. Enlighted improves the efficiency and responsiveness of built environments. With their solution, energy costs are reduced and occupants are increased. Enlighted's network platform collects and analyzes data safely and securely from wireless sensors in office buildings, including occupancy and environment. The Enlighted Energy Manager responds intelligently to occupants' presence and preferences by adjusting the lighting level. Enlighted provides its Lightning system via its GEO program, while the client pays Enlighted a lower utility rate than they do with their local utility provider. Energy costs are guaranteed to be reduced by 10-20% under the program. Sensors on building assets can collect data from the system (marketed by Oracle and Hitachi). A new project is also being worked on with Google.

Competition Analysis

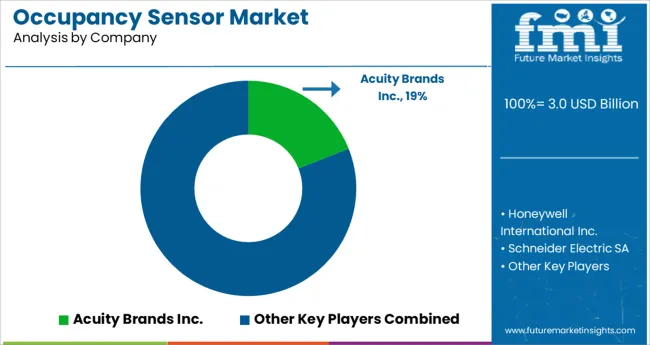
Occupancy Sensor Market Analysis By Company

Major players in the market are developing a wide range of advanced and innovative sensors to gain a long-term competitive advantage, such as image processing sensors, microphonic sensors, and intelligent occupancy sensors.

Key players in the global occupancy sensor market include Eaton Corporation Plc., Honeywell International Inc., Schneider Electric SA, Johnson Controls Inc., Acuity Brands Inc., Texas Instruments Inc., Leviton Manufacturing Co., Inc., Lutron Electronics Co., Inc., Legrand SA, and Hubbell Incorporated, Known Quantity Sensors, Antalis, Enlighted, Novelda, Volvo and among others.

  • In September 2025, Novelda, the best-selling human presence sensor brand, announced its ultra-wideband occupancy sensor (UWB). As soon as one approaches the sensor, lights are instantly turned on and quickly turned off, enhancing energy savings and improving user experience. This sensor brings building lighting automation to the next level of automation by allowing the user to configure the time-out and the precise detection zone.
  • In September 2025, Volvo is expected to launch the EX90, which could replace the EX90. In addition, Volvo collaborates with Luminar and announces some important innovations including remote sensing, human behavior monitoring, and improved occupant safety in the interior. With the introduction of the EX90, Volvo has installed radar and various sensors inside a series of areas, including the overhead console, the luggage compartment, and the rear lamps mounted on the roof. Small movements in the interior can be detected by these sensors. A sensor throughout the cabin detects whether a child or pet has remained inside the car. In combination with occupancy sensors, these sensors activate once any passengers are detected inside but the occupancy sensor fails to do so.

Report Scope

Report Attribute Details
Growth Rate CAGR of 12% from 2025 to 2035
Market Value in 2025 USD 3.0 billion
Market Value in 2035 USD 9.2 billion
Base Year for Estimation 2024
Historical Data 2020 to 2024
Forecast Period 2025 to 2035
Quantitative Units Revenue in USD Million and CAGR from 2025 to 2035
Report Coverage Revenue Forecast, Company Ranking, Competitive Landscape, Growth Factors, Trends, and Pricing Analysis
Segments Covered Network Connectivity, Application, Region
Regions Covered North America; Latin America; Europe; South Asia; East Asia; Oceania; Middle East and Africa
Key Countries Profiled The USA, Canada, Brazil, Mexico, Germany, The United Kingdom, France, Spain, Italy, China, Japan, South Korea, India, Malaysia, Singapore, Thailand, Australia, New Zealand, GCC, South Africa, Israel
Key Companies Profiled Eaton Corporation Plc.; Honeywell International Inc.; Schneider Electric SA; Johnson Controls Inc.; Acuity Brands Inc.; Texas Instruments Inc.; Leviton Manufacturing Co., Inc.; Lutron Electronics Co., Inc.; Legrand SA; Hubbell Incorporated
Customization Available Upon Request

Key Segments Profiled in the Global Occupancy Sensor Market

By Network Connectivity Type:

  • Wired Network
  • Wireless Network
    • Wi-Fi
    • Zigbee
    • Z-Wave
    • Others

By Application:

  • Government Establishments
  • Industrial Applications
  • Commercial Applications
  • Residential Sectors

By Region:

  • North America
  • Latin America
  • Europe
  • South Asia
  • East Asia
  • Oceania
  • Middle East & Africa

Table of Content

  1. Executive Summary
    • Global Market Outlook
    • Demand-side Trends
    • Supply-side Trends
    • Technology Roadmap Analysis
    • Analysis and Recommendations
  2. Market Overview
    • Market Coverage/Taxonomy
    • Market Definition/Scope/Limitations
  3. Market Background
    • Market Dynamics
      • Drivers
      • Restraints
      • Opportunity
      • Trends
    • Scenario Forecast
      • Demand in Optimistic Scenario
      • Demand in Likely Scenario
      • Demand in Conservative Scenario
    • Opportunity Map Analysis
    • Product Life Cycle Analysis
    • Supply Chain Analysis
    • Investment Feasibility Matrix
    • Value Chain Analysis
    • PESTLE and Porter’s Analysis
    • Regulatory Landscape
    • Regional Parent Market Outlook
    • Production and Consumption Statistics
    • Import and Export Statistics
  4. Global Market Analysis 2020 to 2024 and Forecast, 2025 to 2035
    • Historical Market Size Value (USD Million) Analysis, 2020 to 2024
    • Current and Future Market Size Value (USD Million) Projections, 2025 to 2035
      • Y-o-Y Growth Trend Analysis
      • Absolute $ Opportunity Analysis
  5. Global Market Pricing Analysis 2020 to 2024 and Forecast 2025 to 2035
  6. Global Market Analysis 2020 to 2024 and Forecast 2025 to 2035, By Network Connectivity Type
    • Introduction/Key Findings
    • Historical Market Size Value (USD Million) Analysis By Network Connectivity Type , 2020 to 2024
    • Current and Future Market Size Value (USD Million) Analysis and Forecast By Network Connectivity Type , 2025 to 2035
      • Wireless Network Occupancy Sensor
      • Wired Network Occupancy Sensor
        • Wi-Fi
        • Zigbee
        • Z-Wave
        • Others
    • Y-o-Y Growth Trend Analysis By Network Connectivity Type , 2020 to 2024
    • Absolute $ Opportunity Analysis By Network Connectivity Type , 2025 to 2035
  7. Global Market Analysis 2020 to 2024 and Forecast 2025 to 2035, By Application Type
    • Introduction/Key Findings
    • Historical Market Size Value (USD Million) Analysis By Application Type, 2020 to 2024
    • Current and Future Market Size Value (USD Million) Analysis and Forecast By Application Type, 2025 to 2035
      • for Commercial Applications
      • Occupancy Sensors for Government Establishments
      • Occupancy Sensors for Industrial Applications
      • for Residential Sectors
    • Y-o-Y Growth Trend Analysis By Application Type, 2020 to 2024
    • Absolute $ Opportunity Analysis By Application Type, 2025 to 2035
  8. Global Market Analysis 2020 to 2024 and Forecast 2025 to 2035, By Region
    • Introduction
    • Historical Market Size Value (USD Million) Analysis By Region, 2020 to 2024
    • Current Market Size Value (USD Million) Analysis and Forecast By Region, 2025 to 2035
      • North America
      • Latin America
      • Western Europe
      • Eastern Europe
      • East Asia
      • South Asia and Pacific
      • Middle East & Africa
    • Market Attractiveness Analysis By Region
  9. North America Market Analysis 2020 to 2024 and Forecast 2025 to 2035, By Country
    • Historical Market Size Value (USD Million) Trend Analysis By Market Taxonomy, 2020 to 2024
    • Market Size Value (USD Million) Forecast By Market Taxonomy, 2025 to 2035
      • By Country
        • USA
        • Canada
        • Mexico
      • By Network Connectivity Type
      • By Application Type
    • Market Attractiveness Analysis
      • By Country
      • By Network Connectivity Type
      • By Application Type
    • Key Takeaways
  10. Latin America Market Analysis 2020 to 2024 and Forecast 2025 to 2035, By Country
    • Historical Market Size Value (USD Million) Trend Analysis By Market Taxonomy, 2020 to 2024
    • Market Size Value (USD Million) Forecast By Market Taxonomy, 2025 to 2035
      • By Country
        • Brazil
        • Chile
        • Rest of Latin America
      • By Network Connectivity Type
      • By Application Type
    • Market Attractiveness Analysis
      • By Country
      • By Network Connectivity Type
      • By Application Type
    • Key Takeaways
  11. Western Europe Market Analysis 2020 to 2024 and Forecast 2025 to 2035, By Country
    • Historical Market Size Value (USD Million) Trend Analysis By Market Taxonomy, 2020 to 2024
    • Market Size Value (USD Million) Forecast By Market Taxonomy, 2025 to 2035
      • By Country
        • Germany
        • UK
        • Italy
        • Spain
        • France
        • Nordic
        • BENELUX
        • Rest of Western Europe
      • By Network Connectivity Type
      • By Application Type
    • Market Attractiveness Analysis
      • By Country
      • By Network Connectivity Type
      • By Application Type
    • Key Takeaways
  12. Eastern Europe Market Analysis 2020 to 2024 and Forecast 2025 to 2035, By Country
    • Historical Market Size Value (USD Million) Trend Analysis By Market Taxonomy, 2020 to 2024
    • Market Size Value (USD Million) Forecast By Market Taxonomy, 2025 to 2035
      • By Country
        • Russia
        • Poland
        • Hungary
        • Balkan & Baltic
        • Rest of Eastern Europe
      • By Network Connectivity Type
      • By Application Type
    • Market Attractiveness Analysis
      • By Country
      • By Network Connectivity Type
      • By Application Type
    • Key Takeaways
  13. East Asia Market Analysis 2020 to 2024 and Forecast 2025 to 2035, By Country
    • Historical Market Size Value (USD Million) Trend Analysis By Market Taxonomy, 2020 to 2024
    • Market Size Value (USD Million) Forecast By Market Taxonomy, 2025 to 2035
      • By Country
        • China
        • Japan
        • South Korea
      • By Network Connectivity Type
      • By Application Type
    • Market Attractiveness Analysis
      • By Country
      • By Network Connectivity Type
      • By Application Type
    • Key Takeaways
  14. South Asia and Pacific Market Analysis 2020 to 2024 and Forecast 2025 to 2035, By Country
    • Historical Market Size Value (USD Million) Trend Analysis By Market Taxonomy, 2020 to 2024
    • Market Size Value (USD Million) Forecast By Market Taxonomy, 2025 to 2035
      • By Country
        • India
        • ASEAN
        • Australia & New Zealand
        • Rest of South Asia and Pacific
      • By Network Connectivity Type
      • By Application Type
    • Market Attractiveness Analysis
      • By Country
      • By Network Connectivity Type
      • By Application Type
    • Key Takeaways
  15. Middle East & Africa Market Analysis 2020 to 2024 and Forecast 2025 to 2035, By Country
    • Historical Market Size Value (USD Million) Trend Analysis By Market Taxonomy, 2020 to 2024
    • Market Size Value (USD Million) Forecast By Market Taxonomy, 2025 to 2035
      • By Country
        • Kingdom of Saudi Arabia
        • Other GCC Countries
        • Turkiye
        • South Africa
        • Other African Union
        • Rest of Middle East & Africa
      • By Network Connectivity Type
      • By Application Type
    • Market Attractiveness Analysis
      • By Country
      • By Network Connectivity Type
      • By Application Type
    • Key Takeaways
  16. Key Countries Market Analysis
    • USA
      • Pricing Analysis
      • Market Share Analysis, 2024
        • By Network Connectivity Type
        • By Application Type
    • Canada
      • Pricing Analysis
      • Market Share Analysis, 2024
        • By Network Connectivity Type
        • By Application Type
    • Mexico
      • Pricing Analysis
      • Market Share Analysis, 2024
        • By Network Connectivity Type
        • By Application Type
    • Brazil
      • Pricing Analysis
      • Market Share Analysis, 2024
        • By Network Connectivity Type
        • By Application Type
    • Chile
      • Pricing Analysis
      • Market Share Analysis, 2024
        • By Network Connectivity Type
        • By Application Type
    • Germany
      • Pricing Analysis
      • Market Share Analysis, 2024
        • By Network Connectivity Type
        • By Application Type
    • UK
      • Pricing Analysis
      • Market Share Analysis, 2024
        • By Network Connectivity Type
        • By Application Type
    • Italy
      • Pricing Analysis
      • Market Share Analysis, 2024
        • By Network Connectivity Type
        • By Application Type
    • Spain
      • Pricing Analysis
      • Market Share Analysis, 2024
        • By Network Connectivity Type
        • By Application Type
    • France
      • Pricing Analysis
      • Market Share Analysis, 2024
        • By Network Connectivity Type
        • By Application Type
    • India
      • Pricing Analysis
      • Market Share Analysis, 2024
        • By Network Connectivity Type
        • By Application Type
    • ASEAN
      • Pricing Analysis
      • Market Share Analysis, 2024
        • By Network Connectivity Type
        • By Application Type
    • Australia & New Zealand
      • Pricing Analysis
      • Market Share Analysis, 2024
        • By Network Connectivity Type
        • By Application Type
    • China
      • Pricing Analysis
      • Market Share Analysis, 2024
        • By Network Connectivity Type
        • By Application Type
    • Japan
      • Pricing Analysis
      • Market Share Analysis, 2024
        • By Network Connectivity Type
        • By Application Type
    • South Korea
      • Pricing Analysis
      • Market Share Analysis, 2024
        • By Network Connectivity Type
        • By Application Type
    • Russia
      • Pricing Analysis
      • Market Share Analysis, 2024
        • By Network Connectivity Type
        • By Application Type
    • Poland
      • Pricing Analysis
      • Market Share Analysis, 2024
        • By Network Connectivity Type
        • By Application Type
    • Hungary
      • Pricing Analysis
      • Market Share Analysis, 2024
        • By Network Connectivity Type
        • By Application Type
    • Kingdom of Saudi Arabia
      • Pricing Analysis
      • Market Share Analysis, 2024
        • By Network Connectivity Type
        • By Application Type
    • Turkiye
      • Pricing Analysis
      • Market Share Analysis, 2024
        • By Network Connectivity Type
        • By Application Type
    • South Africa
      • Pricing Analysis
      • Market Share Analysis, 2024
        • By Network Connectivity Type
        • By Application Type
  17. Market Structure Analysis
    • Competition Dashboard
    • Competition Benchmarking
    • Market Share Analysis of Top Players
      • By Regional
      • By Network Connectivity Type
      • By Application Type
  18. Competition Analysis
    • Competition Deep Dive
      • Acuity Brands Inc.
        • Overview
        • Product Portfolio
        • Profitability by Market Segments (Product/Age /Sales Channel/Region)
        • Sales Footprint
        • Strategy Overview
          • Marketing Strategy
          • Product Strategy
          • Channel Strategy
      • Honeywell International Inc.
      • Schneider Electric SA
      • Johnson Controls Inc.
      • Eaton Corporation Plc.
      • Texas Instruments Inc.
      • Leviton Manufacturing Co., Inc.
      • Lutron Electronics Co., Inc.
      • Legrand SA
      • Hubbell Incorporated
  19. Assumptions & Acronyms Used
  20. Research Methodology

List of Tables

  • Table 1: Global Market Value (USD Million) Forecast by Region, 2020-2035
  • Table 2: North America Market Value (USD Million) Forecast by Country, 2020-2035
  • Table 3: Latin America Market Value (USD Million) Forecast by Country, 2020-2035
  • Table 4: Western Europe Market Value (USD Million) Forecast by Country, 2020-2035
  • Table 5: Eastern Europe Market Value (USD Million) Forecast by Country, 2020-2035
  • Table 6: East Asia Market Value (USD Million) Forecast by Country, 2020-2035
  • Table 7: South Asia and Pacific Market Value (USD Million) Forecast by Country, 2020-2035
  • Table 8: Middle East & Africa Market Value (USD Million) Forecast by Country, 2020-2035

List of Figures

  • Figure 1: Global Market Pricing Analysis
  • Figure 2: Global Market Value (USD Million) Forecast 2020-2035
  • Figure 3: Global Market Value (USD Million) Share and BPS Analysis by Region, 2025 and 2035
  • Figure 4: Global Market Y-o-Y Growth Comparison by Region, 2025-2035
  • Figure 5: Global Market Attractiveness Analysis by Region
  • Figure 6: North America Market Incremental $ Opportunity, 2025-2035
  • Figure 7: Latin America Market Incremental $ Opportunity, 2025-2035
  • Figure 8: Western Europe Market Incremental $ Opportunity, 2025-2035
  • Figure 9: Eastern Europe Market Incremental $ Opportunity, 2025-2035
  • Figure 10: East Asia Market Incremental $ Opportunity, 2025-2035
  • Figure 11: South Asia and Pacific Market Incremental $ Opportunity, 2025-2035
  • Figure 12: Middle East & Africa Market Incremental $ Opportunity, 2025-2035
  • Figure 13: North America Market Value Share and BPS Analysis by Country, 2025 and 2035
  • Figure 14: Latin America Market Value Share and BPS Analysis by Country, 2025 and 2035
  • Figure 15: Western Europe Market Value Share and BPS Analysis by Country, 2025 and 2035
  • Figure 16: Eastern Europe Market Value Share and BPS Analysis by Country, 2025 and 2035
  • Figure 17: East Asia Market Value Share and BPS Analysis by Country, 2025 and 2035
  • Figure 18: South Asia and Pacific Market Value Share and BPS Analysis by Country, 2025 and 2035
  • Figure 19: Middle East & Africa Market Value Share and BPS Analysis by Country, 2025 and 2035
  • Figure 20: Global Market - Tier Structure Analysis
  • Figure 21: Global Market - Company Share Analysis

Frequently Asked Questions

How big is the occupancy sensor market in 2025?

The global occupancy sensor market is estimated to be valued at USD 3.0 billion in 2025.

What will be the market size for the occupancy sensor market in 2035?

It is projected to reach USD 9.2 billion by 2035.

How much will be the CAGR of the occupancy sensor market between 2025 and 2035?

The market is expected to grow at a 12.0% CAGR between 2025 and 2035.

What are the key product types in the occupancy sensor market?

The key product types are wireless network occupancy sensor, wired network occupancy sensor, _wi-fi, _zigbee, _z-wave and _others.

Which occupancy sensor for commercial applications segment is expected to dominate the occupancy sensor market in 2025?

occupancy sensor for commercial applications segment is expected to dominate with a 44.0% industry share in 2025.

Explore Similar Insights

Future Market Insights

Occupancy Sensor Market