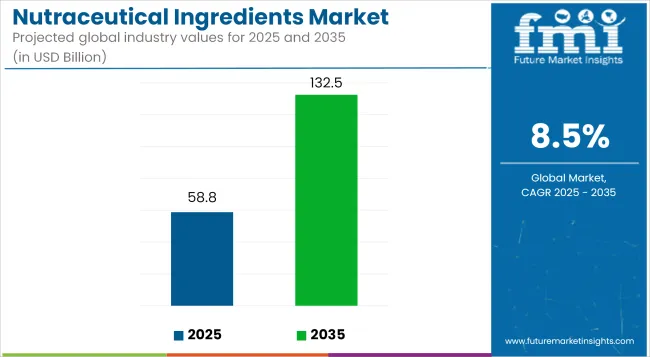
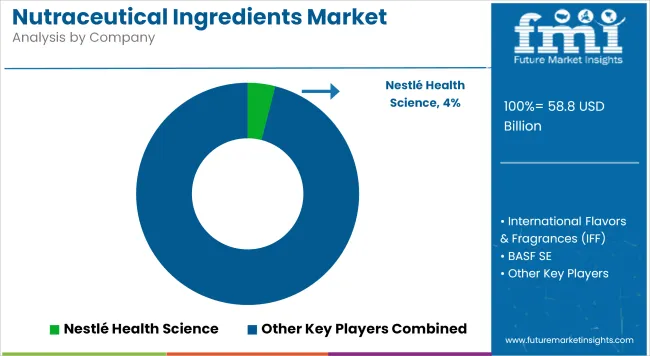
The nutraceutical ingredients market is expected to increase at an 8.3% CAGR from 2023 to 2033, from US$ 53.61 billion in 2023 to US$ 118.99 billion in 2033.
Nutraceutical Product Usage is on the Rise
Customers are more concerned about their health and prefer improving their health than paying unnecessary for treatment. Nutraceuticals are increasingly popular around the world, and the typical consumer is beginning to consume them daily. As people become less active, they experience digestive issues such as constipation, bloating, and indigestion. Consumers are usually asking for digestive health supplements to help with these medical issues.
The Organization for Economic Cooperation and Development (OECD) conducted a survey in the United States between 2020 and 2050. The percentage of health expenditure spent on overweight and related disorders is expected to account for 14% of health expenditure. Currently, product modifications are done in response to market trends.
Technological advancements and creativity enable manufacturers to offer functional and nutraceutical meals aimed at both general and specialized health issues. The global spread of COVID-19 encourages people to seek nutraceutical-based products. As it enhances their immune systems and keeps them fit and healthy. Using preventative healthcare measures, on the other hand, is significantly enhancing product sales in every location. Functional beverages are one of the fastest-growing segments, with significant development potential in developing economies. Consumer demand for improved water and ready-to-drink beverages is increasing in the functional beverage category.
Furthermore, the expanding working population and stressful lifestyle have harmed lifestyle-related disorders. Consequently, rising healthcare expenses and the benefits of preventative healthcare solutions have motivated consumers to take control of their health. This is done by arming themselves with health information and making informed purchases of nutraceuticals.
Report Attribute | Details |
---|---|
Nutraceutical Ingredients Market Value (2023) | US$ 53.61 billion |
Nutraceutical Ingredients Market Anticipated Value (2033) | US$ 118.99 billion |
Nutraceutical Ingredients Market Growth Rate (2023 to 2033) | 8.3% CAGR |
Don't pay for what you don't need
Customize your report by selecting specific countries or regions and save 30%!
The nutraceutical ingredients market accounted for US$ 49.50 billion in 2022, expanding at an 8% CAGR from 2018 to 2022.
Demand for nutraceutical items such as power gummies, which are chewable nutritional supplements with a variety of health advantages, is projected to be driven by innovation and new product development. Nutraceutical components are sourced from animal, plant, microbial, and synthetic sources. It provides health advantages by enhancing the primary nutritional content and functional benefits of food, drinks, dietary supplements, animal nutrition, and personal care products.
Because of their medical benefits in minimizing diseases and fostering improved health, nutraceutical substances are valuable in the pharmaceutical sector. For instance, cardiovascular illnesses are the biggest cause of death worldwide. It kills an estimated 17.9 million people each year, according to the World Health Organization.
As a result of escalating healthcare expenses and the benefits of preventative healthcare solutions, consumers are taking control of their health.
Historical CAGR (2018 to 2022) | 5.7% |
---|---|
Forecast CAGR (2023 to 2033) | 8.3% |
Most countries have identified lifestyle-related diseases as a huge problem. This has resulted in increased consumer awareness of healthy food products, boosting the market for nutritive products.
The aging population, rising life expectancy rates, and an increase in chronic disease cases have all contributed to changes in dietary habits. Fortified foods are the fastest-growing health and wellness food and beverage categories in the world. It is followed by naturally healthy and organic foods.
The practice of improving the nutritional value of food by adding nutrients such as proteins and minerals is referred to as food fortification. Leading institutions such as the WHO and the FAO of the United Nations regard food fortification as a critical instrument in the fight against global malnutrition.
Overall, the market for food fortification is increasing as a result of strong organizational support. Many developing and rising countries are taking it a step further and requiring food fortification. This has resulted in a significant increase in the expansion of the fortified foods market in various countries.
Several governmental and non-governmental organizations must work together with food producers. To prepare food in such a way that micronutrient shortages are eventually addressed, triggering a global campaign to combat hidden hunger. Micronutrients can be added to basic foods such as rice, oil, wheat, or maize flour as well as condiments such as salt, for a very cheap cost. Food fortification is thus a low-cost innovation with long-term human capital and economic benefits.
As part of broader national initiatives to avoid chronic undernutrition, food fortification is one of the cost-effective and dependable investment choices. The key reason driving the expansion of fortified foods is an increase in consumer health consciousness. Individuals across the world are changing their lifestyles because it benefits them in the long run. This boosts their immune systems and decreases their susceptibility to sickness.
Consumers, on the other hand, no longer have the time or desire to create home-cooked meals as a result of changing lifestyles. As a result, individuals are more prone to prefer convenience meals. These foods are often highly processed and result in lower quantities of key nutrients than other forms of food after manufacture.
The price of a product might vary substantially depending on the origin of the ingredients (synthetic or natural) and the season. Synthetic components have cheaper production costs and do not require the management of natural sources from which functional principles are taken. Synthetic raw resources, on the other hand, cannot compete with natural raw materials in terms of quality.
Another element that can influence the final cost of your project is the bioavailability or seasonality of the raw ingredients in the product. Furthermore, natural components are not available all year, or their prices may rise for months these issues have an impact on the cost of producing a supplement.
Certain components are sensitive to changes in air, light, and temperature, necessitating product-specific packaging and forms. Those formats that deviate from normal packaging are typically more expensive. Employing proprietary ingredients instead of ordinary ones can increase manufacturing costs.
These goods ensure that the resulting compounds or strains are more effective than standard ingredients. Flora Glo (lutein) and BC30 (probiotic strain) are more expensive than normal components.
Food fortification raises food prices by raising production costs. Premixes and capital costs are two key costs associated with food fortification. Premix is a micronutrient blend that is used to fortify any dish. The former is associated with variable costs and is thus accounted for in price determination. Whereas the latter is associated with fixed costs and is thus not accounted for in the price of fortified food items.
During the pandemic, there was a surge in demand for food products containing health-improving additives or nutraceuticals. This prompted the nutraceutical business to offer tailored diets for each person's nutritional needs, supplementation, and dosage computation.
Many commercial options with significant growth potential can be explored by integrating traditional medicinal legacy, resources, and technological skills. Nationally, regulators are more concerned with nutrition.
Nutraceutical products can naturally support the drive because they are designed to cover the nutritional gap between what is absorbed through food and what is required for general health. A collaborative effort can help the nutraceutical industry, which is expected to grow by double digits. The convergence of multidisciplinary science is the future of nutraceuticals. Nutraceutical companies have leveraged significant investment as a result of technical innovation.
Get the data you need at a Fraction of the cost
Personalize your report by choosing insights you need
and save 40%!
In the nutraceutical industry, 3D printing techniques have given rise to novel business initiatives that use the technology to better nutraceutical medicine delivery. It enables the use of customizable ingredients in the production of products containing food ingredients that are specifically tailored to the consumer.
Personalization of 3D food printing can meet a nutritional demand linked with a restricted diet, potentially avoiding difficulties and hospitalization. Diabetes patients regularly consume sugar alternatives such as maltitol and xylitol. As a result, a complex blend of these artificial sweeteners and functional polysaccharides was used to generate a 3D-printed chocolate food product.
The latest technology is also used to give tailored dietary supplements. These customized supplements claim to deliver important nutrients on a timetable that is tailored to the individual's needs and daily routine.
Natural-source items with purported health benefits, such as nutraceuticals and dietary supplements, are widely available over the last two decades. These products have been challenging to characterize. Nutraceuticals, as opposed to dietary supplements, are dietary supplements that give health benefits. In addition, their fundamental nutritional value by improving diets and/or assisting in the prevention and/or treatment of diseases and disorders.
These products are often greeted with skepticism due to efficacy and safety concerns. This is due in part to the nutraceuticals industry's lack of regulation and oversight. Consumers and the industry trade community have expressed concern about unregistered and unapproved imitation or counterfeit items. Although the market for nutraceutical items such as nutritional supplements has lately surged, particularly for dietary supplements.
This category accounts for a massive proportion of non-nutritional supplement customers in both developing and developed countries. Furthermore, consumers regard nutraceuticals as medicines and are cautious to incorporate them into their usual meals. As a result of these considerations, some supplement producers are focusing on developing novel formulations. This includes gummies, soft chews, and others, to assuage consumers' concerns about utilizing tablets and capsules as nutraceuticals.
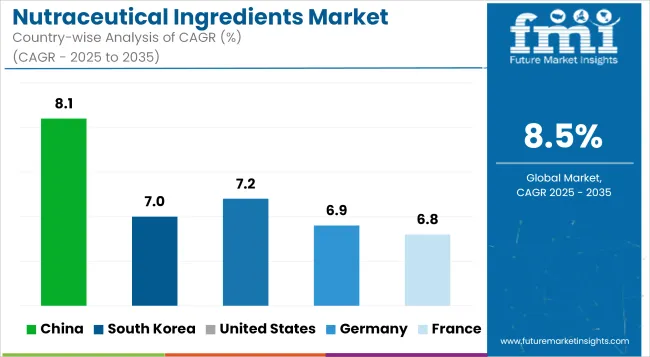
The Asia Pacific region dominates the market, with the highest expected growth rate over the forecast period. Japan leads the market for nutraceutical ingredients in Asia Pacific, followed by China and India. Increasing working hours and sedentary lifestyles have a negative influence on consumers' overall health and well-being, resulting in metabolic stress.
As a result, customers turned to nutraceuticals for self-care therapy. Consumers are seeking nutritional solutions as they become more aware of the importance of intestinal health. The economy is expected to improve in several places in the next years, with a rise in disposable income. This benefits the market because people tend to spend a significant portion of their income on health-related expenses.
Foods or nutraceuticals with gastrointestinal tract improvement-related health claims are the most common in Japan. Triglyceride reduction is the second-most common claim, behind cholesterol reduction.
According to the World Bank, Japan's healthcare expenditure accounted for 10.74% of the GDP in 2020. Placing it among the top countries in terms of health expenditure. These substances have achieved considerable success in the Japan market as a result of increased healthcare spending.
With the increased demand for nutraceutical goods with anti-aging qualities, North America has emerged as a market leader. North America maintains its dominance over the projection period due to the high prevalence of chronic and non-chronic diseases. Increased market advancements, and increased research and development initiatives undertaken by sizable firms.
Consumer demand for functional foods and dietary supplements is likely to fuel regional market expansion. Key food and beverage makers' increased spending in research and development operations for the advancement of nutraceutical ingredients. Thus it is expected to promote market growth during the forecast period.
Manufacturers choose dry nutraceutical components due to their better stability, ease of handling and storage, and versatility in a wide range of products. Manufacturers' worry about storage handling is one of the primary elements driving demand for dry ingredients. Because liquid substances are more unstable than dry ingredients.
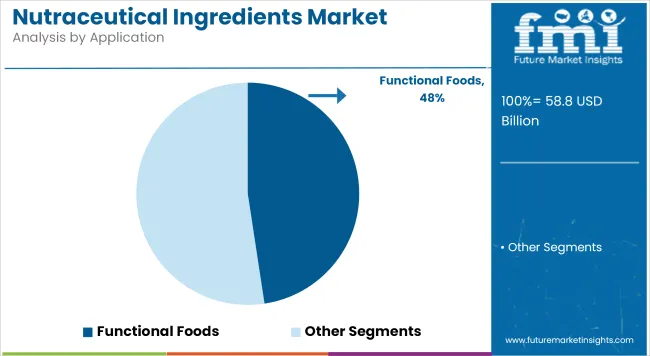
Due to its palatability, mouth feel, and texture, junk food consumption has surged dramatically over the last decade. Taking this into consideration, food manufacturers began developing items that can be a healthy option. The inclination for balanced diets and healthy food has stayed high as consumers have become more health-conscious and knowledgeable. This has broadened the applications for functional meals and offered attractive growth prospects for nutraceutical ingredient makers.
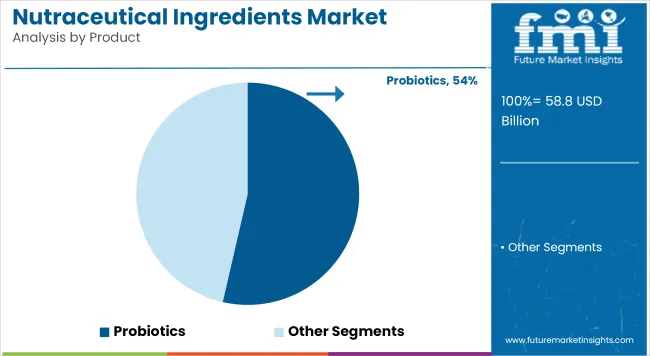
Probiotics are commonly used to help people balance their intestinal flora, also known as the gut microbiome. Probiotics have additional benefits such as enhancing gut microbiome health, restoring microbiome balance after sickness or therapy, and supporting the immune system. People are interested in probiotics because of their multiple benefits.
The primary players' dominant strategy was strategic collaborations, followed by expansions and new product releases. These tactics have assisted them in expanding their footprint in various geographies and industrial industries. These Market participants are working on expanding their footprint through partnerships and alliances. These companies have a strong presence in North America, Asia Pacific, and Europe. They also have manufacturing facilities and extensive distribution networks in these locations.
For example, in February 2023, ADM announced the establishment of a new production plant in Valencia, Spain. With a US$ 30 million investment to accelerate post- and probiotic production to meet a threefold increase in product demand over the following five years. The move allows ADM to scale its goods while increasing output by five times, resulting in 50 metric tonnes of capacity yearly. According to the business, it is the first facility in the world to produce postbiotics and probiotics under the same roof.
Attribute | Details |
---|---|
Market Size Value in 2023 | US$ 53.61 billion |
Market Size Value at End of Forecast (2033) | US$ 118.99 billion |
Market Analysis | US$ billion for Value |
Key Region Covered | North America; Europe; Asia Pacific; Latin America; The Middle East & Africa |
Key Segments | By Product, By Form, By Application, By Region |
Key Companies Profiled | BASF SE; ADM; Ingredion; DSM NV; Cargill; Tate & Lyle; Ajinomoto; Roquette Freres; Arla Food Ingredients; Divis Laboratories; Cosucra Groupe Warcoing SA; Prinova Group, LLC; Ambe Phytoextracts Pvt Ltd; Nutraland USA, Nutra Food Ingredients; Aurobindo Pharma Ltd; Associated British Foods Plc; Aurea Biolabs; Innophos (Nutragenesis, LLC); AVT Natural Products Ltd |
Report Coverage | Market Forecast, Company Share Analysis, Competition Intelligence, DROT Analysis, Market Dynamics and Challenges, and Strategic Growth Initiatives |
Customization & Pricing | Available upon Request |
The industry is valued at US$ 53.61 billion in 2023.
The market is estimated to secure a CAGR of 8.3%.
The market registered a CAGR of 8% from 2018 to 2022.
The market is estimated to reach US$ 118.99 billion by 2033.
The nutraceutical ingredients market accounted for US$ 49.50 billion in 2022.
1. Executive Summary | Nutraceutical Ingredients Market 1.1. Global Market Outlook 1.2. Demand-side Trends 1.3. Supply-side Trends 1.4. Technology Roadmap Analysis 1.5. Analysis and Recommendations 2. Market Overview 2.1. Market Coverage / Taxonomy 2.2. Market Definition / Scope / Limitations 3. Market Background 3.1. Market Dynamics 3.1.1. Drivers 3.1.2. Restraints 3.1.3. Opportunity 3.1.4. Trends 3.2. Scenario Forecast 3.2.1. Demand in Optimistic Scenario 3.2.2. Demand in Likely Scenario 3.2.3. Demand in Conservative Scenario 3.3. Opportunity Map Analysis 3.4. Product Life Cycle Analysis 3.5. Supply Chain Analysis 3.5.1. Supply Side Participants and their Roles 3.5.1.1. Producers 3.5.1.2. Mid-Level Participants (Traders/ Agents/ Brokers) 3.5.1.3. Wholesalers and Distributors 3.5.2. Value Added and Value Created at Node in the Supply Chain 3.5.3. List of Raw Material Suppliers 3.5.4. List of Existing and Potential Buyer’s 3.6. Investment Feasibility Matrix 3.7. Value Chain Analysis 3.7.1. Profit Margin Analysis 3.7.2. Wholesalers and Distributors 3.7.3. Retailers 3.8. PESTLE and Porter’s Analysis 3.9. Regulatory Landscape 3.9.1. By Key Regions 3.9.2. By Key Countries 3.10. Regional Parent Market Outlook 3.11. Production and Consumption Statistics 3.12. Import and Export Statistics 4. Global Market Analysis 2018 to 2022 and Forecast, 2023 to 2033 4.1. Historical Market Size Value (US$ Million) & Volume (MT) Analysis, 2018 to 2022 4.2. Current and Future Market Size Value (US$ Million) & Volume (MT) Projections, 2023 to 2033 4.2.1. Y-o-Y Growth Trend Analysis 4.2.2. Absolute $ Opportunity Analysis 5. Global Market Analysis 2018 to 2022 and Forecast 2023 to 2033, By Product Ingredients 5.1. Introduction / Key Findings 5.2. Historical Market Size Value (US$ Million) & Volume (MT) Analysis By Product Ingredients, 2018 to 2022 5.3. Current and Future Market Size Value (US$ Million) & Volume (MT) Analysis and Forecast By Product Ingredients, 2023 to 2033 5.3.1. Vitamins 5.3.2. Prebiotics and Probiotics 5.3.3. Proteins and Amino Acids 5.3.4. Omega Fatty 3 Acids 5.3.5. Minerals 5.3.6. Carotenoids 5.3.7. Fibers & Specialty Carbohydrates 5.3.8. Phytochemicals & Plant Extracts 5.3.9. Other Ingredients 5.4. Y-o-Y Growth Trend Analysis By Product Ingredients, 2018 to 2022 5.5. Absolute $ Opportunity Analysis By Product Ingredients, 2023 to 2033 6. Global Market Analysis 2018 to 2022 and Forecast 2023 to 2033, By Application 6.1. Introduction / Key Findings 6.2. Historical Market Size Value (US$ Million) & Volume (MT) Analysis By Application, 2018 to 2022 6.3. Current and Future Market Size Value (US$ Million) & Volume (MT) Analysis and Forecast By Application, 2023 to 2033 6.3.1. Functional Food 6.3.2. Functional Beverages 6.3.3. Dietary Supplements 6.3.4. Animal Feed 6.3.5. Others 6.4. Y-o-Y Growth Trend Analysis By Application, 2018 to 2022 6.5. Absolute $ Opportunity Analysis By Application, 2023 to 2033 7. Global Market Analysis 2018 to 2022 and Forecast 2023 to 2033, By Form 7.1. Introduction / Key Findings 7.2. Historical Market Size Value (US$ Million) & Volume (MT) Analysis By Form, 2018 to 2022 7.3. Current and Future Market Size Value (US$ Million) & Volume (MT) Analysis and Forecast By Form, 2023 to 2033 7.3.1. Dry 7.3.2. Liquid 7.4. Y-o-Y Growth Trend Analysis By Form, 2018 to 2022 7.5. Absolute $ Opportunity Analysis By Form, 2023 to 2033 8. Global Market Analysis 2018 to 2022 and Forecast 2023 to 2033, By Region 8.1. Introduction 8.2. Historical Market Size Value (US$ Million) & Volume (MT) Analysis By Region, 2018 to 2022 8.3. Current Market Size Value (US$ Million) & Volume (MT) Analysis and Forecast By Region, 2023 to 2033 8.3.1. North America 8.3.2. Latin America 8.3.3. Europe 8.3.4. Asia Pacific 8.3.5. MEA 8.4. Market Attractiveness Analysis By Region 9. North America Market Analysis 2018 to 2022 and Forecast 2023 to 2033, By Country 9.1. Historical Market Size Value (US$ Million) & Volume (MT) Trend Analysis By Market Taxonomy, 2018 to 2022 9.2. Market Size Value (US$ Million) & Volume (MT) Forecast By Market Taxonomy, 2023 to 2033 9.2.1. By Country 9.2.1.1. The USA 9.2.1.2. Canada 9.2.2. By Product Ingredients 9.2.3. By Application 9.2.4. By Form 9.3. Market Attractiveness Analysis 9.3.1. By Country 9.3.2. By Product Ingredients 9.3.3. By Application 9.3.4. By Form 9.4. Key Takeaways 10. Latin America Market Analysis 2018 to 2022 and Forecast 2023 to 2033, By Country 10.1. Historical Market Size Value (US$ Million) & Volume (MT) Trend Analysis By Market Taxonomy, 2018 to 2022 10.2. Market Size Value (US$ Million) & Volume (MT) Forecast By Market Taxonomy, 2023 to 2033 10.2.1. By Country 10.2.1.1. Brazil 10.2.1.2. Mexico 10.2.1.3. Rest of Latin America 10.2.2. By Product Ingredients 10.2.3. By Application 10.2.4. By Form 10.3. Market Attractiveness Analysis 10.3.1. By Country 10.3.2. By Product Ingredients 10.3.3. By Application 10.3.4. By Form 10.4. Key Takeaways 11. Europe Market Analysis 2018 to 2022 and Forecast 2023 to 2033, By Country 11.1. Historical Market Size Value (US$ Million) & Volume (MT) Trend Analysis By Market Taxonomy, 2018 to 2022 11.2. Market Size Value (US$ Million) & Volume (MT) Forecast By Market Taxonomy, 2023 to 2033 11.2.1. By Country 11.2.1.1. Germany 11.2.1.2. United Kingdom 11.2.1.3. France 11.2.1.4. Spain 11.2.1.5. Italy 11.2.1.6. Rest of Europe 11.2.2. By Product Ingredients 11.2.3. By Application 11.2.4. By Form 11.3. Market Attractiveness Analysis 11.3.1. By Country 11.3.2. By Product Ingredients 11.3.3. By Application 11.3.4. By Form 11.4. Key Takeaways 12. Asia Pacific Market Analysis 2018 to 2022 and Forecast 2023 to 2033, By Country 12.1. Historical Market Size Value (US$ Million) & Volume (MT) Trend Analysis By Market Taxonomy, 2018 to 2022 12.2. Market Size Value (US$ Million) & Volume (MT) Forecast By Market Taxonomy, 2023 to 2033 12.2.1. By Country 12.2.1.1. China 12.2.1.2. Japan 12.2.1.3. South Korea 12.2.1.4. Singapore 12.2.1.5. Thailand 12.2.1.6. Indonesia 12.2.1.7. Australia 12.2.1.8. New Zealand 12.2.1.9. Rest of Asia Pacific 12.2.2. By Product Ingredients 12.2.3. By Application 12.2.4. By Form 12.3. Market Attractiveness Analysis 12.3.1. By Country 12.3.2. By Product Ingredients 12.3.3. By Application 12.3.4. By Form 12.4. Key Takeaways 13. MEA Market Analysis 2018 to 2022 and Forecast 2023 to 2033, By Country 13.1. Historical Market Size Value (US$ Million) & Volume (MT) Trend Analysis By Market Taxonomy, 2018 to 2022 13.2. Market Size Value (US$ Million) & Volume (MT) Forecast By Market Taxonomy, 2023 to 2033 13.2.1. By Country 13.2.1.1. GCC Countries 13.2.1.2. South Africa 13.2.1.3. Israel 13.2.1.4. Rest of MEA 13.2.2. By Product Ingredients 13.2.3. By Application 13.2.4. By Form 13.3. Market Attractiveness Analysis 13.3.1. By Country 13.3.2. By Product Ingredients 13.3.3. By Application 13.3.4. By Form 13.4. Key Takeaways 14. Key Countries Market Analysis 14.1. USA 14.1.1. Pricing Analysis 14.1.2. Market Share Analysis, 2022 14.1.2.1. By Product Ingredients 14.1.2.2. By Application 14.1.2.3. By Form 14.2. Canada 14.2.1. Pricing Analysis 14.2.2. Market Share Analysis, 2022 14.2.2.1. By Product Ingredients 14.2.2.2. By Application 14.2.2.3. By Form 14.3. Brazil 14.3.1. Pricing Analysis 14.3.2. Market Share Analysis, 2022 14.3.2.1. By Product Ingredients 14.3.2.2. By Application 14.3.2.3. By Form 14.4. Mexico 14.4.1. Pricing Analysis 14.4.2. Market Share Analysis, 2022 14.4.2.1. By Product Ingredients 14.4.2.2. By Application 14.4.2.3. By Form 14.5. Germany 14.5.1. Pricing Analysis 14.5.2. Market Share Analysis, 2022 14.5.2.1. By Product Ingredients 14.5.2.2. By Application 14.5.2.3. By Form 14.6. United Kingdom 14.6.1. Pricing Analysis 14.6.2. Market Share Analysis, 2022 14.6.2.1. By Product Ingredients 14.6.2.2. By Application 14.6.2.3. By Form 14.7. France 14.7.1. Pricing Analysis 14.7.2. Market Share Analysis, 2022 14.7.2.1. By Product Ingredients 14.7.2.2. By Application 14.7.2.3. By Form 14.8. Spain 14.8.1. Pricing Analysis 14.8.2. Market Share Analysis, 2022 14.8.2.1. By Product Ingredients 14.8.2.2. By Application 14.8.2.3. By Form 14.9. Italy 14.9.1. Pricing Analysis 14.9.2. Market Share Analysis, 2022 14.9.2.1. By Product Ingredients 14.9.2.2. By Application 14.9.2.3. By Form 14.10. China 14.10.1. Pricing Analysis 14.10.2. Market Share Analysis, 2022 14.10.2.1. By Product Ingredients 14.10.2.2. By Application 14.10.2.3. By Form 14.11. Japan 14.11.1. Pricing Analysis 14.11.2. Market Share Analysis, 2022 14.11.2.1. By Product Ingredients 14.11.2.2. By Application 14.11.2.3. By Form 14.12. South Korea 14.12.1. Pricing Analysis 14.12.2. Market Share Analysis, 2022 14.12.2.1. By Product Ingredients 14.12.2.2. By Application 14.12.2.3. By Form 14.13. Singapore 14.13.1. Pricing Analysis 14.13.2. Market Share Analysis, 2022 14.13.2.1. By Product Ingredients 14.13.2.2. By Application 14.13.2.3. By Form 14.14. Thailand 14.14.1. Pricing Analysis 14.14.2. Market Share Analysis, 2022 14.14.2.1. By Product Ingredients 14.14.2.2. By Application 14.14.2.3. By Form 14.15. Indonesia 14.15.1. Pricing Analysis 14.15.2. Market Share Analysis, 2022 14.15.2.1. By Product Ingredients 14.15.2.2. By Application 14.15.2.3. By Form 14.16. Australia 14.16.1. Pricing Analysis 14.16.2. Market Share Analysis, 2022 14.16.2.1. By Product Ingredients 14.16.2.2. By Application 14.16.2.3. By Form 14.17. New Zealand 14.17.1. Pricing Analysis 14.17.2. Market Share Analysis, 2022 14.17.2.1. By Product Ingredients 14.17.2.2. By Application 14.17.2.3. By Form 14.18. GCC Countries 14.18.1. Pricing Analysis 14.18.2. Market Share Analysis, 2022 14.18.2.1. By Product Ingredients 14.18.2.2. By Application 14.18.2.3. By Form 14.19. South Africa 14.19.1. Pricing Analysis 14.19.2. Market Share Analysis, 2022 14.19.2.1. By Product Ingredients 14.19.2.2. By Application 14.19.2.3. By Form 14.20. Israel 14.20.1. Pricing Analysis 14.20.2. Market Share Analysis, 2022 14.20.2.1. By Product Ingredients 14.20.2.2. By Application 14.20.2.3. By Form 15. Market Structure Analysis 15.1. Competition Dashboard 15.2. Competition Benchmarking 15.3. Market Share Analysis of Top Players 15.3.1. By Regional 15.3.2. By Product Ingredients 15.3.3. By Application 15.3.4. By Form 16. Competition Analysis 16.1. Competition Deep Dive 16.1.1. BASF SE 16.1.1.1. Overview 16.1.1.2. Product Portfolio 16.1.1.3. Profitability by Market Segments 16.1.1.4. Sales Footprint 16.1.1.5. Strategy Overview 16.1.1.5.1. Marketing Strategy 16.1.1.5.2. Product Strategy 16.1.1.5.3. Channel Strategy 16.1.2. Nutra Food Ingredients 16.1.2.1. Overview 16.1.2.2. Product Portfolio 16.1.2.3. Profitability by Market Segments 16.1.2.4. Sales Footprint 16.1.2.5. Strategy Overview 16.1.2.5.1. Marketing Strategy 16.1.2.5.2. Product Strategy 16.1.2.5.3. Channel Strategy 16.1.3. Cargill Inc. 16.1.3.1. Overview 16.1.3.2. Product Portfolio 16.1.3.3. Profitability by Market Segments 16.1.3.4. Sales Footprint 16.1.3.5. Strategy Overview 16.1.3.5.1. Marketing Strategy 16.1.3.5.2. Product Strategy 16.1.3.5.3. Channel Strategy 16.1.4. Archer Daniels Midland Company 16.1.4.1. Overview 16.1.4.2. Product Portfolio 16.1.4.3. Profitability by Market Segments 16.1.4.4. Sales Footprint 16.1.4.5. Strategy Overview 16.1.4.5.1. Marketing Strategy 16.1.4.5.2. Product Strategy 16.1.4.5.3. Channel Strategy 16.1.5. DSM Nutritional Products 16.1.5.1. Overview 16.1.5.2. Product Portfolio 16.1.5.3. Profitability by Market Segments 16.1.5.4. Sales Footprint 16.1.5.5. Strategy Overview 16.1.5.5.1. Marketing Strategy 16.1.5.5.2. Product Strategy 16.1.5.5.3. Channel Strategy 16.1.6. Ingredion Incorporated 16.1.6.1. Overview 16.1.6.2. Product Portfolio 16.1.6.3. Profitability by Market Segments 16.1.6.4. Sales Footprint 16.1.6.5. Strategy Overview 16.1.6.5.1. Marketing Strategy 16.1.6.5.2. Product Strategy 16.1.6.5.3. Channel Strategy 16.1.7. Tate & Lyle Plc 16.1.7.1. Overview 16.1.7.2. Product Portfolio 16.1.7.3. Profitability by Market Segments 16.1.7.4. Sales Footprint 16.1.7.5. Strategy Overview 16.1.7.5.1. Marketing Strategy 16.1.7.5.2. Product Strategy 16.1.7.5.3. Channel Strategy 16.1.8. Ajinomoto Co. Inc. 16.1.8.1. Overview 16.1.8.2. Product Portfolio 16.1.8.3. Profitability by Market Segments 16.1.8.4. Sales Footprint 16.1.8.5. Strategy Overview 16.1.8.5.1. Marketing Strategy 16.1.8.5.2. Product Strategy 16.1.8.5.3. Channel Strategy 16.1.9. FMC Corporation 16.1.9.1. Overview 16.1.9.2. Product Portfolio 16.1.9.3. Profitability by Market Segments 16.1.9.4. Sales Footprint 16.1.9.5. Strategy Overview 16.1.9.5.1. Marketing Strategy 16.1.9.5.2. Product Strategy 16.1.9.5.3. Channel Strategy 16.1.10. Prinova Group, LLC 16.1.10.1. Overview 16.1.10.2. Product Portfolio 16.1.10.3. Profitability by Market Segments 16.1.10.4. Sales Footprint 16.1.10.5. Strategy Overview 16.1.10.5.1. Marketing Strategy 16.1.10.5.2. Product Strategy 16.1.10.5.3. Channel Strategy 17. Assumptions & Acronyms Used 18. Research Methodology
Explore Food and Beverage Insights
View Reports