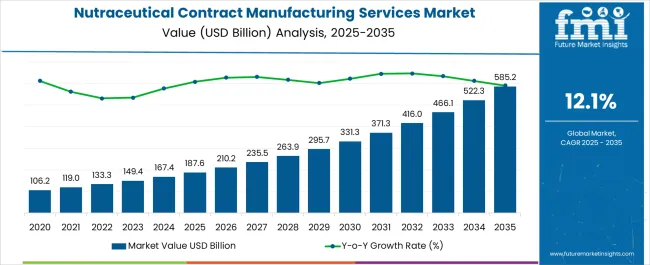
The Nutraceutical Contract Manufacturing Services Market is estimated to be valued at USD 187.6 billion in 2025 and is projected to reach USD 585.2 billion by 2035, registering a compound annual growth rate (CAGR) of 12.1% over the forecast period.

| Metric | Value |
|---|---|
| Nutraceutical Contract Manufacturing Services Market Estimated Value in (2025 E) | USD 187.6 billion |
| Nutraceutical Contract Manufacturing Services Market Forecast Value in (2035 F) | USD 585.2 billion |
| Forecast CAGR (2025 to 2035) | 12.1% |
The nutraceutical contract manufacturing services market is expanding steadily as demand for dietary supplements, functional foods, and wellness-driven products continues to rise globally. Increased consumer focus on preventive healthcare and lifestyle management has prompted brands to outsource production to specialized manufacturers offering scalability, compliance, and cost efficiency.
Regulatory frameworks emphasizing product quality, safety, and labeling standards have further encouraged companies to collaborate with experienced contract manufacturers who possess advanced facilities and certifications. Additionally, investments in innovative delivery formats, bioavailability enhancement, and customized formulations are reshaping market dynamics.
The outlook remains favorable as nutraceutical firms increasingly leverage contract partners to accelerate time to market, reduce operational risks, and meet the evolving expectations of health-conscious consumers across diverse geographies.

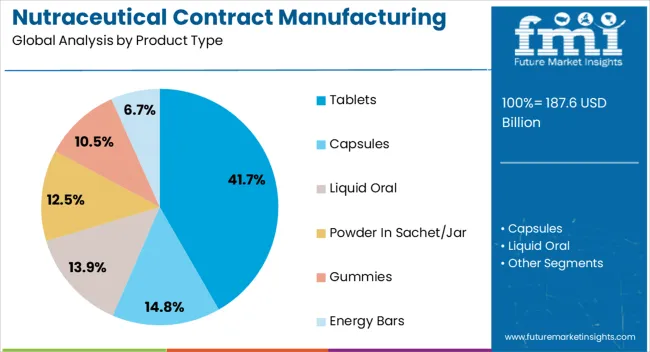
The tablets segment is projected to represent 41.70% of total revenue by 2025 within the product type category, positioning it as the leading sub segment. Growth in this segment is supported by the convenience of consumption, extended shelf life, and cost efficiency in large scale manufacturing.
Tablets are widely preferred due to their dosage accuracy, stability, and ability to accommodate multiple active ingredients in a single unit. Their compatibility with innovative technologies such as controlled release and film coating has enhanced their consumer acceptance.
As demand for standardized and reliable nutraceutical products continues to rise, tablets remain the dominant product type due to their versatility, affordability, and manufacturing efficiency.

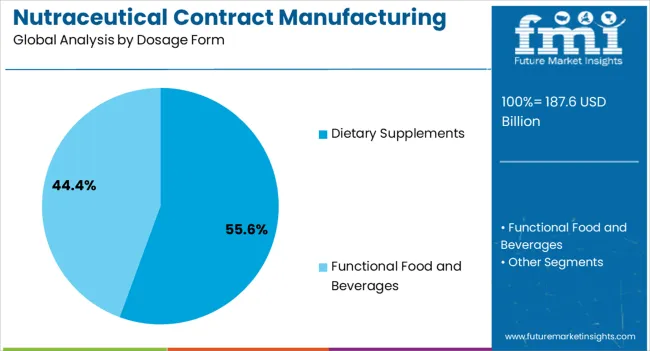
The dietary supplements segment is expected to hold 55.60% of the total revenue by 2025 within the dosage form category, establishing itself as the most significant contributor. This dominance is driven by increasing consumer inclination toward preventive health, immune support, and lifestyle management through supplement intake.
Contract manufacturers have focused on offering a wide variety of supplement formats, backed by quality assurance and regulatory compliance, to cater to diverse market demands. The growing global prevalence of chronic conditions and aging populations has further accelerated adoption.
In addition, strong retail and e commerce penetration has supported the rapid expansion of dietary supplements. These factors collectively reinforce dietary supplements as the largest and fastest growing dosage form in the nutraceutical contract manufacturing services market.
According to the report published on nutraceutical contract manufacturing services market, the deployment of these services is rising every year. In 2020, the global market size stood at nearly USD 106.2 billion. In the following years from 2020 to 2025, the market showcased remarkable growth, accounting for a worth of USD 133.34 billion.
The increasing chronic diseases and expanding geriatric population are expected to the key factors driving market growth. The growing demand for nutraceuticals by the geriatric population is accelerating market expansion. Furthermore, the demand for customized medicine is rising. Due to the increasing prevalence of chronic diseases, experts are formulating medicine that give the best results on consumption. The growing awareness for herbal and organic nutraceuticals is expected to increase nutraceutical contract manufacturing services adoption.
The adoption of innovative production strategies is anticipated to create growth avenues for market players. Additionally, the expansion of production capabilities is predicted to uptick market expansion. For instance, Star Combo Pharma announced its facility expansion in June 2025. The renowned distributer and manufacturer of nutritional, beauty, and health products inaugurated their new manufacturing facility in New South Wales, Australia.
Functional Foods and Beverages Segment to Register a Noteworthy CAGR
According to the segmentation based on product type, the market is bifurcated into functional foods & beverages, and dietary supplements. The functional food and beverages segment is predicted to register a remarkable CAGR of 12.2% from 2025 to 2035. Functional foods and beverages serve several health advantages. The growing awareness for these advantages is anticipated to fuel their consumption in coming years. The rising demand is anticipated to increase contract manufacturing services in nutraceutical industry.
The coronavirus pandemic gave a significant push to the consumption of functional beverages and foods. Nations such as India, Japan, China, and South Korea have witnessed an increased consumption of functional foods post-pandemic.
Tablets Segment to Retain Dominance in Global Market
According to the segmentation based on dosage type, the market is classified into powder in sachet/jar, energy bars, gummies, liquid oral, capsules, and tablets. Among these, the tablets segment is anticipated to garner prominent revenues in the global market. The dominance of this segment can be attributed to several factors. Tablets are easy to manufacture and have a long shelf life. They can be customized using different sizes, shapes, and coatings according to requirement. Hence, launches of nutraceutical tablets is anticipated to aid market development. In November 2024, Nature’s Sunshine Products collaborated with Nutraceutical Sciences Institute to launch a new line of immunity-supporting supplements. The new range comprises elderberry pills and candies.
Asia Pacific generated revenues greater than any region in 2025. The region accounted for more than 40% global market share in 2025. The robust demand from nations such as Australia, South Korea, India, and Japan is attributable to this growth. The improving healthcare infrastructure in these nations is resulting in increased demand for nutraceuticals. The numbers of nutraceutical contract manufacturing service providers are rising in these, fostering market development. The growing consciousness for healthy lifestyles and improving income levels support market development.
The presence of renowned manufacturers in Asia Pacific is likely to contribute to market growth. Players such as Gemini Pharmaceuticals, NUTRIVO, and Ashland comprise in Asia Pacific. The innovative strategies adopted by these players is predicted to boost market development in the region.
The healthcare industry in the United States is mature and advance. It is anticipated to hold a significant share in the market. The increasing prevalence of chronic diseases and expanding food and beverage industry are expected to flourish in market growth. Additionally, the rising acquisitions and collaborations among market players are anticipated to bolster market development. For instance, in August 2024, First Choice ingredients was acquired by Royal DSM. The acquisition is aimed to fulfil the region’s unmet medical requirements. The acquisition is likely to boost economic development and increase scientific research.
The nutraceutical contract manufacturing services market is fairly fragmented. The market comprises players that operate at regional and international levels. The market players are trying to penetrate new territories by forming new partnerships and acquiring businesses. They are emphasizing on expanding their distribution channels with agreements through nutraceutical contract manufacturing services.
The rising use of contemporary technologies and the expanding healthcare infrastructure are expected to create new investment pockets for market players. The launch of nutraceutical using advanced production methods is anticipated to boost positions of market players. Strategic alliances are expected to bode well for market players. Furthermore, more product approvals are expected to bode well for market players.
The global nutraceutical contract manufacturing services market is estimated to be valued at USD 187.6 billion in 2025.
The market size for the nutraceutical contract manufacturing services market is projected to reach USD 585.2 billion by 2035.
The nutraceutical contract manufacturing services market is expected to grow at a 12.1% CAGR between 2025 and 2035.
The key product types in nutraceutical contract manufacturing services market are tablets, capsules, liquid oral, powder in sachet/jar, gummies and energy bars.
In terms of dosage form, dietary supplements segment to command 55.6% share in the nutraceutical contract manufacturing services market in 2025.


Full Research Suite comprises of:
Market outlook & trends analysis
Interviews & case studies
Strategic recommendations
Vendor profiles & capabilities analysis
5-year forecasts
8 regions and 60+ country-level data splits
Market segment data splits
12 months of continuous data updates
DELIVERED AS:
PDF EXCEL ONLINE
Nutraceutical Packaging Market Size and Share Forecast Outlook 2025 to 2035
Nutraceutical CDMO Market Size and Share Forecast Outlook 2025 to 2035
Nutraceutical Excipients Market Analysis - Size, Share, and Forecast Outlook 2025 to 2035
Nutraceutical Gummies Market Analysis - Size, Share, and Forecast 2025 to 2035
Nutraceutical Actives Market Analysis - Size, Share, and Forecast Outlook 2025 to 2035
Nutraceutical Rigid Packaging Market Analysis - Size, Share, and Forecast Outlook 2025 to 2035
Nutraceuticals Market Size, Growth, and Forecast for 2025 to 2035
Nutraceutical Ingredients Market Analysis by Product, Form, Application and Region through 2035
Key Companies & Market Share in Nutraceutical Packaging Sector
Nutraceutical Flexible Packaging Market
Halal Nutraceuticals and Vaccines Market Growth - Trends & Forecast 2025 to 2035
Marine Nutraceutical Market Size and Share Forecast Outlook 2025 to 2035
Herbal Nutraceuticals Market Size and Share Forecast Outlook 2025 to 2035
Asia Pacific Nutraceutical Market Size and Share Forecast Outlook 2025 to 2035
MENA Nutraceuticals Market Trends – Dietary Supplements & Functional Foods
Contract Logistics Market Size and Share Forecast Outlook 2025 to 2035
Contract Furniture Market Analysis by Product Type, End-users, Distribution Channel, and Region from 2025 to 2035.
Contract Lifecycle Management Market Growth – Trends & Forecast 2025 to 2035
Contract Management Software Market Analysis By Solution, By Enterprise Size, By Business Function and Industry Through 2035
Contract Packaging Market from 2025 to 2035

Thank you!
You will receive an email from our Business Development Manager. Please be sure to check your SPAM/JUNK folder too.
Chat With
MaRIA