Non-Dairy Yogurt Market Forecast and Outlook 2025 to 2035

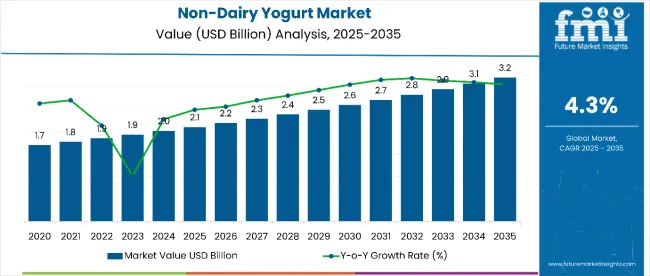
The global non-dairy yogurt market is projected to grow from USD 2.1 billion in 2025 to approximately USD 3.2 billion by 2035, recording an absolute increase of USD 1.1 billion over the forecast period. This translates into a total growth of 52.4%, with the market forecast to expand at a compound annual growth rate (CAGR) of 4.3% between 2025 and 2035.

Quick Stats for Non-Dairy Yogurt Market

  • Non-Dairy Yogurt Market Value (2025): USD 2.1 billion
  • Non-Dairy Yogurt Market Forecast Value (2035): USD 3.2 billion
  • Non-Dairy Yogurt Market Forecast CAGR: 4.3%
  • Leading Form in Non-Dairy Yogurt Market: Spoonable (57%)
  • Key Growth Regions in Non-Dairy Yogurt Market: North America, Western Europe, and East Asia
  • Top Key Players in Non-Dairy Yogurt Market: General Mills, Danone, Nestlé, Chobani, The Hain Celestial Group, Forager Project, Valio, Stonyfield Farm, Daiya Foods, Springfield Creamery

The overall market size is expected to grow by nearly 1.52X during the same period, supported by increasing consumer awareness about plant-based diets, rising demand for dairy alternatives, and growing focus on lactose-free and allergen-free products.

Between 2025 and 2030, the non-dairy yogurt market is projected to expand from USD 2.1 billion to USD 2.7 billion, resulting in a value increase of USD 0.6 billion, which represents 54.5% of the total forecast growth for the decade. This phase of growth will be shaped by rising consumer awareness about plant-based nutrition benefits, increasing demand for sustainable and environmentally friendly food options, and growing penetration of premium non-dairy products in emerging markets. Food and beverage brands are expanding their non-dairy product portfolios to address the growing demand for multifunctional plant-based solutions.
Non Dairy Yogurt Market

Non-Dairy Yogurt Market Key Takeaways

Metric Value
Estimated Value in (2025E) USD 2.1 billion
Forecast Value in (2035F) USD 3.2 billion
Forecast CAGR (2025 to 2035) 4.3%

From 2030 to 2035, the market is forecast to grow from USD 2.7 billion to USD 3.2 billion, adding another USD 0.5 billion, which constitutes 45.5% of the overall ten-year expansion. This period is expected to be characterized by expansion of online retail channels, integration of advanced fermentation technologies in formulations, and development of personalized nutrition solutions. The growing adoption of clean label trends and health-conscious consumer preferences will drive demand for premium non-dairy yogurt products with enhanced probiotic benefits and improved taste profiles.

Between 2020 and 2025, the non-dairy yogurt market experienced robust expansion, driven by increasing consumer focus on plant-based diets and growing awareness of lactose intolerance and dairy allergies. The market developed as food brands recognized the need for effective dairy alternatives to address health concerns, environmental sustainability, and ethical consumption. Social media influence and nutritionist recommendations began emphasizing the importance of plant-based proteins in daily dietary routines for maintaining digestive health and overall wellness.

Why is the Non-Dairy Yogurt Market Growing?

Market expansion is being supported by the increasing consumer awareness about the health benefits of plant-based diets and the corresponding demand for effective dairy alternatives. Modern consumers are increasingly focused on dietary choices that can address lactose intolerance, reduce environmental impact, and support sustainable food systems. Non-dairy yogurt's proven benefits in providing probiotics, plant proteins, and digestive support makes it a preferred choice in health-conscious dietary formulations.

The growing emphasis on clean label and natural ingredients is driving demand for non-dairy yogurt products derived from organic sources such as almonds, oats, and coconuts. Consumer preference for multifunctional products that combine probiotic benefits with nutritional value and taste satisfaction is creating opportunities for innovative formulations. The rising influence of social media wellness trends and nutritionist recommendations is also contributing to increased product adoption across different age groups and dietary preferences.

Segmental Analysis

The market is segmented by source, nature, sales channel, flavor, form, and region. By source, the market is divided into soy, almond, coconut, oat, rice, pea, and others. Based on nature, the market is categorized into organic and conventional. In terms of sales channel, the market is segmented into B2B (HoReCa & other food services) and B2C (modern grocery retailers, hypermarkets/supermarkets, convenience stores, specialty stores, online retailers, wholesalers, other retail forms).

By flavor, the market is divided into plain/unflavored and flavored. By form, the market is classified into drinkable and spoonable. Regionally, the market is divided into North America, Latin America, Western Europe, Eastern Europe, Balkans & Baltic, Russia & Belarus, Central Asia, East Asia, South Asia & Pacific, and Middle East & Africa.
By Form, Spoonable Segment Accounts for 57% Market Share

Non Dairy Yogurt Market Analysis By Farm

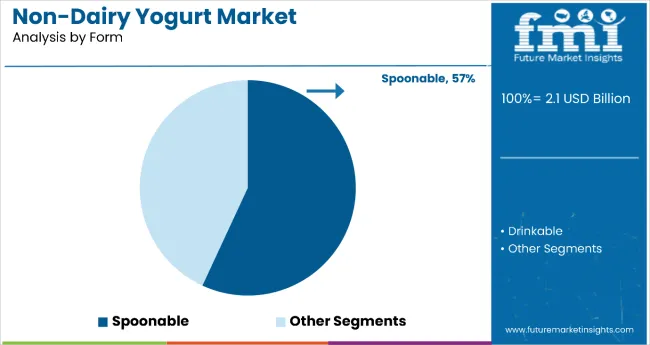
The spoonable form is projected to account for 57% of the non-dairy yogurt market in 2025, reaffirming its position as the category's preferred format. Consumers increasingly favor spoonable varieties for their traditional yogurt experience and versatility in consumption patterns. Spoonable non-dairy yogurt's familiar format provides consumers with customizable portion control and compatibility with various food pairings such as granola, fruits, and nuts, making them particularly appealing for breakfast and snack applications.

This segment forms the foundation of most product positioning, as it represents the most recognizable and consumer-friendly format of non-dairy yogurt consumption. Retailer preferences and shelf visibility continue to strengthen the dominance of spoonable varieties in traditional retail settings. With consumer eating habits maintaining preference for traditional yogurt consumption experiences, spoonable format aligns with both convenience and familiar usage patterns. Its broad appeal across demographics ensures sustained dominance, making it the central growth driver of non-dairy yogurt market demand.
By Sales Channel, B2C Segment Accounts for 68% Market Share

Non Dairy Yogurt Market Analysis By Sales Channel

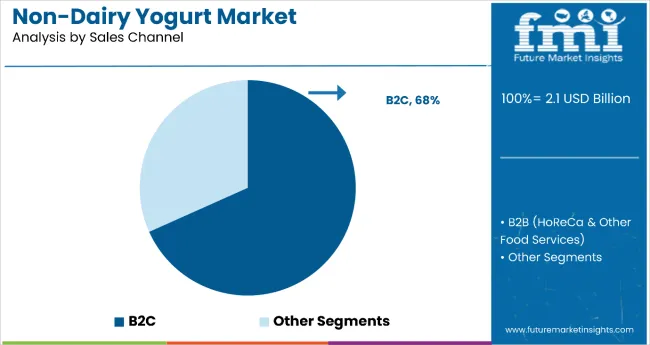
B2C channels are projected to represent 68% of non-dairy yogurt market demand in 2025, underscoring their role as the preferred distribution method for reaching end consumers. Consumers gravitate toward B2C channels for their accessibility, product variety, and ability to compare different brands and formulations, maximizing the reach of non-dairy yogurt products. Positioned as convenient shopping destinations, B2C channels offer both traditional retail benefits, such as physical product examination, and modern conveniences, including online ordering and home delivery.

The segment is supported by the rising popularity of modern grocery retail and online shopping platforms, where non-dairy yogurt products play a central role in health and wellness categories. Additionally, retailers are increasingly dedicating shelf space to plant-based alternatives like non-dairy yogurt, often positioning them alongside traditional dairy products, enhancing accessibility and justifying premium price points. As health-conscious consumers prioritize convenience and product variety, B2C channels will continue to dominate distribution, reinforcing their essential positioning within the non-dairy yogurt market ecosystem.

What are the Drivers, Restraints, and Key Trends of the Non-Dairy Yogurt Market?

The non-dairy yogurt market is advancing rapidly due to increasing consumer awareness about plant-based nutrition and growing demand for dairy-free alternatives. However, the market faces challenges including higher production costs compared to dairy yogurt, raw material price volatility, and taste and texture preferences that favor traditional dairy products. Innovation in fermentation technologies and sustainable ingredient sourcing continue to influence product development and market expansion patterns.

Expansion of E-commerce and Direct-to-Consumer Channels

The growing adoption of e-commerce platforms is enabling brands to reach consumers directly and provide personalized nutrition recommendations. Online channels offer convenience, detailed nutritional information, and customer reviews that influence purchasing decisions. Social media marketing and influencer partnerships are driving brand awareness and product adoption, particularly among younger demographics who prefer online shopping experiences and value plant-based lifestyle choices.

Integration of Advanced Fermentation Technologies and Probiotic Formulations

Modern non-dairy yogurt manufacturers are incorporating advanced fermentation systems such as plant-based cultures, enhanced probiotic strains, and improved stabilization technologies to enhance product quality and nutritional benefits. These technologies improve the taste and texture of non-dairy alternatives while extending product shelf life and providing better digestive health benefits. Advanced formulation techniques also enable combination products that deliver multiple nutritional benefits in single servings.
Analysis of Non-Dairy Yogurt Market by Key Country

Non Dairy Yogurt Market Country Wise Analysis

Country CAGR (2025 to 2035)
India 5.3%
China 5.1%
South Korea 4.9%
Australia 4.8%
Japan 4.6%
Canada 4.5%
Germany 4.2%

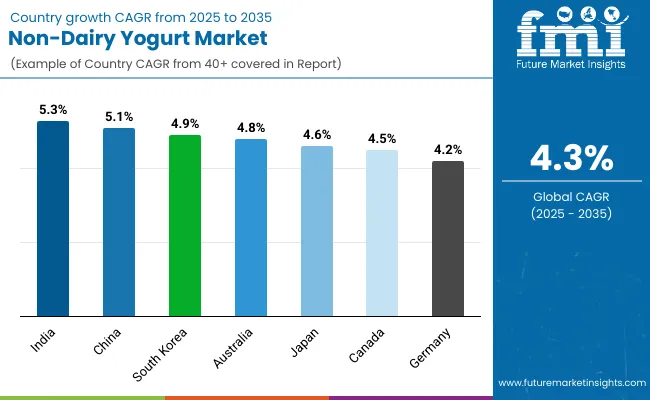
The non-dairy yogurt market is experiencing robust growth globally, with India leading at a 5.3% CAGR through 2035, driven by high lactose intolerance rates, growing health consciousness, and increasing penetration of plant-based food brands. China follows closely at 5.1%, supported by strong e-commerce infrastructure, urbanization trends, and increasing demand for health-oriented food products.

South Korea shows steady growth at 4.9%, emphasizing premium quality formulations and advanced food innovation technologies. Australia records 4.8%, focusing on environmental awareness and premium plant-based products. Japan shows 4.6% growth, prioritizing traditional fermentation expertise and health-focused consumer preferences. Canada demonstrates 4.5% growth, emphasizing government support for plant-based foods and clean label manufacturing practices. Germany demonstrates 4.2% growth, emphasizing organic ingredients and clean label manufacturing practices.

The report covers an in-depth analysis of 40+ countries; seven top-performing countries are highlighted below.

China Leads Asian Market Growth with E-commerce Innovation

Revenue from non-dairy yogurt in China is projected to exhibit strong growth with a CAGR of 5.1% through 2035, driven by rapid adoption of plant-based diets among younger consumers and increasing influence of health and wellness trends. The country's expanding middle class and growing awareness of lactose intolerance are creating significant demand for premium non-dairy alternatives. Major international and domestic food brands are establishing comprehensive distribution networks to serve the growing population of health-conscious consumers across tier-1 and tier-2 cities.

  • Government support for food innovation and quality standards is driving demand for certified and safe plant-based products throughout major metropolitan areas.
  • E-commerce platform growth and social media marketing are supporting rapid product adoption and brand awareness among health-focused consumers nationwide.

India Demonstrates Exceptional Market Potential with Cultural Alignment

Revenue from non-dairy yogurt in India is expanding at a CAGR of 5.1%, supported by cultural familiarity with plant-based diets, high lactose intolerance rates, and rising health consciousness. The country's young demographic profile and increasing exposure to global nutrition trends are driving demand for effective dairy alternatives. International food brands and domestic manufacturers are establishing distribution channels to serve the growing demand for affordable and nutritious plant-based products.

  • Rising awareness about digestive health and environmental sustainability is creating opportunities for specialized non-dairy products across urban and semi-urban markets.
  • Growing influence of health influencers and digital platforms is driving product education and adoption among consumers seeking traditional yet modern food solutions.

United States Focuses on Premium Formulations and Clean Label

Demand for non-dairy yogurt in the USA is projected to grow at a CAGR of 4.0%, supported by consumer preference for plant-based products and health-focused dietary choices. American consumers are increasingly focused on ingredient transparency, nutritional benefits, and sustainable food practices. The market is characterized by strong demand for premium formulations that combine multiple plant proteins with enhanced probiotic benefits.

  • Clean label movement and organic ingredient preference are driving demand for non-dairy products derived from sustainable and traceable sources throughout retail channels.
  • Health professional recommendations and clinical studies are supporting product credibility and consumer confidence in plant-based yogurt nutrition and digestive benefits.

South Korea Maintains Leadership with Advanced Food Technology

Revenue from non-dairy yogurt in South Korea is projected to grow at a CAGR of 4.9% through 2035, driven by the country's strong focus on food innovation, premium product positioning, and consumer preference for technologically advanced formulations. Korean consumers consistently demand high-quality, functionally enhanced products that deliver superior taste and nutritional benefits while maintaining food safety standards.

  • Ongoing investment in fermentation technology research is supporting next-generation non-dairy formulations that combine traditional Korean food science with modern probiotic delivery systems for enhanced health benefits.
  • Collaboration between food manufacturers and biotechnology firms is enhancing product innovation, reinforcing South Korea's position as a leader in science-driven plant-based food solutions.

Japan Strengthens Market with Traditional Fermentation Expertise

Revenue from non-dairy yogurt in Japan is projected to grow at a CAGR of 4.6% through 2035, supported by the country's deep understanding of fermentation processes and commitment to food quality excellence. Japanese consumers value traditional production methods, ingredient purity, and proven health benefits, positioning non-dairy yogurt as an extension of their cultural appreciation for fermented foods.

  • Growth in health-conscious retail channels and functional food distribution is increasing accessibility of premium non-dairy products across diverse consumer demographics.
  • Rising demand for digestive wellness solutions is encouraging brands to integrate traditional fermentation knowledge into their plant-based product development strategies.

Australia Anchors Growth with Environmental Consciousness

Revenue from non-dairy yogurt in Australia is projected to grow at a CAGR of 4.8% through 2035, supported by the country's strong emphasis on environmental protection, health optimization, and premium food experiences. Australian consumers prioritize sustainable sourcing, local ingredients, and proven health benefits, making non-dairy yogurt a trusted choice in the health-conscious food segment.

  • Strong regulatory support for plant-based food labeling and consumer demand for environmentally responsible products are driving manufacturers to adopt sustainable production and transparent sourcing for non-dairy alternatives.
  • Premium retail channels, health food stores, and online platforms are enhancing product distribution, while nutritionist endorsements are supporting consumer confidence in plant-based nutrition efficacy.

Germany Maintains Leadership with Science-Based Innovation

Revenue from non-dairy yogurt in Germany is projected to grow at a CAGR of 4.2% through 2035, driven by the country's strong focus on food science, organic product positioning, and consumer preference for clinically validated formulations. German consumers consistently demand high-quality, environmentally responsible products that deliver proven nutritional benefits while maintaining taste satisfaction.
  • Ongoing investment in food technology research is supporting next-generation non-dairy formulations that combine sustainability with advanced nutritional delivery systems for superior health benefits.
  • Collaboration between food manufacturers and research institutions is enhancing product innovation, reinforcing Germany's position as a leader in science-driven plant-based food solutions.

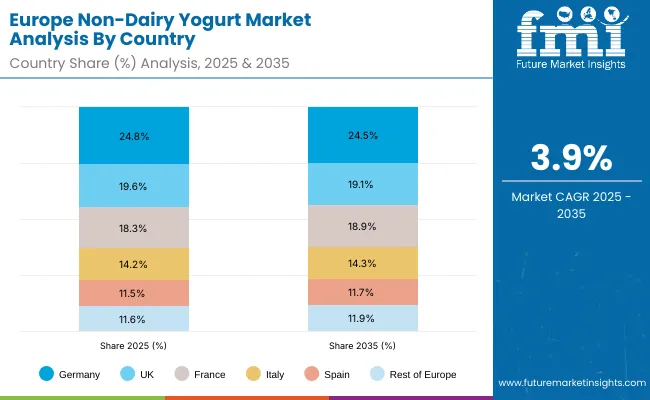
Europe Market Split by Country

Europe Non Dairy Yogurt Market

The non-dairy yogurt market in Europe is projected to grow from USD 0.72 billion in 2025 to USD 1.05 billion by 2035, registering a CAGR of 3.9% over the forecast period. Germany will remain the largest market, holding 24.8% in 2025 and easing slightly to 24.5% by 2035, supported by strong demand for organic and clean-label formulations. France follows with 19.6% in 2025, moderating to 19.1% by 2035, driven by premium product adoption and fermentation expertise.

The United Kingdom is expected to hold 18.3% in 2025, rising to 18.9% by 2035, led by ingredient-transparency trends and retailer support for plant-based ranges. Italy remains steady at 14.2% in 2025 and 14.3% in 2035, backed by growing acceptance of plant-based options.

Spain is projected at 11.5% in 2025, edging to 11.7% by 2035, supported by sustainability and snacking trends. The Rest of Western Europe (Nordic, BENELUX and other smaller markets) accounts for 11.6% in 2025, increasing to 11.9% by 2035, reflecting rising plant-based awareness and expanding retail access.
Competitive Landscape of Non-Dairy Yogurt Market

Non Dairy Yogurt Market By Company

The non-dairy yogurt market is characterized by competition among established food and beverage companies, specialty plant-based brands, and emerging clean label players. Companies are investing in advanced fermentation technologies, sustainable ingredient sourcing, premium packaging, and digital marketing strategies to deliver effective, appealing, and accessible plant-based dairy alternatives. Brand positioning, product innovation, and distribution expansion are central to strengthening product portfolios and market presence.

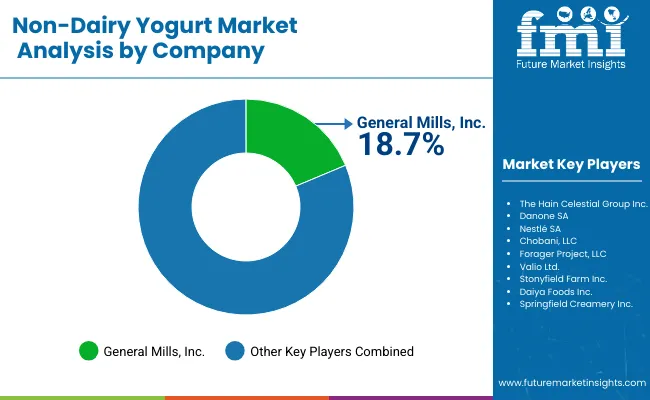
General Mills, USA-based, leads the market with significant global value share, offering diverse non-dairy yogurt formulations with a focus on taste optimization and nutritional benefits. Danone, France, provides comprehensive plant-based product ranges with emphasis on probiotic enhancement and sustainable sourcing. Nestlé, Switzerland, delivers science-backed formulations with focus on ingredient quality and consumer education. Chobani, USA, focuses on premium positioning that combines traditional yogurt expertise with plant-based innovation.

The Hain Celestial Group and Forager Project, both operating in North America, provide specialized organic non-dairy products across multiple price points and distribution channels. Valio, Finland, emphasizes natural fermentation technologies and Nordic ingredient heritage. Stonyfield Farm, USA, offers organic certified products with environmental sustainability positioning. Daiya Foods and Springfield Creamery provide targeted solutions with focus on specific dietary requirements and taste preferences.

Global Non-Dairy Yogurt Market - Stakeholder Contribution Framework

The success of non-dairy yogurt, driven by plant-based diets, lactose intolerance prevalence, and ESG-linked food reformulation, will not only expand healthier eating options but also strengthen sustainable food systems. It will consolidate emerging markets as hubs for plant-based ingredient supply while aligning advanced economies with clean-label, climate-smart dairy alternatives. This calls for a concerted effort by all stakeholders: governments, industry bodies, suppliers, OEMs, and investors. Each can be a crucial enabler in preparing the market for its next phase of growth.

How Governments Could Spur Local Production and Adoption?

  • Targeted Incentives: Offer subsidies and tax credits for processors using soy, oats, coconut, almond, and pea proteins in yogurt production.
  • Trade Agreements: Classify non-dairy yogurt as a sustainable food product in free trade agreements and streamline labeling rules for cross-border retail.
  • Facilitate Innovation: Fund R&D into probiotic fortification, clean-label stabilizers, and shelf-stable formats. Support innovation hubs for plant-based fermentation technologies.

How Industry Bodies Could Support Market Development?

  • Foster Connectivity: Establish alliances linking plant-based yogurt brands, ingredient suppliers, and retailers to align with nutrition and ESG commitments.
  • Promote Exports: Position non-dairy yogurt as a premium, climate-friendly dairy alternative. Organize trade shows to promote products in international retail and foodservice channels.
  • Upskilling Programs: Provide training on allergen management, fortification, sustainable packaging, and carbon-footprint measurement for suppliers and distributors.

How OEMs and Food-Tech Players Could Strengthen the Ecosystem?

  • Drive Integration: Develop fermentation equipment optimized for plant proteins and IoT-enabled systems for real-time quality monitoring.
  • Forge Partnerships: Co-develop fortified non-dairy yogurt formulations with functional benefits such as probiotics, omega-3s, and adaptogens. Partner with suppliers on waste upcycling for by-products like oat pulp and almond residue.

How Suppliers Could Navigate the Shift?

  • Capture Exports: Expand supply of plant-based yogurt into high-growth markets in North America, Europe, and Asia-Pacific where demand for dairy alternatives is accelerating.
  • Invest in Research: Collaborate with startups to enhance texture, creaminess, and flavor consistency across plant protein bases.
  • Build Capabilities: Train farmers and cooperatives to meet traceability and organic certification standards for plant-based raw materials.

How Investors Could Catalyze Growth?

  • Deploy Capital: Fund scaling of mid-sized non-dairy yogurt brands and co-manufacturing facilities with regional reach.
  • Support Branding: Invest in direct-to-consumer yogurt startups targeting Gen Z and health-conscious consumers.
  • De-Risk Supply Chains: Provide financing for diversified sourcing of raw materials such as soy, oats, coconut, and peas to ensure stable supply.

Key Players in the Non-Dairy Yogurt Market

  • General Mills
  • Danone
  • Nestlé
  • Chobani
  • The Hain Celestial Group
  • Forager Project
  • Valio
  • Stonyfield Farm
  • Daiya Foods
  • Springfield Creamery

Scope of the Report

Items Values
Quantitative Units (2025) USD 2.1 Billion
Source Soy, Almond, Coconut, Oat, Rice, Pea, Others
Nature Organic, Conventional
Sales Channel B2B (HoReCa & Other Food Services), B2C (Modern Grocery Retailers, Hypermarkets/Supermarkets, Convenience Stores, Specialty Stores, Online Retailers, Wholesalers, Other Retail Forms)
Flavor Plain/Unflavored, Flavored
Form Drinkable, Spoonable
Regions Covered North America, Latin America, Western Europe, Eastern Europe, Balkans & Baltic, Russia & Belarus, Central Asia, East Asia, South Asia & Pacific, Middle East & Africa
Countries Covered United States, Canada, United Kingdom, Germany, France, China, Japan, South Korea, India, Brazil, Australia and 40+ countries
Key Companies Profiled General Mills, Danone, Nestlé, Chobani, The Hain Celestial Group, Forager Project, Valio, Stonyfield Farm, Daiya Foods, and Springfield Creamery
Additional Attributes Dollar sales by source type and concentration level, regional demand trends, competitive landscape, buyer preferences for organic versus conventional products, integration with clean-label/health-focused positioning, innovations in fermentation technology, probiotic enhancement, and sustainable sourcing practices

Key Segmentation

By Source:

  • Soy
  • Almond
  • Coconut
  • Oat
  • Rice
  • Pea
  • Others

By Nature:

  • Organic
  • Conventional

By Sales Channel:

  • B2B (HoReCa & Other Food Services)
  • B2C (Modern Grocery Retailers, Hypermarkets/Supermarkets, Convenience Stores, Specialty Stores, Online Retailers, Wholesalers, Other Retail Forms)

By Flavor:

  • Plain/Unflavored
  • Flavored

By Form:

  • Drinkable
  • Spoonable

By Region:

  • North America
    • United States
    • Canada
    • Mexico
  • Latin America
    • Brazil
    • Chile
    • Rest of Latin America
  • Western Europe
    • Germany
    • United Kingdom
    • France
    • Italy
    • Spain
    • Nordic
    • BENELUX
    • Rest of Western Europe
  • Eastern Europe
    • Russia
    • Poland
    • Rest of Eastern Europe
  • Balkans & Baltic
  • Russia & Belarus
  • Central Asia
  • East Asia
    • China
    • Japan
    • South Korea
  • South Asia & Pacific
    • India
    • ASEAN
    • Australia & New Zealand
    • Rest of South Asia & Pacific
  • Middle East & Africa
    • Kingdom of Saudi Arabia
    • Other GCC Countries
    • Turkey
    • South Africa
    • Other African Union
    • Rest of Middle East & Africa

Table of Content

  1. Executive Summary
  2. Industry Introduction, Including Taxonomy and Market Definition
  3. Market Trends and Success Factors, Including Macro-economic Factors, Market Dynamics, and Recent Industry Developments
  4. Global Market Demand Analysis 2020 to 2024 and Forecast 2025 to 2035, including Historical Analysis and Future Projections
  5. Pricing Analysis
  6. Global Market Analysis 2020 to 2024 and Forecast 2025 to 2035
    • Source
    • Form
    • Sales Channel
    • Nature
    • Region
  7. Global Market Analysis 2020 to 2024 and Forecast 2025 to 2035, by Source
    • Soy Yogurt
    • Almond Yogurt
    • Coconut Yogurt
    • Oat Yogurt
    • Rice Yogurt
    • Pea Yogurt
    • Others
  8. Global Market Analysis 2020 to 2024 and Forecast 2025 to 2035, by Form
    • Drinkable
    • Spoonable
  9. Global Market Analysis 2020 to 2024 and Forecast 2025 to 2035, by Sales Channel
    • B2B (HoReCa & Other Food Services)
    • B2C
      • Modern Grocery Retailers
      • Hypermarket/ Supermarket
      • Convenience Store
      • Specialty Store
      • Online Retailers
      • Wholesalers
      • Other Retail Forms
  10. Global Market Analysis 2020 to 2024 and Forecast 2025 to 2035, by Flavor
    • Plain/Unflavoured
    • Flavoured
  11. Global Market Analysis 2020 to 2024 and Forecast 2025 to 2035, by Nature
    • Organic
    • Conventional
  12. Global Market Analysis 2020 to 2024 and Forecast 2025 to 2035, by Region
    • North America
    • Latin America
    • Western Europe
    • Eastern Europe
    • Balkans & Baltic
    • Russia & Belarus
    • Central Asia
    • East Asia
    • South Asia & Pacific
    • Middle East & Africa
  13. North America Sales Analysis 2020 to 2024 and Forecast 2025 to 2035, by Key Segments and Countries
  14. Latin America Sales Analysis 2020 to 2024 and Forecast 2025 to 2035, by Key Segments and Countries
  15. Western Europe Sales Analysis 2020 to 2024 and Forecast 2025 to 2035, by Key Segments and Countries
  16. Eastern Europe Sales Analysis 2020 to 2024 and Forecast 2025 to 2035, by Key Segments and Countries
  17. Balkans & Baltic Sales Analysis 2020 to 2024 and Forecast 2025 to 2035, by Key Segments and Countries
  18. Russia & Belarus Sales Analysis 2020 to 2024 and Forecast 2025 to 2035, by Key Segments and Countries
  19. Central Asia Sales Analysis 2020 to 2024 and Forecast 2025 to 2035, by Key Segments and Countries
  20. East Asia Sales Analysis 2020 to 2024 and Forecast 2025 to 2035, by Key Segments and Countries
  21. South Asia & Pacific Sales Analysis 2020 to 2024 and Forecast 2025 to 2035, by Key Segments and Countries
  22. Middle East & Africa Sales Analysis 2020 to 2024 and Forecast 2025 to 2035, by Key Segments and Countries
  23. Sales Forecast 2025 to 2035 by Source, Form and Sales Channel for 30 Countries
  24. Competition Outlook, including Market Structure Analysis, Company Share Analysis by Key Players, and Competition Dashboard
  25. Company Profile
    • General Mills, Inc.
    • The Hain Celestial Group Inc.
    • Danone SA
    • Nestlé SA
    • Chobani, LLC
    • Forager Project, LLC
    • Valio Ltd.
    • Stonyfield Farm Inc.
    • Daiya Foods Inc.
    • Springfield Creamery Inc.
    • Others

List of Tables

  • Table 1: Global Market Value (USD Billion) Forecast by Region, 2020-2035
  • Table 2: Global Market Volume (Units) Forecast by Region, 2020-2035
  • Table 3: Global Market Value (USD Billion) Forecast by Source, 2020-2035
  • Table 4: Global Market Volume (Units) Forecast by Source, 2020-2035
  • Table 5: Global Market Value (USD Billion) Forecast by Nature, 2020-2035
  • Table 6: Global Market Volume (Units) Forecast by Nature, 2020-2035
  • Table 7: Global Market Value (USD Billion) Forecast by Sales Channel, 2020-2035
  • Table 8: Global Market Volume (Units) Forecast by Sales Channel, 2020-2035
  • Table 9: Global Market Value (USD Billion) Forecast by Flavor, 2020-2035
  • Table 10: Global Market Volume (Units) Forecast by Flavor, 2020-2035
  • Table 11: Global Market Value (USD Billion) Forecast by Form, 2020-2035
  • Table 12: Global Market Volume (Units) Forecast by Form, 2020-2035
  • Table 13: North America Market Value (USD Billion) Forecast by Country, 2020-2035
  • Table 14: North America Market Volume (Units) Forecast by Country, 2020-2035
  • Table 15: North America Market Value (USD Billion) Forecast by Source, 2020-2035
  • Table 16: North America Market Volume (Units) Forecast by Source, 2020-2035
  • Table 17: North America Market Value (USD Billion) Forecast by Nature, 2020-2035
  • Table 18: North America Market Volume (Units) Forecast by Nature, 2020-2035
  • Table 19: North America Market Value (USD Billion) Forecast by Sales Channel, 2020-2035
  • Table 20: North America Market Volume (Units) Forecast by Sales Channel, 2020-2035
  • Table 21: North America Market Value (USD Billion) Forecast by Flavor, 2020-2035
  • Table 22: North America Market Volume (Units) Forecast by Flavor, 2020-2035
  • Table 23: North America Market Value (USD Billion) Forecast by Form, 2020-2035
  • Table 24: North America Market Volume (Units) Forecast by Form, 2020-2035
  • Table 25: Latin America Market Value (USD Billion) Forecast by Country, 2020-2035
  • Table 26: Latin America Market Volume (Units) Forecast by Country, 2020-2035
  • Table 27: Latin America Market Value (USD Billion) Forecast by Source, 2020-2035
  • Table 28: Latin America Market Volume (Units) Forecast by Source, 2020-2035
  • Table 29: Latin America Market Value (USD Billion) Forecast by Nature, 2020-2035
  • Table 30: Latin America Market Volume (Units) Forecast by Nature, 2020-2035
  • Table 31: Latin America Market Value (USD Billion) Forecast by Sales Channel, 2020-2035
  • Table 32: Latin America Market Volume (Units) Forecast by Sales Channel, 2020-2035
  • Table 33: Latin America Market Value (USD Billion) Forecast by Flavor, 2020-2035
  • Table 34: Latin America Market Volume (Units) Forecast by Flavor, 2020-2035
  • Table 35: Latin America Market Value (USD Billion) Forecast by Form, 2020-2035
  • Table 36: Latin America Market Volume (Units) Forecast by Form, 2020-2035
  • Table 37: East Asia Market Value (USD Billion) Forecast by Country, 2020-2035
  • Table 38: East Asia Market Volume (Units) Forecast by Country, 2020-2035
  • Table 39: East Asia Market Value (USD Billion) Forecast by Source, 2020-2035
  • Table 40: East Asia Market Volume (Units) Forecast by Source, 2020-2035
  • Table 41: East Asia Market Value (USD Billion) Forecast by Nature, 2020-2035
  • Table 42: East Asia Market Volume (Units) Forecast by Nature, 2020-2035
  • Table 43: East Asia Market Value (USD Billion) Forecast by Sales Channel, 2020-2035
  • Table 44: East Asia Market Volume (Units) Forecast by Sales Channel, 2020-2035
  • Table 45: East Asia Market Value (USD Billion) Forecast by Flavor, 2020-2035
  • Table 46: East Asia Market Volume (Units) Forecast by Flavor, 2020-2035
  • Table 47: East Asia Market Value (USD Billion) Forecast by Form, 2020-2035
  • Table 48: East Asia Market Volume (Units) Forecast by Form, 2020-2035
  • Table 49: South Asia & Pacific Market Value (USD Billion) Forecast by Country, 2020-2035
  • Table 50: South Asia & Pacific Market Volume (Units) Forecast by Country, 2020-2035
  • Table 51: South Asia & Pacific Market Value (USD Billion) Forecast by Source, 2020-2035
  • Table 52: South Asia & Pacific Market Volume (Units) Forecast by Source, 2020-2035
  • Table 53: South Asia & Pacific Market Value (USD Billion) Forecast by Nature, 2020-2035
  • Table 54: South Asia & Pacific Market Volume (Units) Forecast by Nature, 2020-2035
  • Table 55: South Asia & Pacific Market Value (USD Billion) Forecast by Sales Channel, 2020-2035
  • Table 56: South Asia & Pacific Market Volume (Units) Forecast by Sales Channel, 2020-2035
  • Table 57: South Asia & Pacific Market Value (USD Billion) Forecast by Flavor, 2020-2035
  • Table 58: South Asia & Pacific Market Volume (Units) Forecast by Flavor, 2020-2035
  • Table 59: South Asia & Pacific Market Value (USD Billion) Forecast by Form, 2020-2035
  • Table 60: South Asia & Pacific Market Volume (Units) Forecast by Form, 2020-2035
  • Table 61: Western Europe Market Value (USD Billion) Forecast by Country, 2020-2035
  • Table 62: Western Europe Market Volume (Units) Forecast by Country, 2020-2035
  • Table 63: Western Europe Market Value (USD Billion) Forecast by Source, 2020-2035
  • Table 64: Western Europe Market Volume (Units) Forecast by Source, 2020-2035
  • Table 65: Western Europe Market Value (USD Billion) Forecast by Nature, 2020-2035
  • Table 66: Western Europe Market Volume (Units) Forecast by Nature, 2020-2035
  • Table 67: Western Europe Market Value (USD Billion) Forecast by Sales Channel, 2020-2035
  • Table 68: Western Europe Market Volume (Units) Forecast by Sales Channel, 2020-2035
  • Table 69: Western Europe Market Value (USD Billion) Forecast by Flavor, 2020-2035
  • Table 70: Western Europe Market Volume (Units) Forecast by Flavor, 2020-2035
  • Table 71: Western Europe Market Value (USD Billion) Forecast by Form, 2020-2035
  • Table 72: Western Europe Market Volume (Units) Forecast by Form, 2020-2035
  • Table 73: Eastern Europe Market Value (USD Billion) Forecast by Country, 2020-2035
  • Table 74: Eastern Europe Market Volume (Units) Forecast by Country, 2020-2035
  • Table 75: Eastern Europe Market Value (USD Billion) Forecast by Source, 2020-2035
  • Table 76: Eastern Europe Market Volume (Units) Forecast by Source, 2020-2035
  • Table 77: Eastern Europe Market Value (USD Billion) Forecast by Nature, 2020-2035
  • Table 78: Eastern Europe Market Volume (Units) Forecast by Nature, 2020-2035
  • Table 79: Eastern Europe Market Value (USD Billion) Forecast by Sales Channel, 2020-2035
  • Table 80: Eastern Europe Market Volume (Units) Forecast by Sales Channel, 2020-2035
  • Table 81: Eastern Europe Market Value (USD Billion) Forecast by Flavor, 2020-2035
  • Table 82: Eastern Europe Market Volume (Units) Forecast by Flavor, 2020-2035
  • Table 83: Eastern Europe Market Value (USD Billion) Forecast by Form, 2020-2035
  • Table 84: Eastern Europe Market Volume (Units) Forecast by Form, 2020-2035
  • Table 85: Middle East & Africa Market Value (USD Billion) Forecast by Country, 2020-2035
  • Table 86: Middle East & Africa Market Volume (Units) Forecast by Country, 2020-2035
  • Table 87: Middle East & Africa Market Value (USD Billion) Forecast by Source, 2020-2035
  • Table 88: Middle East & Africa Market Volume (Units) Forecast by Source, 2020-2035
  • Table 89: Middle East & Africa Market Value (USD Billion) Forecast by Nature, 2020-2035
  • Table 90: Middle East & Africa Market Volume (Units) Forecast by Nature, 2020-2035
  • Table 91: Middle East & Africa Market Value (USD Billion) Forecast by Sales Channel, 2020-2035
  • Table 92: Middle East & Africa Market Volume (Units) Forecast by Sales Channel, 2020-2035
  • Table 93: Middle East & Africa Market Value (USD Billion) Forecast by Flavor, 2020-2035
  • Table 94: Middle East & Africa Market Volume (Units) Forecast by Flavor, 2020-2035
  • Table 95: Middle East & Africa Market Value (USD Billion) Forecast by Form, 2020-2035
  • Table 96: Middle East & Africa Market Volume (Units) Forecast by Form, 2020-2035
  • Table 97: USA Market Value (USD Billion) by Source, 2020-2035
  • Table 98: USA Market Volume (Units) by Source, 2020-2035
  • Table 99: USA Market Value (USD Billion) by Nature, 2020-2035
  • Table 100: USA Market Volume (Units) by Nature, 2020-2035
  • Table 101: USA Market Value (USD Billion) by Sales Channel, 2020-2035
  • Table 102: USA Market Volume (Units) by Sales Channel, 2020-2035
  • Table 103: USA Market Value (USD Billion) by Flavor, 2020-2035
  • Table 104: USA Market Volume (Units) by Flavor, 2020-2035
  • Table 105: USA Market Value (USD Billion) by Form, 2020-2035
  • Table 106: USA Market Volume (Units) by Form, 2020-2035
  • Table 107: Canada Market Value (USD Billion) by Source, 2020-2035
  • Table 108: Canada Market Volume (Units) by Source, 2020-2035
  • Table 109: Canada Market Value (USD Billion) by Nature, 2020-2035
  • Table 110: Canada Market Volume (Units) by Nature, 2020-2035
  • Table 111: Canada Market Value (USD Billion) by Sales Channel, 2020-2035
  • Table 112: Canada Market Volume (Units) by Sales Channel, 2020-2035
  • Table 113: Canada Market Value (USD Billion) by Flavor, 2020-2035
  • Table 114: Canada Market Volume (Units) by Flavor, 2020-2035
  • Table 115: Canada Market Value (USD Billion) by Form, 2020-2035
  • Table 116: Canada Market Volume (Units) by Form, 2020-2035
  • Table 117: Brazil Market Value (USD Billion) by Source, 2020-2035
  • Table 118: Brazil Market Volume (Units) by Source, 2020-2035
  • Table 119: Brazil Market Value (USD Billion) by Nature, 2020-2035
  • Table 120: Brazil Market Volume (Units) by Nature, 2020-2035
  • Table 121: Brazil Market Value (USD Billion) by Sales Channel, 2020-2035
  • Table 122: Brazil Market Volume (Units) by Sales Channel, 2020-2035
  • Table 123: Brazil Market Value (USD Billion) by Flavor, 2020-2035
  • Table 124: Brazil Market Volume (Units) by Flavor, 2020-2035
  • Table 125: Brazil Market Value (USD Billion) by Form, 2020-2035
  • Table 126: Brazil Market Volume (Units) by Form, 2020-2035
  • Table 127: China Market Value (USD Billion) by Source, 2020-2035
  • Table 128: China Market Volume (Units) by Source, 2020-2035
  • Table 129: China Market Value (USD Billion) by Nature, 2020-2035
  • Table 130: China Market Volume (Units) by Nature, 2020-2035
  • Table 131: China Market Value (USD Billion) by Sales Channel, 2020-2035
  • Table 132: China Market Volume (Units) by Sales Channel, 2020-2035
  • Table 133: China Market Value (USD Billion) by Flavor, 2020-2035
  • Table 134: China Market Volume (Units) by Flavor, 2020-2035
  • Table 135: China Market Value (USD Billion) by Form, 2020-2035
  • Table 136: China Market Volume (Units) by Form, 2020-2035
  • Table 137: Japan Market Value (USD Billion) by Source, 2020-2035
  • Table 138: Japan Market Volume (Units) by Source, 2020-2035
  • Table 139: Japan Market Value (USD Billion) by Nature, 2020-2035
  • Table 140: Japan Market Volume (Units) by Nature, 2020-2035
  • Table 141: Japan Market Value (USD Billion) by Sales Channel, 2020-2035
  • Table 142: Japan Market Volume (Units) by Sales Channel, 2020-2035
  • Table 143: Japan Market Value (USD Billion) by Flavor, 2020-2035
  • Table 144: Japan Market Volume (Units) by Flavor, 2020-2035
  • Table 145: Japan Market Value (USD Billion) by Form, 2020-2035
  • Table 146: Japan Market Volume (Units) by Form, 2020-2035
  • Table 147: India Market Value (USD Billion) by Source, 2020-2035
  • Table 148: India Market Volume (Units) by Source, 2020-2035
  • Table 149: India Market Value (USD Billion) by Nature, 2020-2035
  • Table 150: India Market Volume (Units) by Nature, 2020-2035
  • Table 151: India Market Value (USD Billion) by Sales Channel, 2020-2035
  • Table 152: India Market Volume (Units) by Sales Channel, 2020-2035
  • Table 153: India Market Value (USD Billion) by Flavor, 2020-2035
  • Table 154: India Market Volume (Units) by Flavor, 2020-2035
  • Table 155: India Market Value (USD Billion) by Form, 2020-2035
  • Table 156: India Market Volume (Units) by Form, 2020-2035
  • Table 157: Germany Market Value (USD Billion) by Source, 2020-2035
  • Table 158: Germany Market Volume (Units) by Source, 2020-2035
  • Table 159: Germany Market Value (USD Billion) by Nature, 2020-2035
  • Table 160: Germany Market Volume (Units) by Nature, 2020-2035
  • Table 161: Germany Market Value (USD Billion) by Sales Channel, 2020-2035
  • Table 162: Germany Market Volume (Units) by Sales Channel, 2020-2035
  • Table 163: Germany Market Value (USD Billion) by Flavor, 2020-2035
  • Table 164: Germany Market Volume (Units) by Flavor, 2020-2035
  • Table 165: Germany Market Value (USD Billion) by Form, 2020-2035
  • Table 166: Germany Market Volume (Units) by Form, 2020-2035
  • Table 167: UK Market Value (USD Billion) by Source, 2020-2035
  • Table 168: UK Market Volume (Units) by Source, 2020-2035
  • Table 169: UK Market Value (USD Billion) by Nature, 2020-2035
  • Table 170: UK Market Volume (Units) by Nature, 2020-2035
  • Table 171: UK Market Value (USD Billion) by Sales Channel, 2020-2035
  • Table 172: UK Market Volume (Units) by Sales Channel, 2020-2035
  • Table 173: UK Market Value (USD Billion) by Flavor, 2020-2035
  • Table 174: UK Market Volume (Units) by Flavor, 2020-2035
  • Table 175: UK Market Value (USD Billion) by Form, 2020-2035
  • Table 176: UK Market Volume (Units) by Form, 2020-2035
  • Table 177: France Market Value (USD Billion) by Source, 2020-2035
  • Table 178: France Market Volume (Units) by Source, 2020-2035
  • Table 179: France Market Value (USD Billion) by Nature, 2020-2035
  • Table 180: France Market Volume (Units) by Nature, 2020-2035
  • Table 181: France Market Value (USD Billion) by Sales Channel, 2020-2035
  • Table 182: France Market Volume (Units) by Sales Channel, 2020-2035
  • Table 183: France Market Value (USD Billion) by Flavor, 2020-2035
  • Table 184: France Market Volume (Units) by Flavor, 2020-2035
  • Table 185: France Market Value (USD Billion) by Form, 2020-2035
  • Table 186: France Market Volume (Units) by Form, 2020-2035
  • Table 187: Australia Market Value (USD Billion) by Source, 2020-2035
  • Table 188: Australia Market Volume (Units) by Source, 2020-2035
  • Table 189: Australia Market Value (USD Billion) by Nature, 2020-2035
  • Table 190: Australia Market Volume (Units) by Nature, 2020-2035
  • Table 191: Australia Market Value (USD Billion) by Sales Channel, 2020-2035
  • Table 192: Australia Market Volume (Units) by Sales Channel, 2020-2035
  • Table 193: Australia Market Value (USD Billion) by Flavor, 2020-2035
  • Table 194: Australia Market Volume (Units) by Flavor, 2020-2035
  • Table 195: Australia Market Value (USD Billion) by Form, 2020-2035
  • Table 196: Australia Market Volume (Units) by Form, 2020-2035
  • Table 197: Global Market Share by Source - Soy, Almond, Coconut, Oat, Rice, Pea, Others, 2020-2035
  • Table 198: Global Market Share by Nature - Organic vs Conventional, 2020-2035
  • Table 199: Global Market Share by Sales Channel - B2B vs B2C Distribution, 2020-2035
  • Table 200: Global Market Share by Form - Drinkable vs Spoonable Format, 2020-2035
  • Table 201: Global Market Share by Flavor - Plain/Unflavored vs Flavored Products, 2020-2035
  • Table 202: North America Market Pricing Analysis by Source, 2020-2035
  • Table 203: Latin America Market Pricing Analysis by Source, 2020-2035
  • Table 204: East Asia Market Pricing Analysis by Source, 2020-2035
  • Table 205: South Asia & Pacific Market Pricing Analysis by Source, 2020-2035
  • Table 206: Western Europe Market Pricing Analysis by Source, 2020-2035
  • Table 207: Eastern Europe Market Pricing Analysis by Source, 2020-2035
  • Table 208: Middle East & Africa Market Pricing Analysis by Source, 2020-2035
  • Table 209: Global Market Competition Analysis - Key Players Market Share, 2024
  • Table 210: Global Market Strategic Developments and Partnerships, 2020-2024

List of Figures

  • Figure 1: Global Market Value (USD Billion) by Source, 2025-2035
  • Figure 2: Global Market Value (USD Billion) by Nature, 2025-2035
  • Figure 3: Global Market Value (USD Billion) by Sales Channel, 2025-2035
  • Figure 4: Global Market Value (USD Billion) by Flavor, 2025-2035
  • Figure 5: Global Market Value (USD Billion) by Form, 2025-2035
  • Figure 6: Global Market Value (USD Billion) by Region, 2025-2035
  • Figure 7: Global Market Value (USD Billion) Analysis by Region, 2020-2035
  • Figure 8: Global Market Volume (Units) Analysis by Region, 2020-2035
  • Figure 9: Global Market Value Share (%) and BPS Analysis by Region, 2025-2035
  • Figure 10: Global Market Y-o-Y Growth (%) Projections by Region, 2025-2035
  • Figure 11: Global Market Value (USD Billion) Analysis by Source, 2020-2035
  • Figure 12: Global Market Volume (Units) Analysis by Source, 2020-2035
  • Figure 13: Global Market Value Share (%) and BPS Analysis by Source, 2025-2035
  • Figure 14: Global Market Y-o-Y Growth (%) Projections by Source, 2025-2035
  • Figure 15: Global Market Value (USD Billion) Analysis by Nature, 2020-2035
  • Figure 16: Global Market Volume (Units) Analysis by Nature, 2020-2035
  • Figure 17: Global Market Value Share (%) and BPS Analysis by Nature, 2025-2035
  • Figure 18: Global Market Y-o-Y Growth (%) Projections by Nature, 2025-2035
  • Figure 19: Global Market Value (USD Billion) Analysis by Sales Channel, 2020-2035
  • Figure 20: Global Market Volume (Units) Analysis by Sales Channel, 2020-2035
  • Figure 21: Global Market Value Share (%) and BPS Analysis by Sales Channel, 2025-2035
  • Figure 22: Global Market Y-o-Y Growth (%) Projections by Sales Channel, 2025-2035
  • Figure 23: Global Market Value (USD Billion) Analysis by Flavor, 2020-2035
  • Figure 24: Global Market Volume (Units) Analysis by Flavor, 2020-2035
  • Figure 25: Global Market Value Share (%) and BPS Analysis by Flavor, 2025-2035
  • Figure 26: Global Market Y-o-Y Growth (%) Projections by Flavor, 2025-2035
  • Figure 27: Global Market Value (USD Billion) Analysis by Form, 2020-2035
  • Figure 28: Global Market Volume (Units) Analysis by Form, 2020-2035
  • Figure 29: Global Market Value Share (%) and BPS Analysis by Form, 2025-2035
  • Figure 30: Global Market Y-o-Y Growth (%) Projections by Form, 2025-2035
  • Figure 31: Global Market Attractiveness by Source, 2025-2035
  • Figure 32: Global Market Attractiveness by Nature, 2025-2035
  • Figure 33: Global Market Attractiveness by Sales Channel, 2025-2035
  • Figure 34: Global Market Attractiveness by Flavor, 2025-2035
  • Figure 35: Global Market Attractiveness by Form, 2025-2035
  • Figure 36: Global Market Attractiveness by Region, 2025-2035
  • Figure 37: North America Market Value (USD Billion) by Source, 2025-2035
  • Figure 38: North America Market Value (USD Billion) by Nature, 2025-2035
  • Figure 39: North America Market Value (USD Billion) by Sales Channel, 2025-2035
  • Figure 40: North America Market Value (USD Billion) by Flavor, 2025-2035
  • Figure 41: North America Market Value (USD Billion) by Form, 2025-2035
  • Figure 42: North America Market Value (USD Billion) by Country, 2025-2035
  • Figure 43: North America Market Value (USD Billion) Analysis by Country, 2020-2035
  • Figure 44: North America Market Volume (Units) Analysis by Country, 2020-2035
  • Figure 45: North America Market Value Share (%) and BPS Analysis by Country, 2025-2035
  • Figure 46: North America Market Y-o-Y Growth (%) Projections by Country, 2025-2035
  • Figure 47: North America Market Value (USD Billion) Analysis by Source, 2020-2035
  • Figure 48: North America Market Volume (Units) Analysis by Source, 2020-2035
  • Figure 49: North America Market Value Share (%) and BPS Analysis by Source, 2025-2035
  • Figure 50: North America Market Y-o-Y Growth (%) Projections by Source, 2025-2035
  • Figure 51: North America Market Value (USD Billion) Analysis by Nature, 2020-2035
  • Figure 52: North America Market Volume (Units) Analysis by Nature, 2020-2035
  • Figure 53: North America Market Value Share (%) and BPS Analysis by Nature, 2025-2035
  • Figure 54: North America Market Y-o-Y Growth (%) Projections by Nature, 2025-2035
  • Figure 55: North America Market Value (USD Billion) Analysis by Sales Channel, 2020-2035
  • Figure 56: North America Market Volume (Units) Analysis by Sales Channel, 2020-2035
  • Figure 57: North America Market Value Share (%) and BPS Analysis by Sales Channel, 2025-2035
  • Figure 58: North America Market Y-o-Y Growth (%) Projections by Sales Channel, 2025-2035
  • Figure 59: North America Market Value (USD Billion) Analysis by Flavor, 2020-2035
  • Figure 60: North America Market Volume (Units) Analysis by Flavor, 2020-2035
  • Figure 61: North America Market Value Share (%) and BPS Analysis by Flavor, 2025-2035
  • Figure 62: North America Market Y-o-Y Growth (%) Projections by Flavor, 2025-2035
  • Figure 63: North America Market Value (USD Billion) Analysis by Form, 2020-2035
  • Figure 64: North America Market Volume (Units) Analysis by Form, 2020-2035
  • Figure 65: North America Market Value Share (%) and BPS Analysis by Form, 2025-2035
  • Figure 66: North America Market Y-o-Y Growth (%) Projections by Form, 2025-2035
  • Figure 67: North America Market Attractiveness by Source, 2025-2035
  • Figure 68: North America Market Attractiveness by Nature, 2025-2035
  • Figure 69: North America Market Attractiveness by Sales Channel, 2025-2035
  • Figure 70: North America Market Attractiveness by Flavor, 2025-2035
  • Figure 71: North America Market Attractiveness by Form, 2025-2035
  • Figure 72: North America Market Attractiveness by Country, 2025-2035
  • Figure 73: Latin America Market Value (USD Billion) by Source, 2025-2035
  • Figure 74: Latin America Market Value (USD Billion) by Nature, 2025-2035
  • Figure 75: Latin America Market Value (USD Billion) by Sales Channel, 2025-2035
  • Figure 76: Latin America Market Value (USD Billion) by Flavor, 2025-2035
  • Figure 77: Latin America Market Value (USD Billion) by Form, 2025-2035
  • Figure 78: Latin America Market Value (USD Billion) by Country, 2025-2035
  • Figure 79: Latin America Market Value (USD Billion) Analysis by Country, 2020-2035
  • Figure 80: Latin America Market Volume (Units) Analysis by Country, 2020-2035
  • Figure 81: Latin America Market Value Share (%) and BPS Analysis by Country, 2025-2035
  • Figure 82: Latin America Market Y-o-Y Growth (%) Projections by Country, 2025-2035
  • Figure 83: Latin America Market Value (USD Billion) Analysis by Source, 2020-2035
  • Figure 84: Latin America Market Volume (Units) Analysis by Source, 2020-2035
  • Figure 85: Latin America Market Value Share (%) and BPS Analysis by Source, 2025-2035
  • Figure 86: Latin America Market Y-o-Y Growth (%) Projections by Source, 2025-2035
  • Figure 87: Latin America Market Value (USD Billion) Analysis by Nature, 2020-2035
  • Figure 88: Latin America Market Volume (Units) Analysis by Nature, 2020-2035
  • Figure 89: Latin America Market Value Share (%) and BPS Analysis by Nature, 2025-2035
  • Figure 90: Latin America Market Y-o-Y Growth (%) Projections by Nature, 2025-2035
  • Figure 91: Latin America Market Value (USD Billion) Analysis by Sales Channel, 2020-2035
  • Figure 92: Latin America Market Volume (Units) Analysis by Sales Channel, 2020-2035
  • Figure 93: Latin America Market Value Share (%) and BPS Analysis by Sales Channel, 2025-2035
  • Figure 94: Latin America Market Y-o-Y Growth (%) Projections by Sales Channel, 2025-2035
  • Figure 95: Latin America Market Value (USD Billion) Analysis by Flavor, 2020-2035
  • Figure 96: Latin America Market Volume (Units) Analysis by Flavor, 2020-2035
  • Figure 97: Latin America Market Value Share (%) and BPS Analysis by Flavor, 2025-2035
  • Figure 98: Latin America Market Y-o-Y Growth (%) Projections by Flavor, 2025-2035
  • Figure 99: Latin America Market Value (USD Billion) Analysis by Form, 2020-2035
  • Figure 100: Latin America Market Volume (Units) Analysis by Form, 2020-2035
  • Figure 101: Latin America Market Value Share (%) and BPS Analysis by Form, 2025-2035
  • Figure 102: Latin America Market Y-o-Y Growth (%) Projections by Form, 2025-2035
  • Figure 103: Latin America Market Attractiveness by Source, 2025-2035
  • Figure 104: Latin America Market Attractiveness by Nature, 2025-2035
  • Figure 105: Latin America Market Attractiveness by Sales Channel, 2025-2035
  • Figure 106: Latin America Market Attractiveness by Flavor, 2025-2035
  • Figure 107: Latin America Market Attractiveness by Form, 2025-2035
  • Figure 108: Latin America Market Attractiveness by Country, 2025-2035
  • Figure 109: East Asia Market Value (USD Billion) by Source, 2025-2035
  • Figure 110: East Asia Market Value (USD Billion) by Nature, 2025-2035
  • Figure 111: East Asia Market Value (USD Billion) by Sales Channel, 2025-2035
  • Figure 112: East Asia Market Value (USD Billion) by Flavor, 2025-2035
  • Figure 113: East Asia Market Value (USD Billion) by Form, 2025-2035
  • Figure 114: East Asia Market Value (USD Billion) by Country, 2025-2035
  • Figure 115: East Asia Market Value (USD Billion) Analysis by Country, 2020-2035
  • Figure 116: East Asia Market Volume (Units) Analysis by Country, 2020-2035
  • Figure 117: East Asia Market Value Share (%) and BPS Analysis by Country, 2025-2035
  • Figure 118: East Asia Market Y-o-Y Growth (%) Projections by Country, 2025-2035
  • Figure 119: East Asia Market Value (USD Billion) Analysis by Source, 2020-2035
  • Figure 120: East Asia Market Volume (Units) Analysis by Source, 2020-2035
  • Figure 121: East Asia Market Value Share (%) and BPS Analysis by Source, 2025-2035
  • Figure 122: East Asia Market Y-o-Y Growth (%) Projections by Source, 2025-2035
  • Figure 123: East Asia Market Value (USD Billion) Analysis by Nature, 2020-2035
  • Figure 124: East Asia Market Volume (Units) Analysis by Nature, 2020-2035
  • Figure 125: East Asia Market Value Share (%) and BPS Analysis by Nature, 2025-2035
  • Figure 126: East Asia Market Y-o-Y Growth (%) Projections by Nature, 2025-2035
  • Figure 127: East Asia Market Value (USD Billion) Analysis by Sales Channel, 2020-2035
  • Figure 128: East Asia Market Volume (Units) Analysis by Sales Channel, 2020-2035
  • Figure 129: East Asia Market Value Share (%) and BPS Analysis by Sales Channel, 2025-2035
  • Figure 130: East Asia Market Y-o-Y Growth (%) Projections by Sales Channel, 2025-2035
  • Figure 131: East Asia Market Value (USD Billion) Analysis by Flavor, 2020-2035
  • Figure 132: East Asia Market Volume (Units) Analysis by Flavor, 2020-2035
  • Figure 133: East Asia Market Value Share (%) and BPS Analysis by Flavor, 2025-2035
  • Figure 134: East Asia Market Y-o-Y Growth (%) Projections by Flavor, 2025-2035
  • Figure 135: East Asia Market Value (USD Billion) Analysis by Form, 2020-2035
  • Figure 136: East Asia Market Volume (Units) Analysis by Form, 2020-2035
  • Figure 137: East Asia Market Value Share (%) and BPS Analysis by Form, 2025-2035
  • Figure 138: East Asia Market Y-o-Y Growth (%) Projections by Form, 2025-2035
  • Figure 139: East Asia Market Attractiveness by Source, 2025-2035
  • Figure 140: East Asia Market Attractiveness by Nature, 2025-2035
  • Figure 141: East Asia Market Attractiveness by Sales Channel, 2025-2035
  • Figure 142: East Asia Market Attractiveness by Flavor, 2025-2035
  • Figure 143: East Asia Market Attractiveness by Form, 2025-2035
  • Figure 144: East Asia Market Attractiveness by Country, 2025-2035
  • Figure 145: South Asia & Pacific Market Value (USD Billion) by Source, 2025-2035
  • Figure 146: South Asia & Pacific Market Value (USD Billion) by Nature, 2025-2035
  • Figure 147: South Asia & Pacific Market Value (USD Billion) by Sales Channel, 2025-2035
  • Figure 148: South Asia & Pacific Market Value (USD Billion) by Flavor, 2025-2035
  • Figure 149: South Asia & Pacific Market Value (USD Billion) by Form, 2025-2035
  • Figure 150: South Asia & Pacific Market Value (USD Billion) by Country, 2025-2035
  • Figure 151: South Asia & Pacific Market Value (USD Billion) Analysis by Country, 2020-2035
  • Figure 152: South Asia & Pacific Market Volume (Units) Analysis by Country, 2020-2035
  • Figure 153: South Asia & Pacific Market Value Share (%) and BPS Analysis by Country, 2025-2035
  • Figure 154: South Asia & Pacific Market Y-o-Y Growth (%) Projections by Country, 2025-2035
  • Figure 155: South Asia & Pacific Market Value (USD Billion) Analysis by Source, 2020-2035
  • Figure 156: South Asia & Pacific Market Volume (Units) Analysis by Source, 2020-2035
  • Figure 157: South Asia & Pacific Market Value Share (%) and BPS Analysis by Source, 2025-2035
  • Figure 158: South Asia & Pacific Market Y-o-Y Growth (%) Projections by Source, 2025-2035
  • Figure 159: South Asia & Pacific Market Value (USD Billion) Analysis by Nature, 2020-2035
  • Figure 160: South Asia & Pacific Market Volume (Units) Analysis by Nature, 2020-2035
  • Figure 161: South Asia & Pacific Market Value Share (%) and BPS Analysis by Nature, 2025-2035
  • Figure 162: South Asia & Pacific Market Y-o-Y Growth (%) Projections by Nature, 2025-2035
  • Figure 163: South Asia & Pacific Market Value (USD Billion) Analysis by Sales Channel, 2020-2035
  • Figure 164: South Asia & Pacific Market Volume (Units) Analysis by Sales Channel, 2020-2035
  • Figure 165: South Asia & Pacific Market Value Share (%) and BPS Analysis by Sales Channel, 2025-2035
  • Figure 166: South Asia & Pacific Market Y-o-Y Growth (%) Projections by Sales Channel, 2025-2035
  • Figure 167: South Asia & Pacific Market Value (USD Billion) Analysis by Flavor, 2020-2035
  • Figure 168: South Asia & Pacific Market Volume (Units) Analysis by Flavor, 2020-2035
  • Figure 169: South Asia & Pacific Market Value Share (%) and BPS Analysis by Flavor, 2025-2035
  • Figure 170: South Asia & Pacific Market Y-o-Y Growth (%) Projections by Flavor, 2025-2035
  • Figure 171: South Asia & Pacific Market Value (USD Billion) Analysis by Form, 2020-2035
  • Figure 172: South Asia & Pacific Market Volume (Units) Analysis by Form, 2020-2035
  • Figure 173: South Asia & Pacific Market Value Share (%) and BPS Analysis by Form, 2025-2035
  • Figure 174: South Asia & Pacific Market Y-o-Y Growth (%) Projections by Form, 2025-2035
  • Figure 175: South Asia & Pacific Market Attractiveness by Source, 2025-2035
  • Figure 176: South Asia & Pacific Market Attractiveness by Nature, 2025-2035
  • Figure 177: South Asia & Pacific Market Attractiveness by Sales Channel, 2025-2035
  • Figure 178: South Asia & Pacific Market Attractiveness by Flavor, 2025-2035
  • Figure 179: South Asia & Pacific Market Attractiveness by Form, 2025-2035
  • Figure 180: South Asia & Pacific Market Attractiveness by Country, 2025-2035
  • Figure 181: Western Europe Market Value (USD Billion) by Source, 2025-2035
  • Figure 182: Western Europe Market Value (USD Billion) by Nature, 2025-2035
  • Figure 183: Western Europe Market Value (USD Billion) by Sales Channel, 2025-2035
  • Figure 184: Western Europe Market Value (USD Billion) by Flavor, 2025-2035
  • Figure 185: Western Europe Market Value (USD Billion) by Form, 2025-2035
  • Figure 186: Western Europe Market Value (USD Billion) by Country, 2025-2035
  • Figure 187: Western Europe Market Value (USD Billion) Analysis by Country, 2020-2035
  • Figure 188: Western Europe Market Volume (Units) Analysis by Country, 2020-2035
  • Figure 189: Western Europe Market Value Share (%) and BPS Analysis by Country, 2025-2035
  • Figure 190: Western Europe Market Y-o-Y Growth (%) Projections by Country, 2025-2035
  • Figure 191: Western Europe Market Value (USD Billion) Analysis by Source, 2020-2035
  • Figure 192: Western Europe Market Volume (Units) Analysis by Source, 2020-2035
  • Figure 193: Western Europe Market Value Share (%) and BPS Analysis by Source, 2025-2035
  • Figure 194: Western Europe Market Y-o-Y Growth (%) Projections by Source, 2025-2035
  • Figure 195: Western Europe Market Value (USD Billion) Analysis by Nature, 2020-2035
  • Figure 196: Western Europe Market Volume (Units) Analysis by Nature, 2020-2035
  • Figure 197: Western Europe Market Value Share (%) and BPS Analysis by Nature, 2025-2035
  • Figure 198: Western Europe Market Y-o-Y Growth (%) Projections by Nature, 2025-2035
  • Figure 199: Western Europe Market Value (USD Billion) Analysis by Sales Channel, 2020-2035
  • Figure 200: Western Europe Market Volume (Units) Analysis by Sales Channel, 2020-2035
  • Figure 201: Western Europe Market Value Share (%) and BPS Analysis by Sales Channel, 2025-2035
  • Figure 202: Western Europe Market Y-o-Y Growth (%) Projections by Sales Channel, 2025-2035
  • Figure 203: Western Europe Market Value (USD Billion) Analysis by Flavor, 2020-2035
  • Figure 204: Western Europe Market Volume (Units) Analysis by Flavor, 2020-2035
  • Figure 205: Western Europe Market Value Share (%) and BPS Analysis by Flavor, 2025-2035
  • Figure 206: Western Europe Market Y-o-Y Growth (%) Projections by Flavor, 2025-2035
  • Figure 207: Western Europe Market Value (USD Billion) Analysis by Form, 2020-2035
  • Figure 208: Western Europe Market Volume (Units) Analysis by Form, 2020-2035
  • Figure 209: Western Europe Market Value Share (%) and BPS Analysis by Form, 2025-2035
  • Figure 210: Western Europe Market Y-o-Y Growth (%) Projections by Form, 2025-2035
  • Figure 211: Western Europe Market Attractiveness by Source, 2025-2035
  • Figure 212: Western Europe Market Attractiveness by Nature, 2025-2035
  • Figure 213: Western Europe Market Attractiveness by Sales Channel, 2025-2035
  • Figure 214: Western Europe Market Attractiveness by Flavor, 2025-2035
  • Figure 215: Western Europe Market Attractiveness by Form, 2025-2035
  • Figure 216: Western Europe Market Attractiveness by Country, 2025-2035
  • Figure 217: Eastern Europe Market Value (USD Billion) by Source, 2025-2035
  • Figure 218: Eastern Europe Market Value (USD Billion) by Nature, 2025-2035
  • Figure 219: Eastern Europe Market Value (USD Billion) by Sales Channel, 2025-2035
  • Figure 220: Eastern Europe Market Value (USD Billion) by Flavor, 2025-2035
  • Figure 221: Eastern Europe Market Value (USD Billion) by Form, 2025-2035
  • Figure 222: Eastern Europe Market Value (USD Billion) by Country, 2025-2035
  • Figure 223: Eastern Europe Market Value (USD Billion) Analysis by Country, 2020-2035
  • Figure 224: Eastern Europe Market Volume (Units) Analysis by Country, 2020-2035
  • Figure 225: Eastern Europe Market Value Share (%) and BPS Analysis by Country, 2025-2035
  • Figure 226: Eastern Europe Market Y-o-Y Growth (%) Projections by Country, 2025-2035
  • Figure 227: Eastern Europe Market Value (USD Billion) Analysis by Source, 2020-2035
  • Figure 228: Eastern Europe Market Volume (Units) Analysis by Source, 2020-2035
  • Figure 229: Eastern Europe Market Value Share (%) and BPS Analysis by Source, 2025-2035
  • Figure 230: Eastern Europe Market Y-o-Y Growth (%) Projections by Source, 2025-2035
  • Figure 231: Eastern Europe Market Value (USD Billion) Analysis by Nature, 2020-2035
  • Figure 232: Eastern Europe Market Volume (Units) Analysis by Nature, 2020-2035
  • Figure 233: Eastern Europe Market Value Share (%) and BPS Analysis by Nature, 2025-2035
  • Figure 234: Eastern Europe Market Y-o-Y Growth (%) Projections by Nature, 2025-2035
  • Figure 235: Eastern Europe Market Value (USD Billion) Analysis by Sales Channel, 2020-2035
  • Figure 236: Eastern Europe Market Volume (Units) Analysis by Sales Channel, 2020-2035
  • Figure 237: Eastern Europe Market Value Share (%) and BPS Analysis by Sales Channel, 2025-2035
  • Figure 238: Eastern Europe Market Y-o-Y Growth (%) Projections by Sales Channel, 2025-2035
  • Figure 239: Eastern Europe Market Value (USD Billion) Analysis by Flavor, 2020-2035
  • Figure 240: Eastern Europe Market Volume (Units) Analysis by Flavor, 2020-2035
  • Figure 241: Eastern Europe Market Value Share (%) and BPS Analysis by Flavor, 2025-2035
  • Figure 242: Eastern Europe Market Y-o-Y Growth (%) Projections by Flavor, 2025-2035
  • Figure 243: Eastern Europe Market Value (USD Billion) Analysis by Form, 2020-2035
  • Figure 244: Eastern Europe Market Volume (Units) Analysis by Form, 2020-2035
  • Figure 245: Eastern Europe Market Value Share (%) and BPS Analysis by Form, 2025-2035
  • Figure 246: Eastern Europe Market Y-o-Y Growth (%) Projections by Form, 2025-2035
  • Figure 247: Eastern Europe Market Attractiveness by Source, 2025-2035
  • Figure 248: Eastern Europe Market Attractiveness by Nature, 2025-2035
  • Figure 249: Eastern Europe Market Attractiveness by Sales Channel, 2025-2035
  • Figure 250: Eastern Europe Market Attractiveness by Flavor, 2025-2035
  • Figure 251: Eastern Europe Market Attractiveness by Form, 2025-2035
  • Figure 252: Eastern Europe Market Attractiveness by Country, 2025-2035
  • Figure 253: Middle East & Africa Market Value (USD Billion) by Source, 2025-2035
  • Figure 254: Middle East & Africa Market Value (USD Billion) by Nature, 2025-2035
  • Figure 255: Middle East & Africa Market Value (USD Billion) by Sales Channel, 2025-2035
  • Figure 256: Middle East & Africa Market Value (USD Billion) by Flavor, 2025-2035
  • Figure 257: Middle East & Africa Market Value (USD Billion) by Form, 2025-2035
  • Figure 258: Middle East & Africa Market Value (USD Billion) by Country, 2025-2035
  • Figure 259: Middle East & Africa Market Value (USD Billion) Analysis by Country, 2020-2035
  • Figure 260: Middle East & Africa Market Volume (Units) Analysis by Country, 2020-2035
  • Figure 261: Middle East & Africa Market Value Share (%) and BPS Analysis by Country, 2025-2035
  • Figure 262: Middle East & Africa Market Y-o-Y Growth (%) Projections by Country, 2025-2035
  • Figure 263: Middle East & Africa Market Value (USD Billion) Analysis by Source, 2020-2035
  • Figure 264: Middle East & Africa Market Volume (Units) Analysis by Source, 2020-2035
  • Figure 265: Middle East & Africa Market Value Share (%) and BPS Analysis by Source, 2025-2035
  • Figure 266: Middle East & Africa Market Y-o-Y Growth (%) Projections by Source, 2025-2035
  • Figure 267: Middle East & Africa Market Value (USD Billion) Analysis by Nature, 2020-2035
  • Figure 268: Middle East & Africa Market Volume (Units) Analysis by Nature, 2020-2035
  • Figure 269: Middle East & Africa Market Value Share (%) and BPS Analysis by Nature, 2025-2035
  • Figure 270: Middle East & Africa Market Y-o-Y Growth (%) Projections by Nature, 2025-2035
  • Figure 271: Middle East & Africa Market Value (USD Billion) Analysis by Sales Channel, 2020-2035
  • Figure 272: Middle East & Africa Market Volume (Units) Analysis by Sales Channel, 2020-2035
  • Figure 273: Middle East & Africa Market Value Share (%) and BPS Analysis by Sales Channel, 2025-2035
  • Figure 274: Middle East & Africa Market Y-o-Y Growth (%) Projections by Sales Channel, 2025-2035
  • Figure 275: Middle East & Africa Market Value (USD Billion) Analysis by Flavor, 2020-2035
  • Figure 276: Middle East & Africa Market Volume (Units) Analysis by Flavor, 2020-2035
  • Figure 277: Middle East & Africa Market Value Share (%) and BPS Analysis by Flavor, 2025-2035
  • Figure 278: Middle East & Africa Market Y-o-Y Growth (%) Projections by Flavor, 2025-2035
  • Figure 279: Middle East & Africa Market Value (USD Billion) Analysis by Form, 2020-2035
  • Figure 280: Middle East & Africa Market Volume (Units) Analysis by Form, 2020-2035
  • Figure 281: Middle East & Africa Market Value Share (%) and BPS Analysis by Form, 2025-2035
  • Figure 282: Middle East & Africa Market Y-o-Y Growth (%) Projections by Form, 2025-2035
  • Figure 283: Middle East & Africa Market Attractiveness by Source, 2025-2035
  • Figure 284: Middle East & Africa Market Attractiveness by Nature, 2025-2035
  • Figure 285: Middle East & Africa Market Attractiveness by Sales Channel, 2025-2035
  • Figure 286: Middle East & Africa Market Attractiveness by Flavor, 2025-2035
  • Figure 287: Middle East & Africa Market Attractiveness by Form, 2025-2035
  • Figure 288: Middle East & Africa Market Attractiveness by Country, 2025-2035

Frequently Asked Questions

How big is the non-dairy yogurt industry?

The industry is poised to reach USD 2.1 billion in 2025.

What is the outlook on non-dairy yogurt sales?

The industry is projected to register USD 3.2 billion by 2035.

Which type of non-dairy yogurt products are widely used?

Almond-based yogurts are among the most widely used products due to their creamy texture and nutritional benefits.

Which country is poised to register fastest growth in the non-dairy yogurt industry?

India, slated to grow at a 5.1% CAGR during the study period, is poised for the fastest growth in the Industry.

Who are the major non-dairy yogurt companies?

Key companies in the industry include General Mills, Inc., Danone SA, Nestlé SA, Chobani, LLC, The Hain Celestial Group Inc., Forager Project, LLC, Valio Ltd., Stonyfield Farm Inc., Daiya Foods Inc., and Springfield Creamery Inc.

Explore Similar Insights

Future Market Insights

Non-Dairy Yogurt Market

Chat With MaRIA

Chat With

MaRIA

Hi There, I am MaRIA, Your Market Research Intelligence Assistant. How may I help you?