Non-Contrast CT Imaging Market Size and Share Forecast Outlook 2025 to 2035

The Non-Contrast CT Imaging Market is estimated to be valued at USD 246.9 billion in 2025 and is projected to reach USD 371.8 billion by 2035, registering a compound annual growth rate (CAGR) of 4.2% over the forecast period.
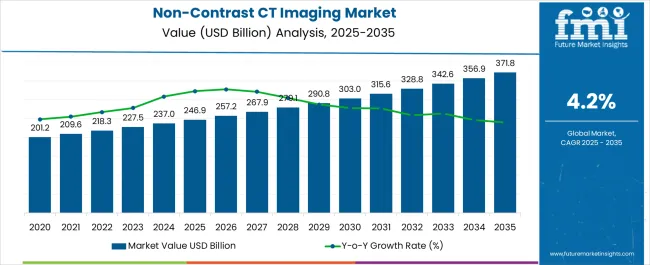
Quick Stats for Non-Contrast CT Imaging Market

  • Non-Contrast CT Imaging Market Industry Value (2025): USD 246.9 billion
  • Non-Contrast CT Imaging Market Forecast Value (2035): USD 371.8 billion
  • Non-Contrast CT Imaging Market Forecast CAGR: 4.2%
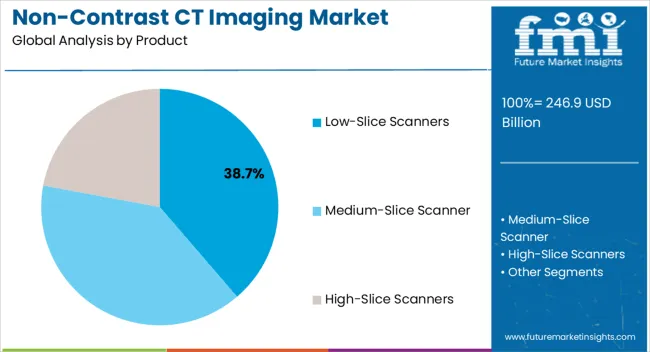
  • Leading Segment in Non-Contrast CT Imaging Market in 2025: Low-Slice Scanners (38.7%)
  • Key Growth Region in Non-Contrast CT Imaging Market: North America, Asia-Pacific, Europe
  • Top Key Players in Non-Contrast CT Imaging Market: Cedars-Sinai, Siemens Healthineers, GE HealthCare, Canon Medical Systems

Non Contrast Ct Imaging Market Market Value Analysis

Metric Value
Non-Contrast CT Imaging Market Estimated Value in (2025 E) USD 246.9 billion
Non-Contrast CT Imaging Market Forecast Value in (2035 F) USD 371.8 billion
Forecast CAGR (2025 to 2035) 4.2%

Rationale for Segmental Growth in the Non Contrast CT Imaging Market

The non contrast CT imaging market is experiencing consistent growth driven by the rising prevalence of cardiovascular diseases, neurological disorders, and trauma related cases that require quick and precise imaging. The ability of non contrast CT scans to deliver accurate diagnostic outcomes without the risks associated with contrast agents is a major factor influencing adoption.

Increasing demand for cost effective diagnostic solutions, coupled with advancements in imaging technology that improve resolution and reduce scan times, are supporting broader clinical integration. Hospitals and diagnostic centers are increasingly adopting these systems for emergency and routine applications, further reinforced by government initiatives for improving healthcare infrastructure.

The market outlook remains positive as patient safety, accessibility, and rapid diagnostic turnaround continue to shape procurement strategies and future investment in CT imaging technologies.
Segmental Analysis

Insights into the Low Slice Scanners Product Segment

Non Contrast Ct Imaging Market Analysis By Product

The low slice scanners segment is projected to account for 38.70% of total market revenue by 2025 within the product category, making it the leading segment. Growth has been influenced by their affordability, compact size, and suitability for routine diagnostic applications across a wide range of clinical settings.

Low slice systems provide adequate imaging quality for common procedures while ensuring lower operational costs compared to high end systems. Their reliability in handling basic imaging needs, particularly in resource constrained environments and smaller healthcare facilities, has accelerated adoption.

As healthcare providers prioritize cost efficiency along with patient throughput, low slice scanners continue to hold a dominant share in the product category.
Insights into the Cardiac Imaging Application Segment

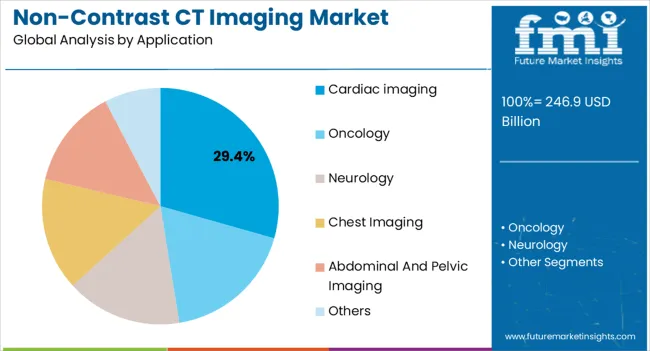
Non Contrast Ct Imaging Market Analysis By Application

The cardiac imaging segment is expected to capture 29.40% of total market revenue by 2025 within the application category. This growth is being driven by the rising global burden of cardiovascular diseases and the need for rapid, accurate, and non invasive diagnostic tools.

Non contrast CT imaging is increasingly being preferred in cardiac diagnostics due to its ability to identify coronary calcium scores and structural abnormalities without the risk of contrast induced complications. Widespread use in preventive health checkups, early disease detection, and monitoring of at risk populations has strengthened its market position.

As the focus on cardiovascular health intensifies, adoption in this application segment is expected to remain robust.
Insights into the Hospital End User Segment

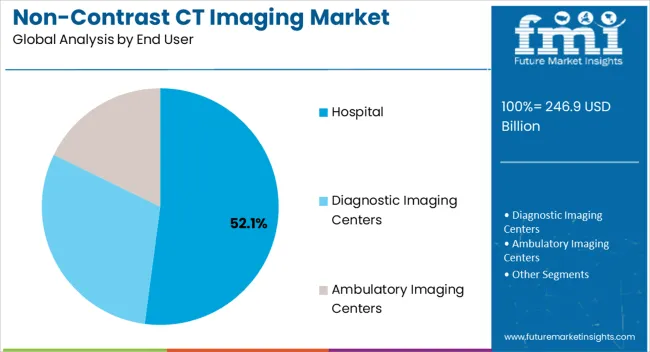
Non Contrast Ct Imaging Market Analysis By End User

The hospital segment is projected to contribute 52.10% of total revenue by 2025 within the end user category, making it the most dominant segment. Hospitals remain primary adopters due to their capacity to handle high patient volumes, access to advanced imaging infrastructure, and the presence of trained professionals.

The integration of non contrast CT systems in emergency departments and specialized units such as neurology and cardiology has further reinforced their utilization. Additionally, hospitals benefit from reimbursement frameworks and government funding programs that support the procurement of imaging technologies.

These factors have positioned hospitals as the leading end user segment, driving consistent adoption of non contrast CT imaging solutions.

Comparison of Historical vs Future Outlook for Non-Contrast CT Imaging Market (2020 to 2035)

From 2020 to 2025, the global non-contrast CT imaging market experienced a CAGR of 2.9%, reaching a market size of USD 246.9 million in 2025.

From 2020 to 2025, the demand for non-contrast CT imaging has been driven by several factors, including the increasing prevalence of various medical conditions, advancements in imaging technology, and the need for quick and accurate diagnostic procedures. Non-contrast CT imaging is considered safe, cost-effective, and relatively quick compared to other imaging modalities, making it a popular choice in many clinical settings.

Future Forecast for Non-Contrast CT Imaging Industry:

Looking ahead, the global non-contrast CT imaging industry is expected to rise at a CAGR of 4.4% from 2025 to 2035. During the forecast period, the market size is expected to reach USD 371.8 million by 2035.

Non-contrast CT imaging refers to computed tomography scans performed without the use of contrast agents or dyes. It is commonly used in various medical applications, including the evaluation of brain, abdomen, pelvis, and renal conditions. Non-contrast CT imaging provides valuable diagnostic information and helps in the detection of abnormalities, such as tumors, kidney stones, and vascular diseases.
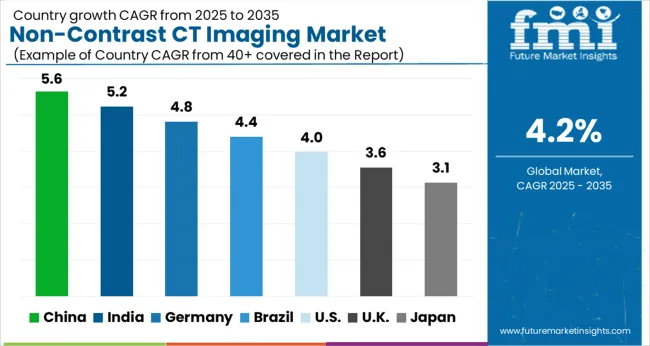
Analysis of Top Countries Adopting Non-Contrast CT Imaging Solutions

Non Contrast Ct Imaging Market Cagr Analysis By Country

Non-Contrast CT Imaging Market to Surge in the United States Due to Cost Effectiveness and Efficiency

Country The United States
Market Size (USD million) by End of Forecast Period (2035) USD 371.8 million
CAGR % 2025 to End of Forecast (2035) 6.8%

The non-contrast CT imaging industry in the United States is expected to reach a market size of USD 371.8 million by 2035, expanding at a CAGR of 6.8%. Non-contrast CT imaging is considered a cost-effective and efficient diagnostic tool for certain indications. It allows for quick imaging and evaluation of structures without the need for contrast agents, reducing procedure time and associated costs. This cost-effectiveness, along with the ease of use and widespread availability of CT scanners, has contributed to the growth of the non-contrast CT imaging market.

Rising Healthcare policy and funding to Propel the United Kingdom Market Growth

Country The United Kingdom
Market Size (USD million) by End of Forecast Period (2035) USD 23.2 million
CAGR % 2025 to End of Forecast (2035) 5.1%

The non-contrast CT imaging industry in the United Kingdom is expected to reach a market value of USD 23.2 million, expanding at a CAGR of 5.1% during the forecast period. The UK's National Health Service (NHS) plays a crucial role in driving the adoption and growth of medical imaging technologies. The NHS's focus on providing quality healthcare services and timely diagnostics has led to investments in advanced imaging technologies, including non-contrast CT. Funding and support from the NHS facilitate the availability and accessibility of non-contrast CT imaging services across the country.

Notable Growth Expected in China's Non-Contrast CT Imaging Market as Due to Rapid Urbanization and Healthcare Infrastructure

Country China
Market Size (USD million) by End of Forecast Period (2035) USD 43.8 million
CAGR % 2025 to End of Forecast (2035) 7.6%

The non-contrast CT imaging industry in China is anticipated to reach a market size of USD 43.8 million, moving at a CAGR of 7.6% during the forecast period. China's rapid urbanization and the development of healthcare infrastructure in tier-2 and tier-3 cities have improved access to medical services, including non-contrast CT imaging. The expansion of healthcare facilities, including hospitals and imaging centers, in these areas has contributed to the growth of the market.
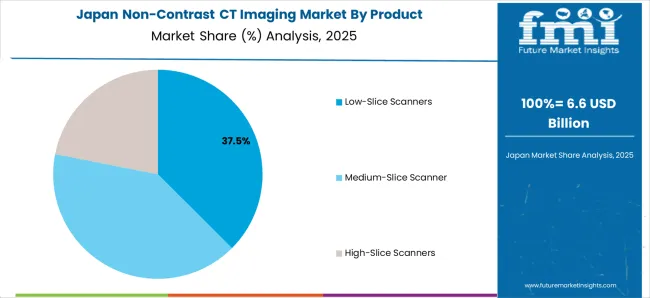
Collaboration between academia and healthcare provider to Drive Market Growth in Japan

Non Contrast Ct Imaging Market Japan Market Share Analysis By Product

Country Japan
Market Size (USD million) by End of Forecast Period (2035) USD 21.0 million
CAGR % 2025 to End of Forecast (2035) 5.6%

The non-contrast CT imaging industry in Japan is estimated to reach a market size of USD 21.0 million by 2035, thriving at a CAGR of 5.6%. Collaboration between academia, industry stakeholders, and healthcare providers in Japan has played a crucial role in the development and adoption of non-contrast CT imaging. Research institutions and medical facilities collaborate with industry partners to drive technological advancements, conduct clinical trials, and develop best practices. This collaboration promotes the growth of the non-contrast CT imaging market.
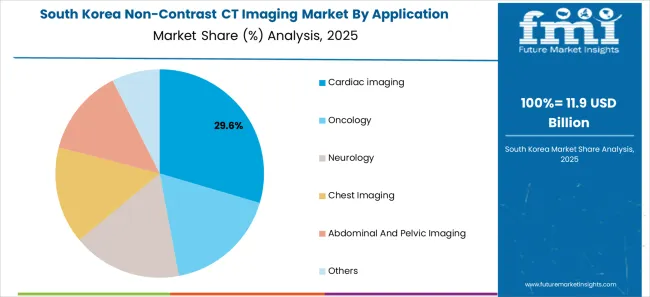
Demand for Non-Contrast CT Imaging is Rising Due to Increasing Medical Tourism to Fuel Market Growth in South Korea

Non Contrast Ct Imaging Market South Korea Market Share Analysis By Application

Country South Korea
Market Size (USD million) by End of Forecast Period (2035) USD 9.0 million
CAGR % 2025 to End of Forecast (2035) 5.6%

The non-contrast CT imaging industry in South Korea is expected to reach a market size of USD 9.0 million, expanding at a CAGR of 5.6% during the forecast period. South Korea has become a popular destination for medical tourism, attracting patients from both domestic and international markets. The availability of advanced medical technologies, including non-contrast CT imaging, plays a significant role in attracting medical tourists. The growth of medical tourism has further stimulated the demand for non-contrast CT imaging services in South Korea.

Non-Contrast CT Imaging Industry Analysis by Category

Medium-Slice Scanner to Dominate Non-Contrast CT Imaging Industry with 3.3% CAGR through 2035

Medium-Slice Scanner is expected to dominate the non-contrast CT imaging industry with a CAGR of 3.3% from 2025 to 2035. Medium-slice scanners provide better spatial resolution and image quality. Better anatomical structure visualization is made possible by this advancement, which also improves the precision of diagnostic interpretation-especially in non-contrast CT imaging. Medium-slice scanners are generally faster than older-generation scanners, allowing for quicker scan times. This is beneficial for both patients and healthcare providers, as it reduces the time required for image acquisition, enhancing patient comfort and increasing departmental efficiency.

How the Chest Imaging are Driving the Non-Contrast CT Imaging Market?

The chest imaging segments are expected to dominate the non-contrast CT imaging industry with a CAGR of 2.8% from 2025 to 2035. Chest imaging, particularly non-contrast CT scans, is commonly used to evaluate and diagnose various respiratory conditions such as pulmonary embolism, pneumonia, lung nodules, interstitial lung diseases, and lung cancer. The demand for accurate and detailed chest imaging is driving the growth of non-contrast CT imaging.

Which End User is Widely Adopted the Non-Contrast CT Imaging?

The hospital segment is expected to dominate the non-contrast CT imaging industry with a CAGR of 3.3% from 2025 to 2035. Hospitals are the main sources of healthcare and frequently have departments for sophisticated imaging with non-contrast CT scanners. The use of non-contrast CT imaging has grown as a result of their wide distribution and accessibility to a sizable patient population. Non-contrast CT scans are conveniently accessible to patients through hospitals, facilitating rapid diagnosis and treatment.
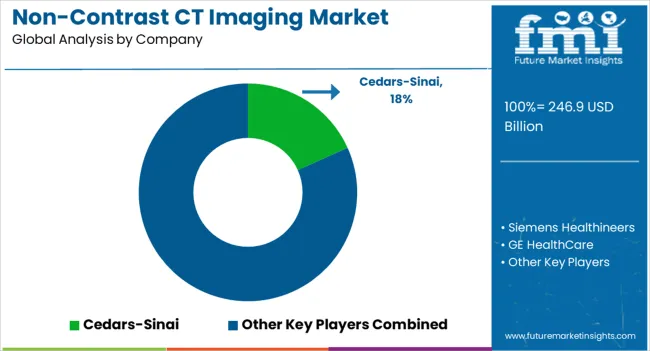
How Key Players Maintain Competitiveness in the Non-Contrast CT Imaging Market

Non Contrast Ct Imaging Market Analysis By Company

The market for non-contrast CT imaging is highly competitive, with numerous vendors vying for supremacy. Important players must use cunning tactics in such a situation to stay ahead of the opposition.

Key Strategies Used by the Participants

  • Product Development

To produce creative products that improve effectiveness, which is reliability, and cost-effectiveness, businesses make significant investments in research and development. Product innovation enables companies to stand out from the competition while also meeting the shifting needs of their customers.

  • Strategic Alliances & Collaborations

Strategic partnerships and alliances with other businesses are regularly formed by Key players in an industry to take advantage of each other's advantages and expand their market reach. Through such partnerships, companies may also obtain access to new technologies and markets.

  • Expansion into Emerging Markets

The market for non-contrast CT imaging devices is growing quickly in emerging economies like China and India. To increase their presence in these regions, major companies are expanding their distribution networks and building regional manufacturing sites.

  • Acquisitions and mergers

Mergers and acquisitions are frequently used by key players in the non-contrast CT imaging business to consolidate their market position, extend their product range, and gain access to new markets.

Key Non-Contrast CT Imaging Market Players and Concentration

  • Cedars-Sinai.
  • Siemens Healthineers
  • GE HealthCare
  • Canon Medical Systems

Key Developments in the Non-Contrast CT Imaging Market:

  • In April 2025, the results of a clinical experiment conducted by Cedars-Sinai researchers that was blinded by randomization showed that an AI tool outperformed sonographers in terms of evaluating and diagnosing heart function.

Top Segments Studied in the Non-Contrast CT Imaging Market Research Report

By Product:

  • Low-Slice Scanners
  • Medium-Slice Scanner
  • High-Slice Scanners

By Application:

  • Cardiac imaging
  • Oncology
  • Neurology
  • Chest Imaging
  • Abdominal and Pelvic Imaging
  • Others

By End User:

  • Hospital
  • Diagnostic Imaging Centers
  • Ambulatory Imaging Centers

By Region:

  • North America
  • Latin America
  • Europe
  • East Asia
  • South Asia
  • Oceania
  • The Middle East & Africa

Frequently Asked Questions

How big is the non-contrast CT imaging market in 2025?

The global non-contrast CT imaging market is estimated to be valued at USD 246.9 billion in 2025.

What will be the size of non-contrast CT imaging market in 2035?

The market size for the non-contrast CT imaging market is projected to reach USD 371.8 billion by 2035.

How much will be the non-contrast CT imaging market growth between 2025 and 2035?

The non-contrast CT imaging market is expected to grow at a 4.2% CAGR between 2025 and 2035.

What are the key product types in the non-contrast CT imaging market?

The key product types in non-contrast CT imaging market are low-slice scanners, medium-slice scanner and high-slice scanners.

Which application segment to contribute significant share in the non-contrast CT imaging market in 2025?

In terms of application, cardiac imaging segment to command 29.4% share in the non-contrast CT imaging market in 2025.

Table of Content

  1. Executive Summary
    • Global Market Outlook
    • Demand-side Trends
    • Supply-side Trends
    • Technology Roadmap Analysis
    • Analysis and Recommendations
  2. Market Overview
    • Market Coverage / Taxonomy
    • Market Definition / Scope / Limitations
  3. Market Background
    • Market Dynamics
      • Drivers
      • Restraints
      • Opportunity
      • Trends
    • Scenario Forecast
      • Demand in Optimistic Scenario
      • Demand in Likely Scenario
      • Demand in Conservative Scenario
    • Opportunity Map Analysis
    • Product Life Cycle Analysis
    • Supply Chain Analysis
    • Investment Feasibility Matrix
    • Value Chain Analysis
    • PESTLE and Porter’s Analysis
    • Regulatory Landscape
    • Regional Parent Market Outlook
    • Production and Consumption Statistics
    • Import and Export Statistics
  4. Global Market Analysis 2020 to 2024 and Forecast, 2025 to 2035
    • Historical Market Size Value (USD Million) Analysis, 2020 to 2024
    • Current and Future Market Size Value (USD Million) Projections, 2025 to 2035
      • Y-o-Y Growth Trend Analysis
      • Absolute $ Opportunity Analysis
  5. Global Market Pricing Analysis 2020 to 2024 and Forecast 2025 to 2035
  6. Global Market Analysis 2020 to 2024 and Forecast 2025 to 2035, By Product
    • Introduction / Key Findings
    • Historical Market Size Value (USD Million) Analysis By Product , 2020 to 2024
    • Current and Future Market Size Value (USD Million) Analysis and Forecast By Product , 2025 to 2035
      • Low-Slice Scanners
      • Medium-Slice Scanner
      • High-Slice Scanners
    • Y-o-Y Growth Trend Analysis By Product , 2020 to 2024
    • Absolute $ Opportunity Analysis By Product , 2025 to 2035
  7. Global Market Analysis 2020 to 2024 and Forecast 2025 to 2035, By Application
    • Introduction / Key Findings
    • Historical Market Size Value (USD Million) Analysis By Application, 2020 to 2024
    • Current and Future Market Size Value (USD Million) Analysis and Forecast By Application, 2025 to 2035
      • Cardiac imaging
      • Oncology
      • Neurology
      • Chest Imaging
      • Abdominal And Pelvic Imaging
      • Others
    • Y-o-Y Growth Trend Analysis By Application, 2020 to 2024
    • Absolute $ Opportunity Analysis By Application, 2025 to 2035
  8. Global Market Analysis 2020 to 2024 and Forecast 2025 to 2035, By End User
    • Introduction / Key Findings
    • Historical Market Size Value (USD Million) Analysis By End User, 2020 to 2024
    • Current and Future Market Size Value (USD Million) Analysis and Forecast By End User, 2025 to 2035
      • Hospital
      • Diagnostic Imaging Centers
      • Ambulatory Imaging Centers
    • Y-o-Y Growth Trend Analysis By End User, 2020 to 2024
    • Absolute $ Opportunity Analysis By End User, 2025 to 2035
  9. Global Market Analysis 2020 to 2024 and Forecast 2025 to 2035, By Region
    • Introduction
    • Historical Market Size Value (USD Million) Analysis By Region, 2020 to 2024
    • Current Market Size Value (USD Million) Analysis and Forecast By Region, 2025 to 2035
      • North America
      • Latin America
      • Western Europe
      • Eastern Europe
      • East Asia
      • South Asia and Pacific
      • Middle East & Africa
    • Market Attractiveness Analysis By Region
  10. North America Market Analysis 2020 to 2024 and Forecast 2025 to 2035, By Country
    • Historical Market Size Value (USD Million) Trend Analysis By Market Taxonomy, 2020 to 2024
    • Market Size Value (USD Million) Forecast By Market Taxonomy, 2025 to 2035
      • By Country
        • USA
        • Canada
        • Mexico
      • By Product
      • By Application
      • By End User
    • Market Attractiveness Analysis
      • By Country
      • By Product
      • By Application
      • By End User
    • Key Takeaways
  11. Latin America Market Analysis 2020 to 2024 and Forecast 2025 to 2035, By Country
    • Historical Market Size Value (USD Million) Trend Analysis By Market Taxonomy, 2020 to 2024
    • Market Size Value (USD Million) Forecast By Market Taxonomy, 2025 to 2035
      • By Country
        • Brazil
        • Chile
        • Rest of Latin America
      • By Product
      • By Application
      • By End User
    • Market Attractiveness Analysis
      • By Country
      • By Product
      • By Application
      • By End User
    • Key Takeaways
  12. Western Europe Market Analysis 2020 to 2024 and Forecast 2025 to 2035, By Country
    • Historical Market Size Value (USD Million) Trend Analysis By Market Taxonomy, 2020 to 2024
    • Market Size Value (USD Million) Forecast By Market Taxonomy, 2025 to 2035
      • By Country
        • Germany
        • UK
        • Italy
        • Spain
        • France
        • Nordic
        • BENELUX
        • Rest of Western Europe
      • By Product
      • By Application
      • By End User
    • Market Attractiveness Analysis
      • By Country
      • By Product
      • By Application
      • By End User
    • Key Takeaways
  13. Eastern Europe Market Analysis 2020 to 2024 and Forecast 2025 to 2035, By Country
    • Historical Market Size Value (USD Million) Trend Analysis By Market Taxonomy, 2020 to 2024
    • Market Size Value (USD Million) Forecast By Market Taxonomy, 2025 to 2035
      • By Country
        • Russia
        • Poland
        • Hungary
        • Balkan & Baltic
        • Rest of Eastern Europe
      • By Product
      • By Application
      • By End User
    • Market Attractiveness Analysis
      • By Country
      • By Product
      • By Application
      • By End User
    • Key Takeaways
  14. East Asia Market Analysis 2020 to 2024 and Forecast 2025 to 2035, By Country
    • Historical Market Size Value (USD Million) Trend Analysis By Market Taxonomy, 2020 to 2024
    • Market Size Value (USD Million) Forecast By Market Taxonomy, 2025 to 2035
      • By Country
        • China
        • Japan
        • South Korea
      • By Product
      • By Application
      • By End User
    • Market Attractiveness Analysis
      • By Country
      • By Product
      • By Application
      • By End User
    • Key Takeaways
  15. South Asia and Pacific Market Analysis 2020 to 2024 and Forecast 2025 to 2035, By Country
    • Historical Market Size Value (USD Million) Trend Analysis By Market Taxonomy, 2020 to 2024
    • Market Size Value (USD Million) Forecast By Market Taxonomy, 2025 to 2035
      • By Country
        • India
        • ASEAN
        • Australia & New Zealand
        • Rest of South Asia and Pacific
      • By Product
      • By Application
      • By End User
    • Market Attractiveness Analysis
      • By Country
      • By Product
      • By Application
      • By End User
    • Key Takeaways
  16. Middle East & Africa Market Analysis 2020 to 2024 and Forecast 2025 to 2035, By Country
    • Historical Market Size Value (USD Million) Trend Analysis By Market Taxonomy, 2020 to 2024
    • Market Size Value (USD Million) Forecast By Market Taxonomy, 2025 to 2035
      • By Country
        • Kingdom of Saudi Arabia
        • Other GCC Countries
        • Turkiye
        • South Africa
        • Other African Union
        • Rest of Middle East & Africa
      • By Product
      • By Application
      • By End User
    • Market Attractiveness Analysis
      • By Country
      • By Product
      • By Application
      • By End User
    • Key Takeaways
  17. Key Countries Market Analysis
    • USA
      • Pricing Analysis
      • Market Share Analysis, 2024
        • By Product
        • By Application
        • By End User
    • Canada
      • Pricing Analysis
      • Market Share Analysis, 2024
        • By Product
        • By Application
        • By End User
    • Mexico
      • Pricing Analysis
      • Market Share Analysis, 2024
        • By Product
        • By Application
        • By End User
    • Brazil
      • Pricing Analysis
      • Market Share Analysis, 2024
        • By Product
        • By Application
        • By End User
    • Chile
      • Pricing Analysis
      • Market Share Analysis, 2024
        • By Product
        • By Application
        • By End User
    • Germany
      • Pricing Analysis
      • Market Share Analysis, 2024
        • By Product
        • By Application
        • By End User
    • UK
      • Pricing Analysis
      • Market Share Analysis, 2024
        • By Product
        • By Application
        • By End User
    • Italy
      • Pricing Analysis
      • Market Share Analysis, 2024
        • By Product
        • By Application
        • By End User
    • Spain
      • Pricing Analysis
      • Market Share Analysis, 2024
        • By Product
        • By Application
        • By End User
    • France
      • Pricing Analysis
      • Market Share Analysis, 2024
        • By Product
        • By Application
        • By End User
    • India
      • Pricing Analysis
      • Market Share Analysis, 2024
        • By Product
        • By Application
        • By End User
    • ASEAN
      • Pricing Analysis
      • Market Share Analysis, 2024
        • By Product
        • By Application
        • By End User
    • Australia & New Zealand
      • Pricing Analysis
      • Market Share Analysis, 2024
        • By Product
        • By Application
        • By End User
    • China
      • Pricing Analysis
      • Market Share Analysis, 2024
        • By Product
        • By Application
        • By End User
    • Japan
      • Pricing Analysis
      • Market Share Analysis, 2024
        • By Product
        • By Application
        • By End User
    • South Korea
      • Pricing Analysis
      • Market Share Analysis, 2024
        • By Product
        • By Application
        • By End User
    • Russia
      • Pricing Analysis
      • Market Share Analysis, 2024
        • By Product
        • By Application
        • By End User
    • Poland
      • Pricing Analysis
      • Market Share Analysis, 2024
        • By Product
        • By Application
        • By End User
    • Hungary
      • Pricing Analysis
      • Market Share Analysis, 2024
        • By Product
        • By Application
        • By End User
    • Kingdom of Saudi Arabia
      • Pricing Analysis
      • Market Share Analysis, 2024
        • By Product
        • By Application
        • By End User
    • Turkiye
      • Pricing Analysis
      • Market Share Analysis, 2024
        • By Product
        • By Application
        • By End User
    • South Africa
      • Pricing Analysis
      • Market Share Analysis, 2024
        • By Product
        • By Application
        • By End User
  18. Market Structure Analysis
    • Competition Dashboard
    • Competition Benchmarking
    • Market Share Analysis of Top Players
      • By Regional
      • By Product
      • By Application
      • By End User
  19. Competition Analysis
    • Competition Deep Dive
      • Cedars-Sinai
        • Overview
        • Product Portfolio
        • Profitability by Market Segments (Product/Age /Sales Channel/Region)
        • Sales Footprint
        • Strategy Overview
          • Marketing Strategy
          • Product Strategy
          • Channel Strategy
      • Siemens Healthineers
      • GE HealthCare
      • Canon Medical Systems
  20. Assumptions & Acronyms Used
  21. Research Methodology

List of Tables

  • Table 1: Global Market Value (USD Million) Forecast by Region, 2020 to 2035
  • Table 2: Global Market Value (USD Million) Forecast by Product , 2020 to 2035
  • Table 3: Global Market Value (USD Million) Forecast by Application, 2020 to 2035
  • Table 4: Global Market Value (USD Million) Forecast by End User, 2020 to 2035
  • Table 5: North America Market Value (USD Million) Forecast by Country, 2020 to 2035
  • Table 6: North America Market Value (USD Million) Forecast by Product , 2020 to 2035
  • Table 7: North America Market Value (USD Million) Forecast by Application, 2020 to 2035
  • Table 8: North America Market Value (USD Million) Forecast by End User, 2020 to 2035
  • Table 9: Latin America Market Value (USD Million) Forecast by Country, 2020 to 2035
  • Table 10: Latin America Market Value (USD Million) Forecast by Product , 2020 to 2035
  • Table 11: Latin America Market Value (USD Million) Forecast by Application, 2020 to 2035
  • Table 12: Latin America Market Value (USD Million) Forecast by End User, 2020 to 2035
  • Table 13: Western Europe Market Value (USD Million) Forecast by Country, 2020 to 2035
  • Table 14: Western Europe Market Value (USD Million) Forecast by Product , 2020 to 2035
  • Table 15: Western Europe Market Value (USD Million) Forecast by Application, 2020 to 2035
  • Table 16: Western Europe Market Value (USD Million) Forecast by End User, 2020 to 2035
  • Table 17: Eastern Europe Market Value (USD Million) Forecast by Country, 2020 to 2035
  • Table 18: Eastern Europe Market Value (USD Million) Forecast by Product , 2020 to 2035
  • Table 19: Eastern Europe Market Value (USD Million) Forecast by Application, 2020 to 2035
  • Table 20: Eastern Europe Market Value (USD Million) Forecast by End User, 2020 to 2035
  • Table 21: East Asia Market Value (USD Million) Forecast by Country, 2020 to 2035
  • Table 22: East Asia Market Value (USD Million) Forecast by Product , 2020 to 2035
  • Table 23: East Asia Market Value (USD Million) Forecast by Application, 2020 to 2035
  • Table 24: East Asia Market Value (USD Million) Forecast by End User, 2020 to 2035
  • Table 25: South Asia and Pacific Market Value (USD Million) Forecast by Country, 2020 to 2035
  • Table 26: South Asia and Pacific Market Value (USD Million) Forecast by Product , 2020 to 2035
  • Table 27: South Asia and Pacific Market Value (USD Million) Forecast by Application, 2020 to 2035
  • Table 28: South Asia and Pacific Market Value (USD Million) Forecast by End User, 2020 to 2035
  • Table 29: Middle East & Africa Market Value (USD Million) Forecast by Country, 2020 to 2035
  • Table 30: Middle East & Africa Market Value (USD Million) Forecast by Product , 2020 to 2035
  • Table 31: Middle East & Africa Market Value (USD Million) Forecast by Application, 2020 to 2035
  • Table 32: Middle East & Africa Market Value (USD Million) Forecast by End User, 2020 to 2035

List of Figures

  • Figure 1: Global Market Pricing Analysis
  • Figure 2: Global Market Value (USD Million) Forecast 2020 to 2035
  • Figure 3: Global Market Value Share and BPS Analysis by Product , 2025 and 2035
  • Figure 4: Global Market Y-o-Y Growth Comparison by Product , 2025 to 2035
  • Figure 5: Global Market Attractiveness Analysis by Product
  • Figure 6: Global Market Value Share and BPS Analysis by Application, 2025 and 2035
  • Figure 7: Global Market Y-o-Y Growth Comparison by Application, 2025 to 2035
  • Figure 8: Global Market Attractiveness Analysis by Application
  • Figure 9: Global Market Value Share and BPS Analysis by End User, 2025 and 2035
  • Figure 10: Global Market Y-o-Y Growth Comparison by End User, 2025 to 2035
  • Figure 11: Global Market Attractiveness Analysis by End User
  • Figure 12: Global Market Value (USD Million) Share and BPS Analysis by Region, 2025 and 2035
  • Figure 13: Global Market Y-o-Y Growth Comparison by Region, 2025 to 2035
  • Figure 14: Global Market Attractiveness Analysis by Region
  • Figure 15: North America Market Incremental Dollar Opportunity, 2025 to 2035
  • Figure 16: Latin America Market Incremental Dollar Opportunity, 2025 to 2035
  • Figure 17: Western Europe Market Incremental Dollar Opportunity, 2025 to 2035
  • Figure 18: Eastern Europe Market Incremental Dollar Opportunity, 2025 to 2035
  • Figure 19: East Asia Market Incremental Dollar Opportunity, 2025 to 2035
  • Figure 20: South Asia and Pacific Market Incremental Dollar Opportunity, 2025 to 2035
  • Figure 21: Middle East & Africa Market Incremental Dollar Opportunity, 2025 to 2035
  • Figure 22: North America Market Value Share and BPS Analysis by Country, 2025 and 2035
  • Figure 23: North America Market Value Share and BPS Analysis by Product , 2025 and 2035
  • Figure 24: North America Market Y-o-Y Growth Comparison by Product , 2025 to 2035
  • Figure 25: North America Market Attractiveness Analysis by Product
  • Figure 26: North America Market Value Share and BPS Analysis by Application, 2025 and 2035
  • Figure 27: North America Market Y-o-Y Growth Comparison by Application, 2025 to 2035
  • Figure 28: North America Market Attractiveness Analysis by Application
  • Figure 29: North America Market Value Share and BPS Analysis by End User, 2025 and 2035
  • Figure 30: North America Market Y-o-Y Growth Comparison by End User, 2025 to 2035
  • Figure 31: North America Market Attractiveness Analysis by End User
  • Figure 32: Latin America Market Value Share and BPS Analysis by Country, 2025 and 2035
  • Figure 33: Latin America Market Value Share and BPS Analysis by Product , 2025 and 2035
  • Figure 34: Latin America Market Y-o-Y Growth Comparison by Product , 2025 to 2035
  • Figure 35: Latin America Market Attractiveness Analysis by Product
  • Figure 36: Latin America Market Value Share and BPS Analysis by Application, 2025 and 2035
  • Figure 37: Latin America Market Y-o-Y Growth Comparison by Application, 2025 to 2035
  • Figure 38: Latin America Market Attractiveness Analysis by Application
  • Figure 39: Latin America Market Value Share and BPS Analysis by End User, 2025 and 2035
  • Figure 40: Latin America Market Y-o-Y Growth Comparison by End User, 2025 to 2035
  • Figure 41: Latin America Market Attractiveness Analysis by End User
  • Figure 42: Western Europe Market Value Share and BPS Analysis by Country, 2025 and 2035
  • Figure 43: Western Europe Market Value Share and BPS Analysis by Product , 2025 and 2035
  • Figure 44: Western Europe Market Y-o-Y Growth Comparison by Product , 2025 to 2035
  • Figure 45: Western Europe Market Attractiveness Analysis by Product
  • Figure 46: Western Europe Market Value Share and BPS Analysis by Application, 2025 and 2035
  • Figure 47: Western Europe Market Y-o-Y Growth Comparison by Application, 2025 to 2035
  • Figure 48: Western Europe Market Attractiveness Analysis by Application
  • Figure 49: Western Europe Market Value Share and BPS Analysis by End User, 2025 and 2035
  • Figure 50: Western Europe Market Y-o-Y Growth Comparison by End User, 2025 to 2035
  • Figure 51: Western Europe Market Attractiveness Analysis by End User
  • Figure 52: Eastern Europe Market Value Share and BPS Analysis by Country, 2025 and 2035
  • Figure 53: Eastern Europe Market Value Share and BPS Analysis by Product , 2025 and 2035
  • Figure 54: Eastern Europe Market Y-o-Y Growth Comparison by Product , 2025 to 2035
  • Figure 55: Eastern Europe Market Attractiveness Analysis by Product
  • Figure 56: Eastern Europe Market Value Share and BPS Analysis by Application, 2025 and 2035
  • Figure 57: Eastern Europe Market Y-o-Y Growth Comparison by Application, 2025 to 2035
  • Figure 58: Eastern Europe Market Attractiveness Analysis by Application
  • Figure 59: Eastern Europe Market Value Share and BPS Analysis by End User, 2025 and 2035
  • Figure 60: Eastern Europe Market Y-o-Y Growth Comparison by End User, 2025 to 2035
  • Figure 61: Eastern Europe Market Attractiveness Analysis by End User
  • Figure 62: East Asia Market Value Share and BPS Analysis by Country, 2025 and 2035
  • Figure 63: East Asia Market Value Share and BPS Analysis by Product , 2025 and 2035
  • Figure 64: East Asia Market Y-o-Y Growth Comparison by Product , 2025 to 2035
  • Figure 65: East Asia Market Attractiveness Analysis by Product
  • Figure 66: East Asia Market Value Share and BPS Analysis by Application, 2025 and 2035
  • Figure 67: East Asia Market Y-o-Y Growth Comparison by Application, 2025 to 2035
  • Figure 68: East Asia Market Attractiveness Analysis by Application
  • Figure 69: East Asia Market Value Share and BPS Analysis by End User, 2025 and 2035
  • Figure 70: East Asia Market Y-o-Y Growth Comparison by End User, 2025 to 2035
  • Figure 71: East Asia Market Attractiveness Analysis by End User
  • Figure 72: South Asia and Pacific Market Value Share and BPS Analysis by Country, 2025 and 2035
  • Figure 73: South Asia and Pacific Market Value Share and BPS Analysis by Product , 2025 and 2035
  • Figure 74: South Asia and Pacific Market Y-o-Y Growth Comparison by Product , 2025 to 2035
  • Figure 75: South Asia and Pacific Market Attractiveness Analysis by Product
  • Figure 76: South Asia and Pacific Market Value Share and BPS Analysis by Application, 2025 and 2035
  • Figure 77: South Asia and Pacific Market Y-o-Y Growth Comparison by Application, 2025 to 2035
  • Figure 78: South Asia and Pacific Market Attractiveness Analysis by Application
  • Figure 79: South Asia and Pacific Market Value Share and BPS Analysis by End User, 2025 and 2035
  • Figure 80: South Asia and Pacific Market Y-o-Y Growth Comparison by End User, 2025 to 2035
  • Figure 81: South Asia and Pacific Market Attractiveness Analysis by End User
  • Figure 82: Middle East & Africa Market Value Share and BPS Analysis by Country, 2025 and 2035
  • Figure 83: Middle East & Africa Market Value Share and BPS Analysis by Product , 2025 and 2035
  • Figure 84: Middle East & Africa Market Y-o-Y Growth Comparison by Product , 2025 to 2035
  • Figure 85: Middle East & Africa Market Attractiveness Analysis by Product
  • Figure 86: Middle East & Africa Market Value Share and BPS Analysis by Application, 2025 and 2035
  • Figure 87: Middle East & Africa Market Y-o-Y Growth Comparison by Application, 2025 to 2035
  • Figure 88: Middle East & Africa Market Attractiveness Analysis by Application
  • Figure 89: Middle East & Africa Market Value Share and BPS Analysis by End User, 2025 and 2035
  • Figure 90: Middle East & Africa Market Y-o-Y Growth Comparison by End User, 2025 to 2035
  • Figure 91: Middle East & Africa Market Attractiveness Analysis by End User
  • Figure 92: Global Market – Tier Structure Analysis
  • Figure 93: Global Market – Company Share Analysis
Dashboard
Dashboard
Dashboard
Dashboard
Dashboard
Dashboard

Full Research Suite comprises of:

Market outlook & trends analysis

Market outlook & trends analysis

Interviews & case studies

Interviews & case studies

Strategic recommendations

Strategic recommendations

Vendor profiles & capabilities analysis

Vendor profiles & capabilities analysis

5-year forecasts

5-year forecasts

8 regions and 60+ country-level data splits

8 regions and 60+ country-level data splits

Market segment data splits

Market segment data splits

12 months of continuous data updates

12 months of continuous data updates

DELIVERED AS:

PDF EXCEL ONLINE

Full Research Suite


$5000

$7500

$10000

Buy Report Now
Similar Industry Reports

Similar Industry Reports

CT Guided Intervention Market

CT Guided Intervention Market Analysis - Size, Share, and Forecast Outlook 2025 to 2035

CTNG Testing Market
CTNG Testing Market

Global CTNG Testing Market Analysis – Trends, Size & Forecast 2024-2034

Activated Carbon for Sugar Decolorization Market

Activated Carbon for Sugar Decolorization Market Forecast and Outlook 2025 to 2035

Active, Smart, and Intelligent Packaging Market

Active, Smart, and Intelligent Packaging Market Size and Share Forecast Outlook 2025 to 2035

Activated Alumina Market

Activated Alumina Market Size and Share Forecast Outlook 2025 to 2035

CCTV Tester Market
CCTV Tester Market

CCTV Tester Market Size and Share Forecast Outlook 2025 to 2035

Activated Carbon Fiber Market

Activated Carbon Fiber Market Size and Share Forecast Outlook 2025 to 2035

Actinic Keratosis Treatment Market

Actinic Keratosis Treatment Market Size and Share Forecast Outlook 2025 to 2035

Octadecanedioic Acid Market

Octadecanedioic Acid Market Size and Share Forecast Outlook 2025 to 2035

MCT Oil Market
MCT Oil Market

MCT Oil Market Size and Share Forecast Outlook 2025 to 2035

Activated Cake Emulsifier Market

Activated Cake Emulsifier Market Size and Share Forecast Outlook 2025 to 2035

Octreotide Market
Octreotide Market

Octreotide Market Size and Share Forecast Outlook 2025 to 2035

Active Charcoal Complexes Market

Active Charcoal Complexes Market Analysis - Size and Share Forecast Outlook 2025 to 2035

Activated Carbon Bags Market

Activated Carbon Bags Market Size and Share Forecast Outlook 2025 to 2035

Active & Intelligent Packaging Market

Active & Intelligent Packaging Market Size and Share Forecast Outlook 2025 to 2035

Ectoin-Infused Skincare Market

Ectoin-Infused Skincare Market Size and Share Forecast Outlook 2025 to 2035

Activated Bleaching Earth Market

Activated Bleaching Earth Market Growth - Trends & Forecast 2025 to 2035

Activated Carbon Filter Market

Activated Carbon Filter Market Growth - Trends & Forecast 2025 to 2035

Action Figures Market

Analysis of the Action Figures Market by Material, Type, End-user, and Region 2025 to 2035

Active Network Management Market

Active Network Management Market Analysis by Component, End Users, and Region Through 2025 to 2035

Future Market Insights

Non-Contrast CT Imaging Market

Chat With MaRIA

Chat With

MaRIA

Hi There, I am MaRIA, Your Market Research Intelligence Assistant. How may I help you?