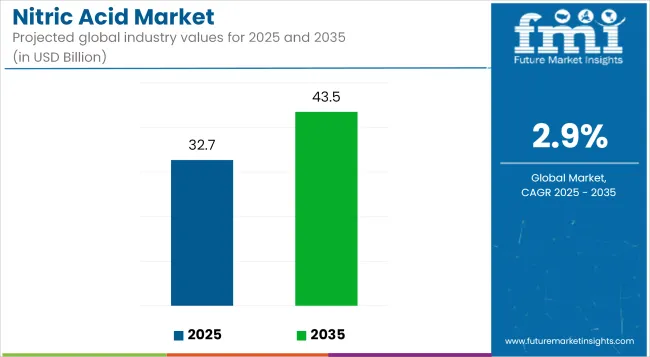
The global nitric acid market is anticipated to reach USD 32.7 billion in 2025 and is further projected to attain valuation of USD 43.5 billion by 2035, registering a CAGR of 2.9% during the forecast period.
| Metric | Value |
|---|---|
| Market Size in 2025 | USD 32.7 billion |
| Projected Market Size in 2035 | USD 43.5 billion |
| CAGR (2025 to 2035) | 2.9% |
Growth is supported by continued demand for ammonium nitrate in fertilizer production, increased consumption in mining and construction explosives, and wider utilization across specialty chemicals, polymers, and metal treatment sectors.
Nitric acid plays a foundational role in industrial manufacturing and chemical synthesis. Its primary application remains in the production of ammonium nitrate, which accounts for a significant share of fertilizer consumption globally.
Agriculture continues to be a key end-use sector, particularly in regions experiencing rising food production demand and arable land intensification. Countries with fertilizer subsidy programs and investments in agrochemicals are expected to maintain steady demand for nitric acid derivatives.
Explosives manufacturing represents another major application segment, particularly for the mining, tunneling, and infrastructure development sectors.
Nitric acid is used in the formulation of nitroglycerin and trinitrotoluene (TNT), both essential components in commercial and defense-grade explosives. With infrastructure development expanding in Asia-Pacific, Africa, and Latin America, regional demand is forecast to remain stable.
In the chemicals and polymers industry, nitric acid is used in the production of adipic acid, which serves as a precursor to nylon 6,6. Demand from the automotive and consumer goods sectors continues to influence this segment, supported by the growth of engineered plastics.
Nitric acid is also essential for producing specialty chemicals, dyes, and synthetic fibers, making it a critical input in high-performance materials and textiles.
Environmental regulations are shaping production practices, particularly in Europe and North America. Regulatory frameworks aimed at reducing nitrogen oxide (NOx) emissions have led to investment in cleaner technologies such as selective catalytic reduction (SCR) and gas scrubbing units. Manufacturers are increasingly focusing on optimizing process efficiency, recovering by-products like nitrous oxide, and reducing energy consumption per ton of nitric acid produced.
Emerging markets such as India, Brazil, and parts of Southeast Asia are witnessing expansions in both fertilizer and chemical industries, further supporting global nitric acid trade.
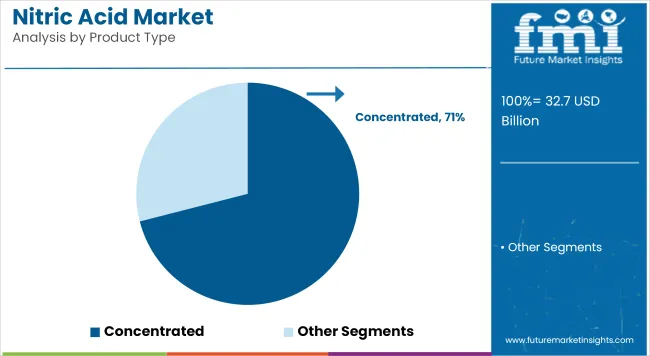
Concentrated nitric acid is projected to account for approximately 71% of the global nitric acid market share in 2025 and is expected to grow at a CAGR of 2.8% through 2035. This grade is primarily used in manufacturing explosives, nitration of organic compounds, and etching metals. Its high reactivity and oxidative potential make it critical in producing ammonium nitrate, adipic acid, and nitrobenzene.
The demand is particularly strong in regions with robust mining, military, and chemical manufacturing sectors. As metal finishing and chemical intermediates continue to find applications across automotive, construction, and electronics, concentrated nitric acid remains a vital industrial input.
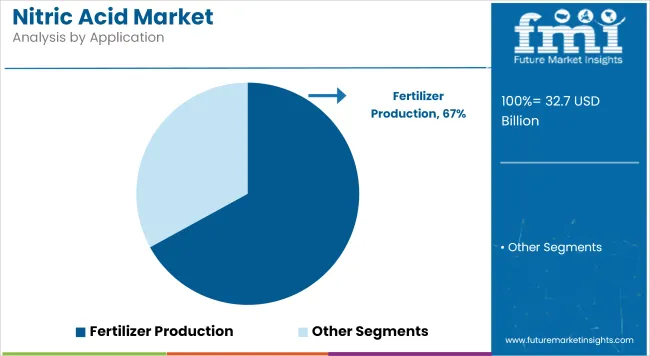
The fertilizer production segment is estimated to hold approximately 67% of the global nitric acid market share in 2025 and is projected to grow at a CAGR of 3.0% through 2035. Nitric acid is used in producing nitrogen-based fertilizers that support high crop yields and soil nutrient balance. Agricultural demand, especially in emerging economies with expanding food requirements, continues to support large-volume consumption.
Nations such as China, India, Brazil, and Russia are major consumers due to domestic fertilizer production. Environmental compliance and the shift toward low-emission fertilizer manufacturing processes are prompting investments in nitric acid plants equipped with NOₓ reduction technologies. As global food security and sustainable agriculture gain traction, fertilizer-grade nitric acid maintains a dominant position in the overall market landscape.
Environmental Regulations and Raw Material Price Volatility
Tight environmental controls governing the emission of nitrogen oxide (NOx) during the manufacture of nitric acid pose a threat to the Nitric Acid Market. Governments around the world - including the Environmental Protection Agency (EPA) and European Chemicals Agency (ECHA) - are implementing tougher emissions control regulations that increase compliance costs for manufacturers. Moreover, the major volatility of raw material prices, especially for ammonia, a critical feedstock used to manufacture nitric acid, impacts the stability and profitability of the market.
Growth in Fertilizers, Explosives, and Specialty Chemicals
Despite regulatory hurdles, demand is driven by an increase in usage for fertilizers in particular ammonium nitrate used in agriculture. It also has increasing applications in explosives (TNT), mining, and industrial processes, such as treatment of metals and chemical synthesis.
Furthermore, advances in low-carbon technologies for nitric acid production, integration with green ammonia, and nitric acid recycling technology pave the way for new growth opportunities. If bio-based fertilisers and niche applications in aerospace and electronics open up further market areas.
The United States nitric acid market is witnessing moderate growth, driven by increasing demand in the fertilizer, chemical, and explosives industries. This is largely driven by the agriculture industry, which uses ammonium nitrate fertilizers, as well as steady demand from the defense and mining industries.
Producers are being forced to convert to cleaner production methods due to strict environmental constraints regarding nitrogen oxide emissions. In addition to this, continuous investment in manufacturing and chemical infrastructure supporting market growth.
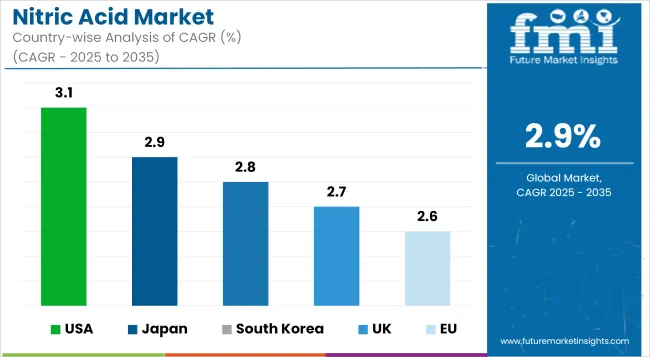
| Country | CAGR (2025 to 2035) |
|---|---|
| USA | 3.1% |
UK nitric acid in the agricultural and chemical manufacturing industryThe UK Nitric Acid market is growing at a steady pace with the highest usages in UK Nitric Acid demanding agriculture and chemical manufacturing industry. The growth of the market is driven by increasing application of nitric acid in the manufacture of specialty chemicals and industrial applications.
Market dynamics go well with greenhouse gas emission regulation processes that prefer environment-friendly raw production techniques. Moreover, the presence of major chemical manufacturers along with steady R&D activities in nitrogen-based chemicals are augmenting the market growth.
| Country | CAGR (2025 to 2035) |
|---|---|
| UK | 2.7% |
EU nitric acid market - Industry Analysis European Nitric Acid market size was USD XX Billion in 2019 for theFiscal year. Stricter EU emissions and waste management regulations are driving industries to adopt cleaner nitric acid production technologies.
Significant chemical production centers in Germany, France, and the Netherlands stretch out to the prominent markets. Additionally, increasing production of specialty chemicals in the market, along with their expanded use in the production of polymers, are also supporting the market growth.
| Region | CAGR (2025 to 2035) |
|---|---|
| EU | 2.6% |
As a result, nitric acid industry in Japan is also developing with a growing demand from electronics, automotive, and chemicals places. A robust domestic semiconductor and specialty chemicals industries are driving demand for high-purity nitric acid for etching and industrial application.
Japan is focusing on eco-friendly chemical manufacturing, as well as technology advancements in nitric acid recycling. The rising use of nitric acid in automotive coatings and precision manufacturing also supports the growth of the market.
| Country | CAGR (2025 to 2035) |
|---|---|
| Japan | 2.9% |
Progressive development of South Korea's semiconductor, electronics, and fertilizer businesses is creating a favorable scenario for the Nitric Acid market in the country. Increasing usage for high-purity nitric acid in the production of microelectronics are some of the major factors driving the growth of the market.
Demand is also bolstering due to the government policies promoting eco-friendly industrial processes and investments in chemical manufacturing units. Market growth is also being fueled by South Korea's large presence in the automotive and special chemicals industry.
| Country | CAGR (2025 to 2035) |
|---|---|
| South Korea | 2.8% |
The nitric acid market is becoming increasingly competitive as major players focus on expanding production capacity and improving efficiency to meet the growing demands of agriculture and industry. Investments in new production lines and advanced technologies are driving efforts to enhance energy efficiency and reduce emissions.
These moves highlight a strategic push to boost domestic production, address the rising need for fertilizers and industrial chemicals, and ensure a stable supply in the global market.
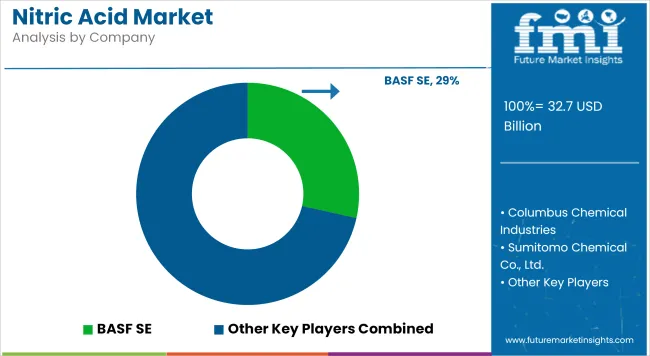
The overall market size for nitric acid market was USD 32.7 billion in 2025.
The nitric acid market is expected to reach USD 43.5 billion in 2035.
Growing demand for fertilizers in agriculture, increasing use in explosives and mining, and expanding applications in chemicals and pharmaceuticals will drive market growth.
The top 5 countries which drives the development of Nitric acid market are USA, European Union, Japan, South Korea and UK.
Adipic acid expected to grow to command significant share over the assessment period.


Full Research Suite comprises of:
Market outlook & trends analysis
Interviews & case studies
Strategic recommendations
Vendor profiles & capabilities analysis
5-year forecasts
8 regions and 60+ country-level data splits
Market segment data splits
12 months of continuous data updates
DELIVERED AS:
PDF EXCEL ONLINE
Nitric Oxide Asthma Testing Market - Growth, Demand & Forecast 2025 to 2035
Inhaled Nitric Oxide Delivery Systems Market Size and Share Forecast Outlook 2025 to 2035
Acid Resistant Pipe Market Forecast and Outlook 2025 to 2035
Acid Coil Cleaner Market Size and Share Forecast Outlook 2025 to 2035
Acid Filling and Leveling Machine Market Size and Share Forecast Outlook 2025 to 2035
Acid Chlorides Market Size and Share Forecast Outlook 2025 to 2035
Acid-Sensitive APIs Market Analysis - Size, Share, and Forecast Outlook 2025 to 2035
Acidified Whey Protein Market Analysis - Size, Share & Trends 2025 to 2035
Acid Dyes Market Growth - Trends & Forecast 2025 to 2035
Acidity Regulator Market Growth - Trends & Forecast 2025 to 2035
Acid Proof Lining Market Trends 2025 to 2035
Acid Citrate Dextrose Tube Market Trends – Growth & Industry Outlook 2024-2034
Acid Orange Market
Antacids Market Analysis – Size, Trends & Forecast 2025 to 2035
Lead Acid Battery Market Size and Share Forecast Outlook 2025 to 2035
Lead Acid Battery Recycling Market Size and Share Forecast Outlook 2025 to 2035
Feed Acidifier Market Analysis Size Share and Forecast Outlook 2025 to 2035
Food Acidulants Market Growth - Key Trends, Size & Forecast 2024 to 2034
Boric Acid Market Forecast and Outlook 2025 to 2035
Folic Acid Market Size and Share Forecast Outlook 2025 to 2035

Thank you!
You will receive an email from our Business Development Manager. Please be sure to check your SPAM/JUNK folder too.
Chat With
MaRIA