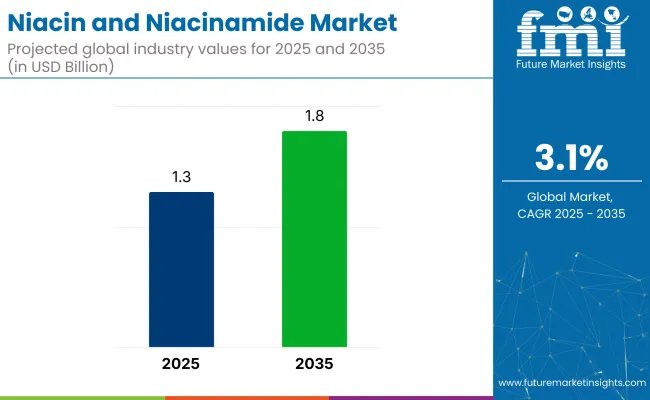
[184 Pages Report] The global niacin and niacinamide market was valued at US$ 1.2 Billion in 2021 and is expected to reach US$ 2.5 Billion by 2032. Demand in the market is poised to rise at a robust 5.2% CAGR over the forecast period (2022 to 2032). Growth in the market is underpinned by rising awareness regarding skincare and the increasing use of liquid niacinamide in the cosmetic and personal care industry.
With the growing penetration of social media and the advent of influencer marketing, the demand in the market is predicted to burgeon at a rapid pace over the upcoming decade. Niacinamide is the most essential ingredient in the skincare regime. Liquid niacinamide aids in brightening the skin, reducing acne or flaws on the skin, and also hydrates. Hence, numerous dermatologists and aestheticians prefer niacinamide as the most essential ingredient in beauty treatments.
Niacinamide also referred to as nicotinamide, is a type of vitamin B3. A lack of B3 can cause problems with the skin, kidneys, and brain. Utilizing niacinamide can help prevent B3 deficiency. Additionally, topical niacinamide may help treat skin conditions such as acne and eczema.
Attributes | Key Insights |
---|---|
Niacin and Niacinamide Market Value 2021 | US$ 1.02 Billion |
Estimated Market Size 2022 | US$ 1.23 Billion |
Projected Market Value 2032 | US$ 2.05 Billion |
CAGR 2022 to 2032 | 5.2% |
Share of Top 5 Countries | 53.5% |
Don't pay for what you don't need
Customize your report by selecting specific countries or regions and save 30%!
As per Future Market Insights (FMI), the overall sales in the niacin and niacinamide market grew at a CAGR of 5.3% between 2015 and 2021. The global niacin and niacinamide market held a share of approximately 1.0% of the overall US$ 123.1 Billion global dietary supplements market, in 2021.
Niacin has been widely used to lower lipoprotein, triglycerides, very-low-density lipoprotein (VLDL), total cholesterol, low-density lipoprotein (LDL) cholesterol, and statin drugs. Niacin is also the most effective agent for raising plasma levels of high-density lipoprotein (HDL) cholesterol. Niacin has shown in clinical trials that it can balance cardiovascular risk in people with diabetes mellitus or mixed dyslipidemia, reducing cardiovascular morbidity and death, particularly when taken with statin medications.
Throughout the forecast period, it is anticipated that the niacin and niacinamide market will grow more quickly than average due to rising consumer demand for the product due to its health benefits. These benefits include maintaining vitamin B3 and cholesterol levels, increasing the usage of skin care cosmetics, raising awareness of the consumption of healthy food supplements, and enhancing energy metabolism. Backed by this, FMI predicts the global niacin and niacinamide market to grow at a CAGR of 5.2% over the forecast period (2022 to 2032).
Increasing Use of Niacin & Niacinamide in Health Supplements to Drive the Sales
Niacin (vitamin B-03) is a substance frequently used as an antioxidant in the food and beverage industry. Niacinamide also reduces the amount of harmful free radicals, which can damage DNA and cells and raise the risk of chronic illnesses like cancer and heart disease. Hence, demand for this ingredient is expected to surge in corporate as the need for superior products to maintain a pipeline of novel products in the form of supplements or the food & beverage industry.
As a result, businesses now have the opportunity to increase their market presence. Niacin exists in two chemical forms. One type is used for pellagra or nutritional supplements, while the other is utilized for hyperlipoproteinemia or peripheral vascular disease as nicotinic acid alone (niacinamide). To reduce the global burden of skin diseases, the adoption of products with niacin and niacinamide is expected to rise over the forecast period.
Producing a new molecular entity is money-consuming and could be expensive to finish. As a result, it is projected that the market for niacin and niacinamide would be constrained by the high cost of medication research and the stringent process for regulatory clearance.
Negative side effects could result from using niacinamide at excessive dosages or without consideration for cases of moderate illnesses. As a result, it is anticipated that the rise in adverse effects brought on by inaccurate information and other unfavorable side effects would limit the growth of niacinamide demand. Nausea, vomiting, rashes, skin blistering and irritation, and allergic responses are a few minor niacinamide adverse effects.
The effectiveness of niacin in reducing the risk of heart attacks and strokes is lower in older patients with cardiovascular problems who are advised to take laropiprant and extended-release niacin.
Patients with severe hypotension, peptic ulcer disease, or liver illness should avoid excessive doses of niacin. Additionally, the supplement has been related to liver damage, can lead to hypotension, and may even result in peptic ulcers.
Rising Prevalence of Downer Cow Syndrome in the USA to Aid the Growth
The USA is considered to be the largest market for niacin and niacinamide and accounted for a market share of around 21.1% within the global niacin and niacinamide market in 2021. Growth in the market is poised to expand to the rising prevalence of downer cow syndrome (DCS) in dairy animals and an increase in pediatric obesity cases in the USA
Additionally, with the growing presence of numerous pharmaceutical and cosmeceutical businesses, the demand in the USA niacin and niacinamide market is predicted to grow over the forecast period.
Use of Niacin and Niacinamide in Beauty Products to Boost the Sales
India is an emerging market for niacin and niacinamide and accounted for a market share of 15.3% in the global niacin and niacinamide market in 2021. Due to the rapid development of chemical studies and the rising costs of healthcare in India, it is anticipated that the niacin and niacinamide market will witness lucrative growth opportunities.
With the growing expansion of the healthcare sector, India is expected to be a prominent research and development (R&D) hub for pharmaceutical manufacturers. As a result, India has improved its standing as a key influence in the international pharmaceutical sector, serving as a base for raising Research and Development while simultaneously serving as a consumer country.
Further, growing concerns regarding skincare, the adoption of niacinamide in serums is expected to boost the growth in the market. On the back of these factors, the demand in India's niacin and niacinamide market is predicted to surge at a rapid pace over the forecast period.
Increasing Use of Niacin and Niacinamide in the Pharmaceutical Sector to Push Sales
China led the East Asia niacin and niacinamide market with a share of around 7.5% in 2021. Small and major biopharmaceutical businesses are relying on the contract research organization (CRO) industry to supply research services to their Research and Development operations in recent years.
Due to the existence of multiple government-funded pharmaceutical and medical institutions with state-of-the-art equipment, clinical trial, and research are now significant industries in China. These factors are expected to make China one of the emerging niacin and niacinamide market.
Get the data you need at a Fraction of the cost
Personalize your report by choosing insights you need
and save 40%!
Dry Form to Contribute Nearly 4/5th of Sales in the Niacin and Niacinamide Market
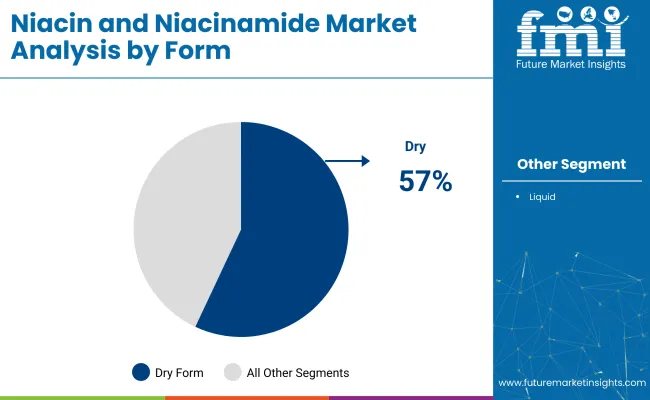
On the basis of form, the dry form of niacin and niacinamide accounted for the highest share of around 76.4% in 2021. Due to its longer shelf life and lower price than the liquid form, the dry form has the largest market share. Additionally, dry niacin and niacinamide have a quicker origin of an effect than other forms, which is what is fueling the segment's market expansion.
The acceptance of niacin and niacinamide as a preferred therapy for skin rejuvenation and the rising demand for niacin and niacinamide in improving vitamin deficiency are factors expected to raise the demand for niacin and niacinamide globally.
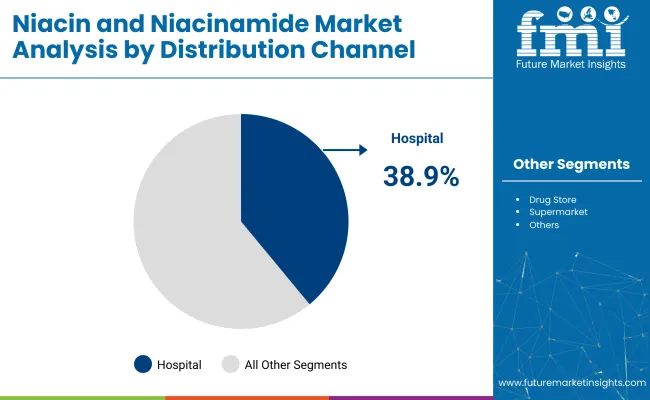
Based on distribution channels, the pharmacies & drug stores segment dominated the market for niacin and niacinamide with a share of around 64.5% in 2021. It is the most widely adopted channel for self-prescribed drugs for daily use in skin rejuvenation and other products.
Key players are concentrating on introducing a number of disruptive solutions and obtaining regulatory body approval in order to increase their product offerings. They are also concentrating on establishing new labs, concentrating on mergers and acquisitions, and infrastructure development.
For instance:
Attribute | Details |
---|---|
Estimated Market Size 2022 | US$ 1.23 Billion |
Projected Market Value 2032 | US$ 2.05 Billion |
CAGR 2022 to 2032 | 5.2% |
Forecast Period | 2022 to 2032 |
Historical Data Available for | 2015 to 2021 |
Market Analysis | USD Million for Value |
Key Regions Covered | North America; Latin America; Europe; South Asia; East Asia; Oceania; Middle East & Africa |
Key Countries Covered | USA, Canada, Brazil, Mexico, Argentina, Germany, the UK, France, Italy, Spain, Russia, BENELUX, Japan, South Korea, India, Thailand, Indonesia, Malaysia, Australia, New Zealand, Turkey, South Africa, North Africa, and GCC Countries. |
Key Segments Covered | Form, Distribution Channel, and Region |
Key Companies Profiled | Lonza Group AG; Koninklijke DSM N.V.; Bactolac Pharmaceutical Inc.; Merck KGaA; BASF SE; Foodchem International Corporation; Evonik Industries AG; Jubilant Life Sciences Limited; Vertellus Specialties Inc; Fagron NV; Others |
Report Coverage | Market Forecast, Competition Intelligence, Drivers, Restraints, Opportunities and Threats Analysis, Market Dynamics and Challenges, Strategic Growth Initiatives |
The global niacin and niacinamide market is worth US$ 1.2 Billion in 2021.
The niacin and niacinamide market is expected to reach US$ 2.5 Billion by the end of 2032, with sales revenue expected register a 5.2% CAGR.
North America holds 27.0% of the global niacin and niacinamide market in 2021.
The USA led the North America niacin and niacinamide market with a share of around 21.1% in 2021.
Japan Niacin and niacinamide market is expected to account for a demand share of 5.4% in 2021.
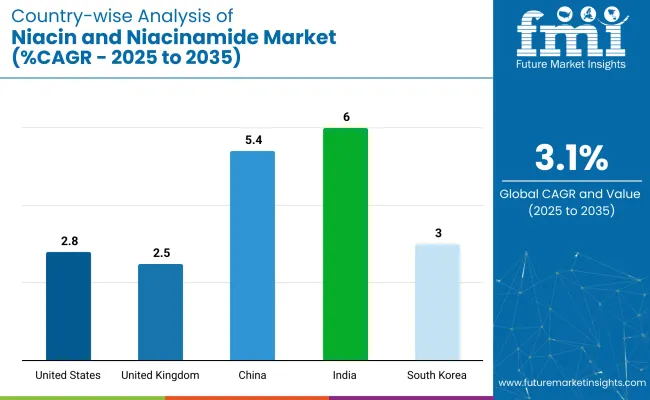
USA, India, China, Japan and Germany are the top 5 countries that are driving the demand for niacin and niacinamide market.
From 2015 to 2021, the market for niacin and niacinamide expanded at the rate of 5.3%.
Germany held a global share of around 4.2% in 2021 in the niacin and niacinamide industry space.
1. Executive Summary | Niacin and Niacinamide Market 1.1. Global Market Outlook 1.2. Demand Side Trends 1.3. Supply Side Trends 1.4. Analysis and Recommendations 2. Market Overview 2.1. Market Coverage / Taxonomy 2.2. Market Definition / Scope / Limitations 2.3. Inclusions and Exclusions 3. Key Market Trends 3.1. Key Trends Impacting the Market 3.2. Innovation / Development Trends 4. Key Success Factors 4.1. Disease Epidemiology 4.2. Recent Product Launches 4.3. Regulatory Scenario 4.4. Product Adoption Analysis 4.5. Patient Treatment Journey 4.6. PESTLE Analysis 4.7. Porter’s Analysis 4.8. Key Promotional Strategies - by Key Manufacturers 5. Market Background 5.1. Macro-Economic Factors 5.1.1. Global GDP Growth Outlook 5.1.2. Global Healthcare Spending Outlook 5.1.3. Global Dietary Supplements Market Outlook 5.2. Forecast Factors - Relevance & Impact 5.2.1. Increasing Cases of Skin Allergies 5.2.2. Growing Advancements in Fields of Health and Nutrition 5.2.3. High Global Prevalence of Acne 5.2.4. Impact of Regulatory Control on Supplement Usage Limit 5.2.5. Product Availability and Outreach 5.2.6. Growing Disposable Income 5.2.7. Product Adoption 5.2.8. Increase in Research and Development spending 5.3. Market Dynamics 5.3.1. Drivers 5.3.2. Restraints 5.3.3. Opportunity Analysis 6. COVID-19 Crisis Analysis 6.1. COVID-19 and Impact Analysis 6.1.1. Revenue By Form 6.1.2. Revenue By Distribution Channel 6.1.3. Revenue By Country 6.2. 2021 Market Scenario 7. Global Market Demand (in Value or Size in US$ Million) Analysis 2015 to 2021 and Forecast, 2022 to 2032 7.1. Historical Market Value (US$ Million) Analysis, 2015 to 2021 7.2. Current and Future Market Value (US$ Million) Projections, 2022 to 2032 7.2.1. Y-o-Y Growth Trend Analysis 7.2.2. Absolute $ Opportunity Analysis 8. Global Market Analysis 2015 to 2021 and Forecast 2022 to 2032, by Form 8.1. Introduction / Key Findings 8.2. Historical Market Size (US$ Million), By Form, 2015 to 2021 8.3. Current and Future Market Size (US$ Million) Analysis and Forecast, By Form, 2022 to 2032 8.3.1. Dry 8.3.2. Liquid 8.4. Market Attractiveness Analysis By Form 9. Global Market Analysis 2015 to 2021 and Forecast 2022 to 2032, by Distribution Channel 9.1. Introduction / Key Findings 9.2. Historical Market Size (US$ Million), By Distribution Channel, 2015 to 2021 9.3. Current and Future Market Size (US$ Million) and Forecast By Distribution Channel, 2022 to 2032 9.3.1. Pharmacies & Drug Stores 9.3.2. Hyper Markets and Super Market 9.3.3. Others 9.4. Market Attractiveness Analysis By Distribution Channel 10. Global Market Analysis 2015 to 2021 and Forecast 2022 to 2032, by Region 10.1. Introduction 10.2. Historical Market Size (US$ Million) Analysis By Region, 2015 to 2021 10.3. Current and Future Market Size (US$ Million) and Forecast By Region, 2022 to 2032 10.3.1. North America 10.3.2. Latin America 10.3.3. Europe 10.3.4. East Asia 10.3.5. South Asia 10.3.6. Oceania 10.3.7. Middle East and Africa (MEA) 10.4. Market Attractiveness Analysis By Region 11. North America Market Analysis 2015 to 2021 and Forecast 2022 to 2032 11.1. Introduction 11.2. Historical Market Size (US$ Million) Analysis By Market Taxonomy, 2015 to 2021 11.3. Current and Future Market Size (US$ Million) Analysis and Forecast By Market Taxonomy, 2022 to 2032 11.3.1. By Country 11.3.1.1. United States of America 11.3.1.2. Canada 11.3.2. By Form 11.3.3. By Distribution Channel 11.4. Market Attractiveness Analysis 11.4.1. By Country 11.4.2. By Form 11.4.3. By Distribution Channel 11.5. Market Trends 11.6. Key Market Participants - Intensity Mapping 11.7. Drivers and Restraints - Impact Analysis 11.8. Country-Level Analysis & Forecast 11.8.1. USA Market Analysis 11.8.1.1. Introduction 11.8.1.2. Market Analysis and Forecast by Market Taxonomy 11.8.1.2.1. By Form 11.8.1.2.2. By Distribution Channel 11.8.2. Canada Market Analysis 11.8.2.1. Introduction 11.8.2.2. Market Analysis and Forecast by Market Taxonomy 11.8.2.2.1. By Form 11.8.2.2.2. By Distribution Channel 12. Latin America Market Analysis 2015 to 2021 and Forecast 2022 to 2032 12.1. Introduction 12.2. Historical Market Size (US$ Million) Analysis By Market Taxonomy, 2015 to 2021 12.3. Current and Future Market Size (US$ Million) Analysis and Forecast By Market Taxonomy, 2022 to 2032 12.3.1. By Country 12.3.1.1. Mexico 12.3.1.2. Brazil 12.3.1.3. Argentina 12.3.1.4. Rest of Latin America 12.3.2. By Form 12.3.3. By Distribution Channel 12.4. Market Attractiveness Analysis 12.4.1. By Country 12.4.2. By Form 12.4.3. By Distribution Channel 12.5. Market Trends 12.6. Key Market Participants - Intensity Mapping 12.7. Drivers and Restraints - Impact Analysis 12.8. Country-Level Analysis & Forecast 12.8.1. Mexico Market Analysis 12.8.1.1. Introduction 12.8.1.2. Market Analysis and Forecast by Market Taxonomy 12.8.1.2.1. By Form 12.8.1.2.2. By Distribution Channel 12.8.2. Brazil Market Analysis 12.8.2.1. Introduction 12.8.2.2. Market Analysis and Forecast by Market Taxonomy 12.8.2.2.1. By Form 12.8.2.2.2. By Distribution Channel 12.8.3. Argentina Market Analysis 12.8.3.1. Introduction 12.8.3.2. Market Analysis and Forecast by Market Taxonomy 12.8.3.2.1. By Form 12.8.3.2.2. By Distribution Channel 13. Europe Market Analysis 2015 to 2021 and Forecast 2022 to 2032 13.1. Introduction 13.2. Historical Market Size (US$ Million) Analysis By Market Taxonomy, 2015 to 2021 13.3. Current and Future Market Size (US$ Million) Analysis and Forecast By Market Taxonomy, 2022 to 2032 13.3.1. By Country 13.3.1.1. Germany 13.3.1.2. Italy 13.3.1.3. France 13.3.1.4. United Kingdom 13.3.1.5. Spain 13.3.1.6. BENELUX 13.3.1.7. Russia 13.3.1.8. Rest of Europe 13.3.2. By Form 13.3.3. By Distribution Channel 13.4. Market Attractiveness Analysis 13.4.1. By Country 13.4.2. By Form 13.4.3. By Distribution Channel 13.5. Market Trends 13.6. Key Market Participants - Intensity Mapping 13.7. Drivers and Restraints - Impact Analysis 13.8. Country-Level Analysis & Forecast 13.8.1. Germany Market Analysis 13.8.1.1. Introduction 13.8.1.2. Market Analysis and Forecast by Market Taxonomy 13.8.1.2.1. By Form 13.8.1.2.2. By Distribution Channel 13.8.2. Italy Market Analysis 13.8.2.1. Introduction 13.8.2.2. Market Analysis and Forecast by Market Taxonomy 13.8.2.2.1. By Form 13.8.2.2.2. By Distribution Channel 13.8.3. France Market Analysis 13.8.3.1. Introduction 13.8.3.2. Market Analysis and Forecast by Market Taxonomy 13.8.3.2.1. By Form 13.8.3.2.2. By Distribution Channel 13.8.4. UK Market Analysis 13.8.4.1. Introduction 13.8.4.2. Market Analysis and Forecast by Market Taxonomy 13.8.4.2.1. By Form 13.8.4.2.2. By Distribution Channel 13.8.5. Spain Market Analysis 13.8.5.1. Introduction 13.8.5.2. Market Analysis and Forecast by Market Taxonomy 13.8.5.2.1. By Form 13.8.5.2.2. By Distribution Channel 13.8.6. BENELUX Market Analysis 13.8.6.1. Introduction 13.8.6.2. Market Analysis and Forecast by Market Taxonomy 13.8.6.2.1. By Form 13.8.6.2.2. By Distribution Channel 13.8.7. Russia Market Analysis 13.8.7.1. Introduction 13.8.7.2. Market Analysis and Forecast by Market Taxonomy 13.8.7.2.1. By Form 13.8.7.2.2. By Distribution Channel 14. East Asia Market Analysis 2015 to 2021 and Forecast 2022 to 2032 14.1. Introduction 14.2. Historical Market Size (US$ Million) Analysis By Market Taxonomy, 2015 to 2021 14.3. Current and Future Market Size (US$ Million) Analysis and Forecast By Market Taxonomy, 2022 to 2032 14.3.1. By Country 14.3.1.1. China 14.3.1.2. Japan 14.3.1.3. South Korea 14.3.2. By Form 14.3.3. By Distribution Channel 14.4. Market Attractiveness Analysis 14.4.1. By Country 14.4.2. By Form 14.4.3. By Distribution Channel 14.5. Market Trends 14.6. Key Market Participants - Intensity Mapping 14.7. Drivers and Restraints - Impact Analysis 14.8. Country-Level Analysis & Forecast 14.8.1. China Market Analysis 14.8.1.1. Introduction 14.8.1.2. Market Analysis and Forecast by Market Taxonomy 14.8.1.2.1. By Form 14.8.1.2.2. By Distribution Channel 14.8.2. Japan Market Analysis 14.8.2.1. Introduction 14.8.2.2. Market Analysis and Forecast by Market Taxonomy 14.8.2.2.1. By Form 14.8.2.2.2. By Distribution Channel 14.8.3. South Korea Market Analysis 14.8.3.1. Introduction 14.8.3.2. Market Analysis and Forecast by Market Taxonomy 14.8.3.2.1. By Form 14.8.3.2.2. By Distribution Channel 15. South Asia Market Analysis 2015 to 2021 and Forecast 2022 to 2032 15.1. Introduction 15.2. Historical Market Size (US$ Million) Analysis By Market Taxonomy, 2015 to 2021 15.3. Current and Future Market Size (US$ Million) Analysis and Forecast By Market Taxonomy, 2022 to 2032 15.3.1. By Country 15.3.1.1. India 15.3.1.2. Indonesia 15.3.1.3. Malaysia 15.3.1.4. Thailand 15.3.1.5. Rest of South Asia 15.3.2. By Form 15.3.3. By Distribution Channel 15.4. Market Attractiveness Analysis 15.4.1. By Country 15.4.2. By Form 15.4.3. By Distribution Channel 15.5. Market Trends 15.6. Key Market Participants - Intensity Mapping 15.7. Drivers and Restraints - Impact Analysis 15.8. Country-Level Analysis & Forecast 15.8.1. India Market Analysis 15.8.1.1. Introduction 15.8.1.2. Market Analysis and Forecast by Market Taxonomy 15.8.1.2.1. By Form 15.8.1.2.2. By Distribution Channel 15.8.2. Indonesia Market Analysis 15.8.2.1. Introduction 15.8.2.2. Market Analysis and Forecast by Market Taxonomy 15.8.2.2.1. By Form 15.8.2.2.2. By Distribution Channel 15.8.3. Malaysia Market Analysis 15.8.3.1. Introduction 15.8.3.2. Market Analysis and Forecast by Market Taxonomy 15.8.3.2.1. By Form 15.8.3.2.2. By Distribution Channel 15.8.4. Thailand Market Analysis 15.8.4.1. Introduction 15.8.4.2. Market Analysis and Forecast by Market Taxonomy 15.8.4.2.1. By Form 15.8.4.2.2. By Distribution Channel 16. Oceania Market 2015 to 2021 and Forecast 2022 to 2032 16.1. Introduction 16.2. Historical Market Size (US$ Million) Analysis By Market Taxonomy, 2015 to 2021 16.3. Current and Future Market Size (US$ Million) Analysis and Forecast By Market Taxonomy, 2022 to 2032 16.3.1. By Country 16.3.1.1. Australia 16.3.1.2. New Zealand 16.3.2. By Form 16.3.3. By Distribution Channel 16.4. Market Attractiveness Analysis 16.4.1. By Country 16.4.2. By Form 16.4.3. By Distribution Channel 16.5. Market Trends 16.6. Key Market Participants - Intensity Mapping 16.7. Drivers and Restraints - Impact Analysis 16.8. Country-Level Analysis & Forecast 16.8.1. Australia Market Analysis 16.8.1.1. Introduction 16.8.1.2. Market Analysis and Forecast by Market Taxonomy 16.8.1.2.1. By Form 16.8.1.2.2. By Distribution Channel 16.8.2. New Zealand Market Analysis 16.8.2.1. Introduction 16.8.2.2. Market Analysis and Forecast by Market Taxonomy 16.8.2.2.1. By Form 16.8.2.2.2. By Distribution Channel 17. Middle East and Africa (MEA) Market Analysis 2015 to 2021 and Forecast 2022 to 2032 17.1. Introduction 17.2. Historical Market Size (US$ Million) Analysis By Market Taxonomy, 2015 to 2021 17.3. Current and Future Market Size (US$ Million) Analysis and Forecast By Market Taxonomy, 2022 to 2032 17.3.1. By Country 17.3.1.1. GCC Countries 17.3.1.2. Turkey 17.3.1.3. South Africa 17.3.1.4. North Africa 17.3.1.5. Rest of Middle East and Africa 17.3.2. By Form 17.3.3. By Distribution Channel 17.4. Market Attractiveness Analysis 17.4.1. By Country 17.4.2. By Form 17.4.3. By Distribution Channel 17.5. Market Trends 17.6. Key Market Participants - Intensity Mapping 17.7. Drivers and Restraints - Impact Analysis 17.8. Country-Level Analysis & Forecast 17.8.1. GCC Countries Market Analysis 17.8.1.1. Introduction 17.8.1.2. Market Analysis and Forecast by Market Taxonomy 17.8.1.2.1. By Form 17.8.1.2.2. By Distribution Channel 17.8.2. Turkey Market Analysis 17.8.2.1. Introduction 17.8.2.2. Market Analysis and Forecast by Market Taxonomy 17.8.2.2.1. By Form 17.8.2.2.2. By Distribution Channel 17.8.3. South Africa Market Analysis 17.8.3.1. Introduction 17.8.3.2. Market Analysis and Forecast by Market Taxonomy 17.8.3.2.1. By Form 17.8.3.2.2. By Distribution Channel 17.8.4. North Africa Market Analysis 17.8.4.1. Introduction 17.8.4.2. Market Analysis and Forecast by Market Taxonomy 17.8.4.2.1. By Form 17.8.4.2.2. By Distribution Channel 18. Market Structure Analysis 18.1. Market Analysis by Tier of Companies 18.2. Market Share Analysis of Top Players 18.3. Market Concentration 18.4. Market Presence Analysis 18.4.1. Regional Footprint Analysis 18.4.2. Form Footprint Analysis 18.4.3. Channel Footprint Analysis 19. Competition Analysis 19.1. Competition Dashboard 19.2. Competition Benchmarking 19.3. Competition Deep Dive 19.3.1. Lonza Group AG 19.3.1.1. Overview 19.3.1.2. Form Portfolio 19.3.1.3. Sales Footprint 19.3.1.4. Key Developments 19.3.1.5. Key Financials 19.3.1.6. SWOT Analysis 19.3.1.7. Strategy Overview 19.3.1.7.1. Marketing Strategies 19.3.1.7.2. Form Strategies 19.3.1.7.3. Channel Strategies 19.3.2. Koninklijke DSM N.V. 19.3.2.1. Overview 19.3.2.2. Form Portfolio 19.3.2.3. Sales Footprint 19.3.2.4. Key Developments 19.3.2.5. Key Financials 19.3.2.6. SWOT Analysis 19.3.2.7. Strategy Overview 19.3.2.7.1. Marketing Strategies 19.3.2.7.2. Form Strategies 19.3.2.7.3. Channel Strategies 19.3.3. Bactolac Pharmaceutical Inc. 19.3.3.1. Overview 19.3.3.2. Form Portfolio 19.3.3.3. Sales Footprint 19.3.3.4. Key Developments 19.3.3.5. Key Financials 19.3.3.6. SWOT Analysis 19.3.3.7. Strategy Overview 19.3.3.7.1. Marketing Strategies 19.3.3.7.2. Form Strategies 19.3.3.7.3. Channel Strategies 19.3.4. Merck KGaA 19.3.4.1. Overview 19.3.4.2. Form Portfolio 19.3.4.3. Sales Footprint 19.3.4.4. Key Developments 19.3.4.5. Key Financials 19.3.4.6. SWOT Analysis 19.3.4.7. Strategy Overview 19.3.4.7.1. Marketing Strategies 19.3.4.7.2. Form Strategies 19.3.4.7.3. Channel Strategies 19.3.5. BASF SE 19.3.5.1. Overview 19.3.5.2. Form Portfolio 19.3.5.3. Sales Footprint 19.3.5.4. Key Developments 19.3.5.5. Key Financials 19.3.5.6. SWOT Analysis 19.3.5.7. Strategy Overview 19.3.5.7.1. Marketing Strategies 19.3.5.7.2. Form Strategies 19.3.5.7.3. Channel Strategies 19.3.6. Foodchem International Corporation 19.3.6.1. Overview 19.3.6.2. Form Portfolio 19.3.6.3. Sales Footprint 19.3.6.4. Key Developments 19.3.6.5. Key Financials 19.3.6.6. SWOT Analysis 19.3.6.7. Strategy Overview 19.3.6.7.1. Marketing Strategies 19.3.6.7.2. Form Strategies 19.3.6.7.3. Channel Strategies 19.3.7. Evonik Industries AG 19.3.7.1. Overview 19.3.7.2. Form Portfolio 19.3.7.3. Sales Footprint 19.3.7.4. Key Developments 19.3.7.5. Key Financials 19.3.7.6. SWOT Analysis 19.3.7.7. Strategy Overview 19.3.7.7.1. Marketing Strategies 19.3.7.7.2. Form Strategies 19.3.7.7.3. Channel Strategies 19.3.8. Jubilant Life Sciences Limited 19.3.8.1. Overview 19.3.8.2. Form Portfolio 19.3.8.3. Sales Footprint 19.3.8.4. Key Developments 19.3.8.5. Key Financials 19.3.8.6. SWOT Analysis 19.3.8.7. Strategy Overview 19.3.8.7.1. Marketing Strategies 19.3.8.7.2. Form Strategies 19.3.8.7.3. Channel Strategies 19.3.9. Vertellus Specialties Inc. 19.3.9.1. Overview 19.3.9.2. Form Portfolio 19.3.9.3. Sales Footprint 19.3.9.4. Key Developments 19.3.9.5. Key Financials 19.3.9.6. SWOT Analysis 19.3.9.7. Strategy Overview 19.3.9.7.1. Marketing Strategies 19.3.9.7.2. Form Strategies 19.3.9.7.3. Channel Strategies 19.3.10. Fagron NV 19.3.10.1. Overview 19.3.10.2. Form Portfolio 19.3.10.3. Sales Footprint 19.3.10.4. Key Developments 19.3.10.5. Key Financials 19.3.10.6. SWOT Analysis 19.3.10.7. Strategy Overview 19.3.10.7.1. Marketing Strategies 19.3.10.7.2. Form Strategies 19.3.10.7.3. Channel Strategies 19.3.11. Others 19.3.11.1. Overview 19.3.11.2. Form Portfolio 19.3.11.3. Sales Footprint 19.3.11.4. Key Developments 19.3.11.5. Key Financials 19.3.11.6. SWOT Analysis 19.3.11.7. Strategy Overview 19.3.11.7.1. Marketing Strategies 19.3.11.7.2. Form Strategies 19.3.11.7.3. Channel Strategies 20. Assumptions and Acronyms Used 21. Research Methodology
Explore Healthcare Insights
View Reports