The Network Telemetry Market is estimated to be valued at USD 563.7 million in 2025 and is projected to reach USD 2320.4 million by 2035, registering a compound annual growth rate (CAGR) of 15.2% over the forecast period.
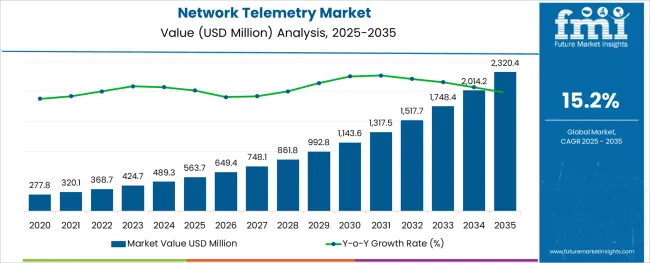
The network telemetry market is witnessing accelerated momentum as organizations prioritize real-time network monitoring, operational intelligence, and enhanced security analytics in increasingly complex digital environments. The growing adoption of cloud-native infrastructure, software-defined networking (SDN), and multi-cloud strategies has amplified the need for advanced telemetry solutions capable of capturing granular data across distributed systems.
Current market dynamics reflect a steady increase in enterprise and service provider investments directed towards scalable telemetry frameworks that enable proactive network management, anomaly detection, and traffic optimization. Looking ahead, the market outlook remains optimistic, supported by surging demand for AI-integrated telemetry tools, automated analytics platforms, and edge computing-compatible solutions.
The shift towards zero-trust architectures and encrypted traffic monitoring is expected to further strengthen the application of network telemetry across industry verticals, including finance, healthcare, manufacturing, and telecom. Enhanced capabilities for predictive maintenance, network capacity planning, and real-time visibility into user experiences will be pivotal in shaping market expansion, while continuous innovation by technology vendors ensures sustained long-term growth opportunities.
The market is segmented by Organization Size, End User, and Component and region. By Organization Size, the market is divided into Large Enterprises and Small And Medium-Sized Enterprises. In terms of End User, the market is classified into Service Providers and Verticals. Based on Component, the market is segmented into Solutions and Services. Regionally, the market is classified into North America, Latin America, Western Europe, Eastern Europe, Balkan & Baltic Countries, Russia & Belarus, Central Asia, East Asia, South Asia & Pacific, and the Middle East & Africa.
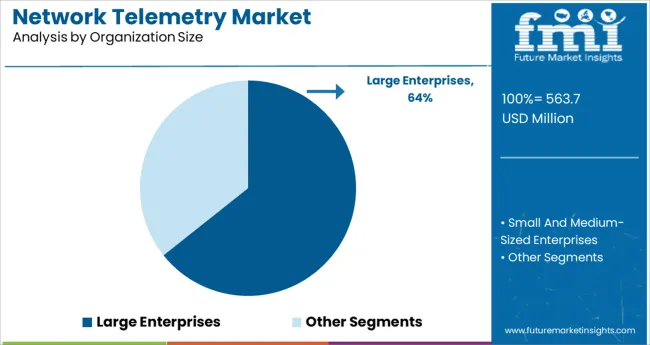
The large enterprises segment captured a commanding 64.3% market share within the organization size category, reflecting the significant reliance of large-scale organizations on comprehensive network telemetry solutions to support complex, geographically dispersed infrastructures. These enterprises prioritize sophisticated telemetry tools that offer deep packet visibility, advanced anomaly detection, and proactive incident response capabilities to safeguard business-critical operations.
Rising data volumes, hybrid network models, and increasingly stringent compliance requirements have positioned network telemetry as a core component of enterprise IT strategies. The segment’s dominance is reinforced by substantial IT budgets and a strong emphasis on digital transformation initiatives, where telemetry solutions are integrated with network automation, AI-based analytics, and cloud-native management platforms.
Enterprise adoption is further driven by the necessity to support growing remote workforces, distributed applications, and mission-critical workloads across hybrid and multi-cloud environments. Anticipated growth will likely stem from continuous investments in AI-enhanced telemetry and scalable SaaS-based offerings designed to deliver end-to-end network observability and operational resilience.
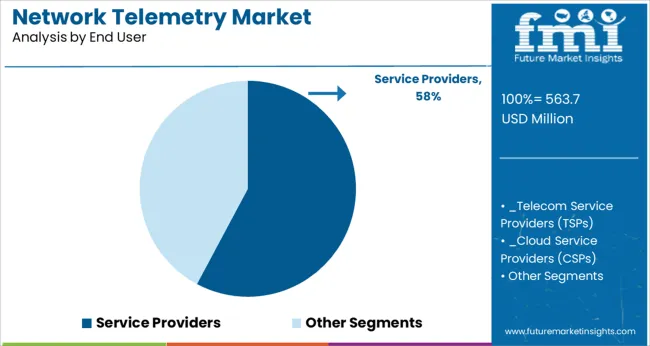
The service providers segment accounted for 57.8% of the network telemetry market share by end user, underlining the strategic role of telemetry solutions in maintaining the reliability, security, and performance of large-scale carrier and cloud service infrastructures. Telecom operators, internet service providers, and managed service providers deploy telemetry systems to monitor vast, high-speed, and complex networks with the objective of optimizing service delivery and preventing operational disruptions.
Growing data traffic, increased adoption of 5G, and the expansion of IoT ecosystems have intensified the demand for granular network insights and real-time fault detection capabilities. Service providers leverage telemetry tools for dynamic bandwidth allocation, capacity planning, and proactive issue resolution, essential for ensuring service-level agreements (SLAs) and enhancing customer satisfaction.
The segment's sustained growth is further supported by investments in edge computing networks, virtualized network functions, and secure cloud interconnections, with service providers adopting telemetry frameworks as integral components of their digital infrastructure modernization strategies.
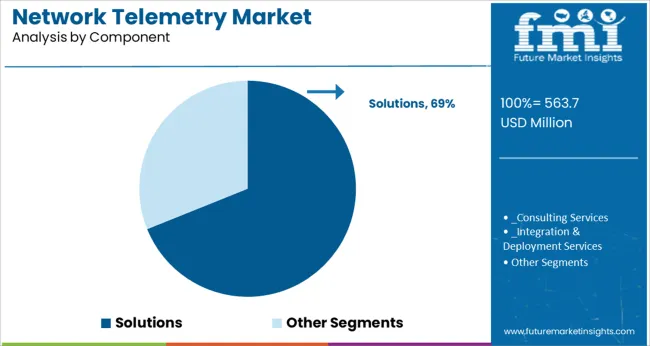
The solutions segment held a dominant 68.9% market share in the network telemetry market’s component category, underscoring the growing enterprise and service provider preference for integrated, vendor-supported telemetry platforms that deliver advanced analytics, visualization, and actionable insights. Solutions offerings encompass comprehensive telemetry software suites, network monitoring dashboards, and analytics engines capable of aggregating and analyzing vast amounts of telemetry data from routers, switches, firewalls, and cloud environments.
The segment’s leadership is driven by the critical need for end-to-end network visibility, early anomaly detection, and performance optimization within dynamic, distributed, and security-sensitive network environments. Organizations increasingly opt for scalable, AI-enhanced, and cloud-compatible telemetry solutions that support real-time decision-making and automated incident management.
Growth in this segment is also attributed to the rapid evolution of hybrid IT infrastructures and the rising integration of telemetry platforms with SIEM, AIOps, and cloud management tools, ensuring sustained demand for holistic, interoperable, and customizable telemetry solutions over the forecast period.
Increased funding for the growth and development of advanced and automated technology/machinery to manage large volumes of structured and unstructured data has resulted from an increase in strategic market alliances, boosting the demand for network telemetry.
Increased investment in Research and Development capabilities would pave the path for information technology advances. The network telemetry market will benefit even more from the increased integration of artificial intelligence and machine learning technology. One of the factors driving the network telemetry market growth is the increasing number of small and medium-sized businesses around the world.
In other words, the market's growth rate is directly influenced by the increased number of retail and e-commerce, banking, financial services, and insurance (BFSI), education, government and public sector, healthcare and life sciences, manufacturing, energy and utilities, telecommunications, and IT industries.
The growth of network telemetry market value is fueled by rising modernization, urbanization, and globalization. Rising investment in labor management and quality control, as well as a strengthening IT industry in developing nations like India and China, would provide a plethora of prospects for network telemetry market expansion.
Other network telemetry market growth variables include the expansion of industrial infrastructure and the rising necessity to manage compliance contracts and rules. Furthermore, in the projected period, the increasing spread of high-speed internet in developing economies would provide profitable prospects for network telemetry market players.
The growing need to defend an organization's network from unauthorized and unusual strikes will drive the market's future expansion.
The network telemetry market's expansion will be hampered by a lack of technical skills. Furthermore, many companies are unaware of the technology's existence, which will limit the adoption of network telemetry. Furthermore, the cessation of corporate activity due to the coronavirus pandemic will generate new obstacles.
The network telemetry market is segmented into components, organizational size, end-use, and region.
According to FMI, based on the component, the solution segment has the highest potential in the network telemetry market, with an anticipated CAGR of 14.6% during the forecast period. This growth can be due to the widespread adoption of network telemetry solutions among businesses and service providers. The benefit of network telemetry solutions is that they lower network management expenses, while also lowering IT expenditures.
Service providers are likely to hold a greater market share in the network telemetry market by end-user, with a CAGR of 15% expected over the forecast period. Telecom and Cloud Service Providers (CSPs) are increasingly using network telemetry systems to manage, analyze, and improve their whole network infrastructure.
Advanced network telemetry systems can help with network capacity planning and management, as well as provide protection against malware and DDoS attacks. Service providers are projected to seek network telemetry solutions as a result of such essential issues.
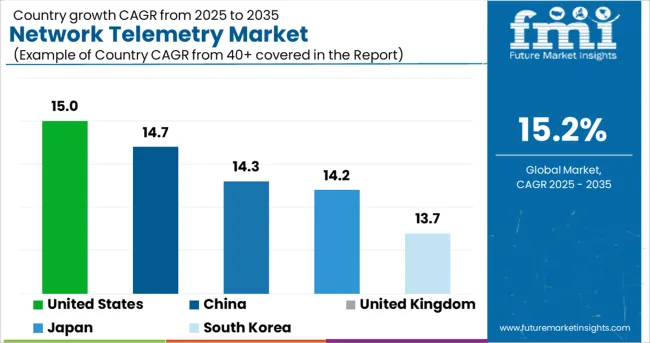
| Regions | CAGR (2025 to 2035) |
|---|---|
| United States | 15% |
| United Kingdom | 14.3% |
| China | 14.7% |
| Japan | 14.2% |
| South Korea | 13.7% |
Due to the rapid adoption of modern technologies and infrastructure that helps them virtualize their IT infrastructure and permit improved network management, the USA is predicted to develop at the fastest CAGR of 15% throughout the projection period. Rapid changes in IT architecture, such as cloud and virtualization, have put a great amount of demand on network administrators to manage their networks.
The demand for network telemetry solutions is likely to rise across verticals and service providers as a result. During the forecast period, China and Japan will continue to have significant growth, with CAGRs of 14.7% and 14.2%, respectively.
This is due to the growing rate of economic digitalization, increased real estate industry application, and increased investments in the construction of IT infrastructure in this region. As a result, players in the global network telemetry market will focus on increasing their business potential in the region, while also attempting to grow into new regions.
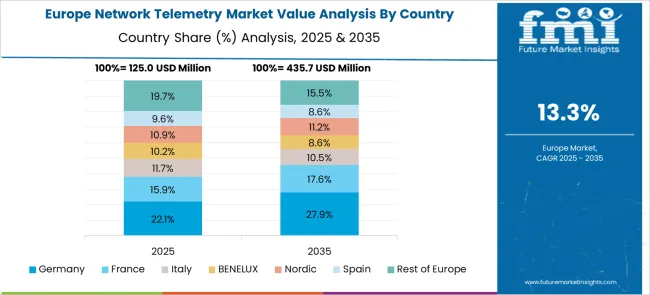
Due to the increased adoption of telemetry solutions for cloud network analysis and security management, the network telemetry market in Europe held a large revenue share of over 25% in 2020. The increased use of telemetry technologies to assist data center virtualization in the United Kingdom and Germany has boosted market growth.
European cloud computing SMEs are increasingly embracing telemetry technologies for effective network management and the reduction of cybersecurity regulation violations, which is affecting the market growth.
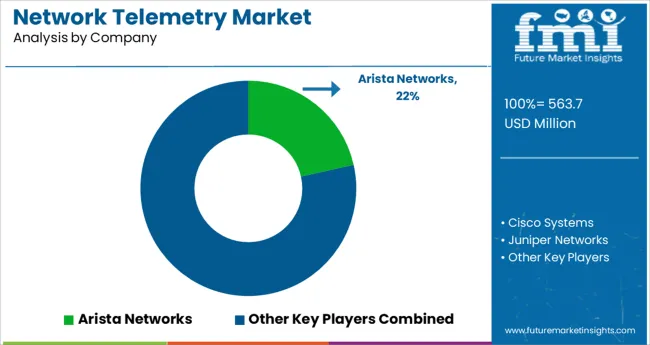
Players in the network telemetry market are primarily focused on the creation of creative and efficient goods. The findings illustrate how rivals are capitalizing on the potential in the network telemetry market. The following are some of the most recent advancements in the network telemetry market:
The global network telemetry market is estimated to be valued at USD 563.7 million in 2025.
It is projected to reach USD 2,320.4 million by 2035.
The market is expected to grow at a 15.2% CAGR between 2025 and 2035.
The key product types are large enterprises and small and medium-sized enterprises.
service providers segment is expected to dominate with a 57.8% industry share in 2025.


Our Research Products

The "Full Research Suite" delivers actionable market intel, deep dives on markets or technologies, so clients act faster, cut risk, and unlock growth.

The Leaderboard benchmarks and ranks top vendors, classifying them as Established Leaders, Leading Challengers, or Disruptors & Challengers.

Locates where complements amplify value and substitutes erode it, forecasting net impact by horizon

We deliver granular, decision-grade intel: market sizing, 5-year forecasts, pricing, adoption, usage, revenue, and operational KPIs—plus competitor tracking, regulation, and value chains—across 60 countries broadly.

Spot the shifts before they hit your P&L. We track inflection points, adoption curves, pricing moves, and ecosystem plays to show where demand is heading, why it is changing, and what to do next across high-growth markets and disruptive tech

Real-time reads of user behavior. We track shifting priorities, perceptions of today’s and next-gen services, and provider experience, then pace how fast tech moves from trial to adoption, blending buyer, consumer, and channel inputs with social signals (#WhySwitch, #UX).

Partner with our analyst team to build a custom report designed around your business priorities. From analysing market trends to assessing competitors or crafting bespoke datasets, we tailor insights to your needs.
Supplier Intelligence
Discovery & Profiling
Capacity & Footprint
Performance & Risk
Compliance & Governance
Commercial Readiness
Who Supplies Whom
Scorecards & Shortlists
Playbooks & Docs
Category Intelligence
Definition & Scope
Demand & Use Cases
Cost Drivers
Market Structure
Supply Chain Map
Trade & Policy
Operating Norms
Deliverables
Buyer Intelligence
Account Basics
Spend & Scope
Procurement Model
Vendor Requirements
Terms & Policies
Entry Strategy
Pain Points & Triggers
Outputs
Pricing Analysis
Benchmarks
Trends
Should-Cost
Indexation
Landed Cost
Commercial Terms
Deliverables
Brand Analysis
Positioning & Value Prop
Share & Presence
Customer Evidence
Go-to-Market
Digital & Reputation
Compliance & Trust
KPIs & Gaps
Outputs
Full Research Suite comprises of:
Market outlook & trends analysis
Interviews & case studies
Strategic recommendations
Vendor profiles & capabilities analysis
5-year forecasts
8 regions and 60+ country-level data splits
Market segment data splits
12 months of continuous data updates
DELIVERED AS:
PDF EXCEL ONLINE
Network Simulator Software Market Size and Share Forecast Outlook 2025 to 2035
Network Connectivity Tester Market Size and Share Forecast Outlook 2025 to 2035
Network Analyzers Market Size and Share Forecast Outlook 2025 to 2035
Network as a Service (NaaS) Market Size and Share Forecast Outlook 2025 to 2035
Network Analytics Market Size and Share Forecast Outlook 2025 to 2035
Network Devices Market Size and Share Forecast Outlook 2025 to 2035
Network Sandboxing Market Size and Share Forecast Outlook 2025 to 2035
Network Access Control (NAC) Market Size and Share Forecast Outlook 2025 to 2035
Network Monitoring Market Size and Share Forecast Outlook 2025 to 2035
Network Encryption Market Size and Share Forecast Outlook 2025 to 2035
Network Packet Broker Market Size and Share Forecast Outlook 2025 to 2035
Network Traffic Analytics Market Size and Share Forecast Outlook 2025 to 2035
Network Function Virtualization (NFV) Market Size and Share Forecast Outlook 2025 to 2035
Network Cable Tester Market Size and Share Forecast Outlook 2025 to 2035
Network Point-of-Care Glucose Testing Market Size and Share Forecast Outlook 2025 to 2035
Network Forensics Market Size and Share Forecast Outlook 2025 to 2035
Network Security Policy Management Market Size and Share Forecast Outlook 2025 to 2035
Network Probe Market Size and Share Forecast Outlook 2025 to 2035
Network Traffic Analysis Solutions Market Size and Share Forecast Outlook 2025 to 2035
Network Slicing Market Size and Share Forecast Outlook 2025 to 2035

Thank you!
You will receive an email from our Business Development Manager. Please be sure to check your SPAM/JUNK folder too.
Chat With
MaRIA