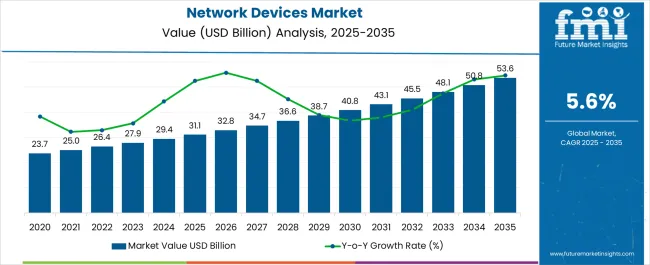
The Network Devices Market is estimated to be valued at USD 31.1 billion in 2025 and is projected to reach USD 53.6 billion by 2035, registering a compound annual growth rate (CAGR) of 5.6% over the forecast period.

| Metric | Value |
|---|---|
| Network Devices Market Estimated Value in (2025 E) | USD 31.1 billion |
| Network Devices Market Forecast Value in (2035 F) | USD 53.6 billion |
| Forecast CAGR (2025 to 2035) | 5.6% |
The network devices market is expanding steadily as digital transformation accelerates across industries and consumer environments. Rising demand for high speed connectivity, the proliferation of smart devices, and the increasing reliance on cloud services are driving adoption of advanced networking hardware.
Continuous improvements in wireless standards, energy efficient designs, and device interoperability are enhancing the role of network devices in both enterprise and residential ecosystems. Government initiatives to strengthen digital infrastructure and the growing popularity of remote working and e learning models are further amplifying the need for reliable networking solutions.
The outlook remains favorable as businesses and households prioritize seamless data transmission, secure connections, and scalable device integration to support evolving connectivity requirements.
The routers segment is projected to hold 54.20% of total revenue by 2025 within the device type category, making it the leading segment. Its prominence is attributed to the increasing demand for uninterrupted internet access, growing adoption of smart home ecosystems, and reliance on robust connectivity for enterprise operations.
Routers enable efficient bandwidth allocation, secure networking, and multi device support, aligning with the rising use of streaming, remote work, and IoT applications. The integration of advanced features such as dual band technology, mesh networking, and enhanced security protocols has further elevated their market share.
As users demand greater reliability and speed, routers continue to dominate the device type category.
The Wi Fi segment is anticipated to hold 48.90% of total market revenue by 2025, making it the leading connectivity category. Its strength lies in its widespread adoption across consumer, enterprise, and public networks due to cost efficiency, mobility, and ease of installation.
Continuous enhancements in Wi Fi standards, including higher throughput and lower latency, are enabling support for bandwidth intensive applications such as 4K streaming, gaming, and cloud based collaboration. The versatility of Wi Fi in connecting multiple devices simultaneously has increased its relevance in both residential and enterprise environments.
As smart devices, IoT ecosystems, and digital services expand globally, Wi Fi connectivity is expected to retain its dominant role in the market.
According to Future Market Insights’ latest report, historically, from 2020 to 2024, the value of the network devices industry increased at around 6.2% CAGR and reached USD 29.4 billion at the end of 2024.
However, for the projection period between 2025 and 2035, global network device demand is projected to rise at 5.6% CAGR. The worldwide market for network devices is likely to create an absolute $ opportunity of USD 19.1 billion during the projection period.
Rising penetration of internet across the world and increasing population of mobile users are key factors driving the global network devices industry forward.
Similarly, growing popularity of connected devices and cloud platforms along with high penetration of digitalization is expected to elevate network devices demand during the projection period.
Rise in Internet Proliferation to Boost Network Devices Industry
Over the years, there has been a dramatic rise in internet users worldwide due to rising penetration of smartphones, increasing popularity of social media, and availability of high-speed internet. For instance, as per the World Population Review, 31.1 billion people (around 69% of the world population) actively used internet in 2025.
Development and popularity of cheap mobiles have made online world more accessible to the general population by revolutionized the way people access internet. It is estimated that globally, around 29.4 million smartphone users were added between 2024 to 2025. This will continue to act as a catalyst triggering growth in the global network devices industry.
Key Factors Limiting Expansion of Network Devices Market
Potential Chances of Data Breach Limiting Market Expansion
Data security and privacy are the main issues that need to be taken into consideration when large volumes of data are being processed and transferred in various industries. Every endpoint where data is being transferred to or from system, every sensor that receives data signals, and every gateway where data signals are carried has now become a potential target for hackers.
All nodes, sensors, and gateways must be protected and secured from external attacks. Industries need to protect their systems from threats such as data breaches and data espionage (unethical data stealing for personal use).
If it remains unchecked, it can allow hackers to steal sensitive data that could result in huge losses in monetary form or could help competitor firms get an edge over the company.
For instance, as per a report published by the Identity Theft Resource Center (ITRC), 1862 data breaches occurred in 2024 in the United States as compared to 1108 breaches in 2024. This is acting as an impediment to the expansion of the market.
Regionally, North America is projected to remain at the epicenter of network devices industry throughout the forecast period. FMI estimates North America market to reach a valuation of USD 53.6 billion by 2035.
Key factors driving North America market include increasing demand for Wireless Fidelity (Wi-Fi) and wireless hotspots, growing penetration of high-speed internet, and rising popularity of enterprise networking and industrial networking.
Usage of high-speed internet for complex business entities and operations has made sure that business processes are becoming fast and flexible. This in turn is creating a significant demand for network devices.
Key players in the United States such as Juniper Networks, Extreme Networks, Adtran, General Electric, and CISCO are offering large suites of networking products and solutions to customers. The presence of network device companies such as Aruba, Extreme Networks, and CISCO is an important supporting expansion of North America market.
According to the Annual Report (2020 to 2025) of Cisco, by 2025, North America will have around 31.1 million internet users which will be 92% of regional population. Further, it is estimated that the region will have 5 billion network devices/connections and 329 million mobile users in 2025. Such a rapid increase in the population of internet users is going to boost demand for network devices during the next ten years.

| Country | USA |
|---|---|
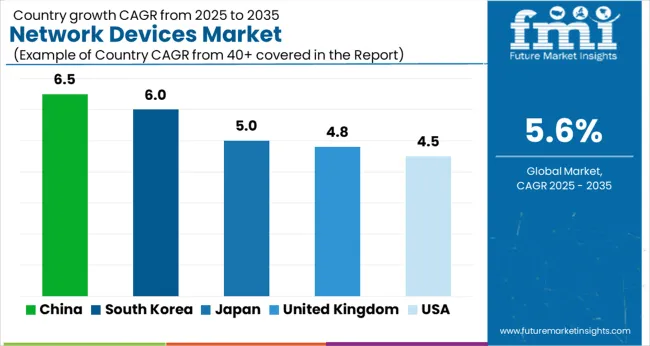
| Historical CAGR (2020 to 2024) | 4.8% |
| Anticipated CAGR (2025 to 2035) | 4.5% |
| Market Value (2035) | USD 14.3 billion |
| Country | United Kingdom |
|---|---|
| Historical CAGR (2020 to 2024) | 5.1% |
| Anticipated CAGR (2025 to 2035) | 4.8% |
| Market Value (2035) | USD 2.1 billion |
| Country | China |
|---|---|
| Historical CAGR (2020 to 2024) | 7.7% |
| Anticipated CAGR (2025 to 2035) | 6.5% |
| Market Value (2035) | USD 3.9 billion |
| Country | Japan |
|---|---|
| Historical CAGR (2020 to 2024) | 5.5% |
| Anticipated CAGR (2025 to 2035) | 5.0% |
| Market Value (2035) | USD 3.3 billion |
| Country | South Korea |
|---|---|
| Historical CAGR (2020 to 2024) | 7.0% |
| Anticipated CAGR (2025 to 2035) | 6.0% |
| Market Value (2035) | USD 1.8 billion |

Increasing Penetration of Internet and Connected Devices Making the USA a Dominant Market
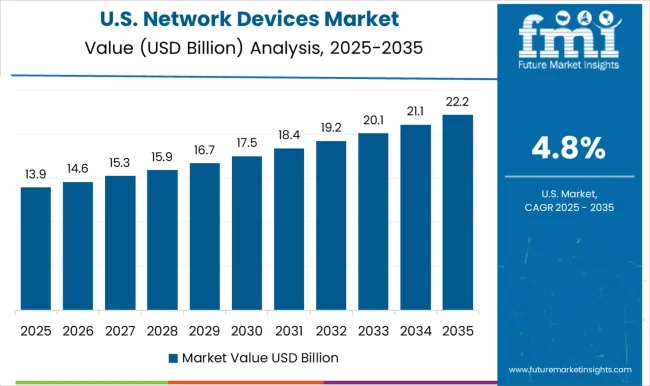
According to Future Market Insights, the United States is set to retain its dominance in the global market for network devices during the forecast period, accelerating at 4.5% CAGR. By 2035, the USA network devices market size is expected to reach USD 14.3 billion. It is expected to have an absolute dollar growth of USD 5.1 billion during the projection period.
Rising penetration of internet, especially 5G, high adoption of connected devices, and strong presence of leading network device manufacturers are driving growth in the USA market.
Over the years, there has been a rapid increase in the adoption of technologies such as IoT, smart homes, and 5G internet services, and the trend is expected to further escalate during the forecast period. This is acting as a catalyst triggering network device sales in the country.
According to the United States Census Bureau, nearly 92% of households in the United States had at least one type of computer and 85% had a broadband internet subscription in 2020. With the penetration of 5G network and growing popularity of social media, total population of internet users’ figure across the United States is significantly increasing. Driven by this, network device demand is slated to rise steadily during the projection period.
In households, people are using smartphones and other connected devices either through Wi-Fi or 4G internet services. Also, in commercial and industrial networking, network devices are required in large volumes.
The country is home to several leading network device companies including AdTran CradlePoint, Juniper Networks, and General Electric. These companies are constantly introducing novel products to allow end users to enjoy better network experience.
Indoor Network Devices Remain Highlight Sought-After Type in the Market
Based on type, the global market for network devices is segmented into indoor network devices and outdoor network devices. Among these, indoor segment holds a prominent share of the global market and it is expected to accelerate at a steady CAGR of 5.5% between 2025 and 2035.
Rising penetration of internet and growing adoption of network devices across residential sector worldwide is driving growth of indoor network devices segment.
Increasing need for high-speed internet services in households due to rapid adoption of smart devices such as smart TVs, smartphones, tablets, and home automation devices, is prompting people to adopt various network devices.
Similarly, rising usage of artificial intelligent devices, virtual reality equipment, and cloud computing technology will positively influence network device demand through 2035.
According to the CICO Annual Internet Report, total count of devices connected to Internet Protocol (IP) networks will be more than thrice the overall population in the world by 2025. Total internet users population is expected to reach 31.1 billion by 2025.
Further, there will be 29.3 billion networked devices by 2025. Out of this, indoor network devices are going to be 74% whereas only 26% of network devices are going to belong to business segment (outdoor network devices).
Enterprise Networking to Generate Growth Opportunities for Network Device Manufacturers
Enterprise networking is expected to remain the most lucrative application for network devices during the forecast period. Future Market Insights predicts the enterprise networking segment to expand at a steady CAGR through 2035, generating lucrative growth opportunities for network device manufacturers.
Growing adoption of enterprise networking across diverse organizations along with increasing usage of network devices such as routers, gateways, modems, etc. in enterprise networking is a key factor driving growth of the target segment.
Similarly, growing popularity of cloud networking and rapid shift towards digitalization will boost growth of the target segment during the assessment period.

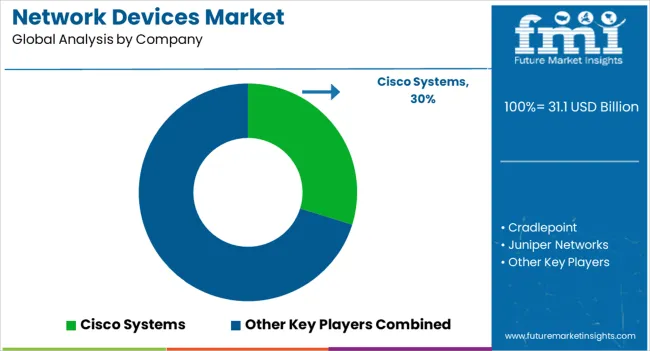
Key network device manufacturers and providers include D-Link, Cisco Systems, Schneider Electric, Siemens, Cradle Points, Digi International, Inseego, Juniper Networks, Huawei, HP Enterprises, Sierra Wireless, Nokia, General Electric, Belkin International, Lantronix, Casa Systems, Extreme Networks, and Adtran, Moxa.
New product launches with enhanced features, price reduction, facility expansion, mergers, partnerships, joint ventures, collaborations, and acquisitions are few of the key strategies employed by these companies to increase their revenue share and stay ahead of the competition.
Recent Developments:
| Attribute | Details |
|---|---|
| Estimated Market Size (2025) | USD 31.1 billion |
| Projected Market Size (2035) | USD 53.6 billion |
| Anticipated Growth Rate (2025 to 2035) | 5.6% CAGR |
| Forecast Period | 2025 to 2035 |
| Historical Data Available for | 2020 to 2024 |
| Market Analysis | USD Million for Value and MT for Volume |
| Key Regions Covered | North America; Latin America; Europe; East Asia; South Asia; and the Middle East & Africa |
| Key Countries Covered | United States, Canada, Brazil, Mexico, Germany, United Kingdom, France, Italy, Spain, Nordic, Russia, Poland, China, India, Thailand, Indonesia, Australia and New Zealand, Japan, GCC countries, North Africa, South Africa, and others. |
| Key Segments Covered | Type, Device Type, Connectivity, Application, and Region |
| Key Companies Profiled | Cisco Systems; Cradle Points; Juniper Networks; Huawei; HP Enterprises; Digi International; Sierra Wireless; Nokia; Inseego; General Electric; Belkin International; Lantronix; Casa Systems; Siemens; Extreme Networks; D-Link; Schneider Electric; Adtran; Moxa |
| Report Coverage | Market Forecast, Company Share Analysis, Competition Intelligence, Drivers Restraints Opportunity Trends Analysis, Market Dynamics and Challenges, and Strategic Growth Initiatives |
The global network devices market is estimated to be valued at USD 31.1 billion in 2025.
The market size for the network devices market is projected to reach USD 53.6 billion by 2035.
The network devices market is expected to grow at a 5.6% CAGR between 2025 and 2035.
The key product types in network devices market are routers, gateways and access points.
In terms of type, indoor segment to command 62.7% share in the network devices market in 2025.


Full Research Suite comprises of:
Market outlook & trends analysis
Interviews & case studies
Strategic recommendations
Vendor profiles & capabilities analysis
5-year forecasts
8 regions and 60+ country-level data splits
Market segment data splits
12 months of continuous data updates
DELIVERED AS:
PDF EXCEL ONLINE
Network Connectivity Tester Market Size and Share Forecast Outlook 2025 to 2035
Network Analyzers Market Size and Share Forecast Outlook 2025 to 2035
Network as a Service (NaaS) Market Size and Share Forecast Outlook 2025 to 2035
Network Analytics Market Size and Share Forecast Outlook 2025 to 2035
Network Sandboxing Market Size and Share Forecast Outlook 2025 to 2035
Network Access Control (NAC) Market Size and Share Forecast Outlook 2025 to 2035
Network Monitoring Market Size and Share Forecast Outlook 2025 to 2035
Network Encryption Market Size and Share Forecast Outlook 2025 to 2035
Network Packet Broker Market Size and Share Forecast Outlook 2025 to 2035
Network Traffic Analytics Market Size and Share Forecast Outlook 2025 to 2035
Network Function Virtualization (NFV) Market Size and Share Forecast Outlook 2025 to 2035
Network Cable Tester Market Size and Share Forecast Outlook 2025 to 2035
Network Point-of-Care Glucose Testing Market Size and Share Forecast Outlook 2025 to 2035
Network Forensics Market Size and Share Forecast Outlook 2025 to 2035
Network Telemetry Market Size and Share Forecast Outlook 2025 to 2035
Network Security Policy Management Market Size and Share Forecast Outlook 2025 to 2035
Network Probe Market Size and Share Forecast Outlook 2025 to 2035
Network Traffic Analysis Solutions Market Size and Share Forecast Outlook 2025 to 2035
Network Slicing Market Size and Share Forecast Outlook 2025 to 2035
Network Optimization Market Size and Share Forecast Outlook 2025 to 2035

Thank you!
You will receive an email from our Business Development Manager. Please be sure to check your SPAM/JUNK folder too.
Chat With
MaRIA