Nephelometry Kits Market Outlook (2023 to 2033)

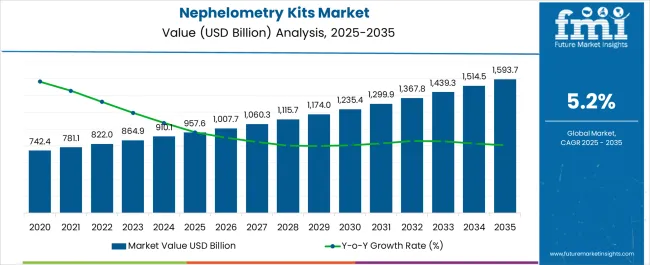
The nephelometry kits market size is projected to be worth US$ 860.4 million in 2023. The market is likely to surpass US$ 1.4 billion by 2033 at a CAGR of 5.5% during the forecast period. Nephelometry is a laboratory technique used to determine the concentration of particular compounds in a liquid sample. Nephelometry kits are diagnostic test kits used in this process. Nephelometry is based on the theory of light scattering, according to which the intensity of the light that is scattered is inversely proportional to the substance's concentration.

The reagents and calibrators included in nephelometry kits are often unique to the substance or analyte being measured. These kits are made to quantify proteins, antibodies, antigens, and other analytes in biological samples like blood, urine, or cerebrospinal fluid with accuracy and precision. When exposed to a light source, the chemicals in the kit react with the target analyte to generate complexes or aggregates that scatter light.

Other Drivers Propelling the Demand for Nephelometry Kits include:

  • Globally, chronic conditions such kidney illness, autoimmune disorders, and cardiovascular ailments are on the rise. By measuring certain biomarkers or analytes in patient samples, nephelometry kits serve a crucial role in the diagnosis, monitoring, and management of various disorders.
  • Nephelometry kits have become more sensitive and precise as a result of the ongoing improvements in diagnostic technologies. These kits increase the efficiency and dependability of diagnostic testing by providing better measurement precision and faster assay times.

Challenges for Companies /Manufacturers in the Nephelometry Kits Market:

  • Nephelometry kits can be expensive, especially those made for numerous analyte measurements or for specialized uses. These kits' high price may make them less accessible, especially in environments with limited resources or for smaller laboratories operating on a tighter budget.
  • Nephelometry needs competent laboratory staff and technical know-how to conduct precise measurements. However, there is a dearth of qualified experts who are adept at using nephelometry apparatus and deciphering the results.
  • To achieve accurate and trustworthy results, nephelometry measurements need to be calibrated often and subject to quality control methods. Quality control procedures can be time- and resource-intensive to maintain and execute.

Opportunities in the Nephelometry Kits Industry:

  • There is an increasing demand for accurate and rapid diagnostic tools across various healthcare settings. Nephelometry kits offer precise and efficient measurement of specific analytes, making them valuable in the diagnosis and monitoring of various diseases.
  • The performance and capabilities of nephelometry kits are improved by technological developments in reagent formulations and nephelometry apparatus. These developments increase sensitivity, precision, and throughput, making measurements more effective and dependable.
  • The goal of precision medicine is to modify medical procedures to fit the specific needs of each patient. By enabling the assessment of specific biomarkers for patient classification, medication selection, and monitoring, nephelometry kits play a crucial role in precision medicine.

Latest Trends in the Nephelometry Kits Market:

  • High-sensitivity nephelometry assays that can find analytes in biological samples at low concentrations are becoming more and more in demand. The requirement for early illness identification and surveillance, particularly in circumstances with low biomarker concentrations, is what is driving this development.
  • Nephelometry assays that may be customized to fit the unique requirements of academics and healthcare professionals are becoming more and more popular. Market participants are providing user-customizable test panels, which let users choose and mix particular analytes in accordance with their research or clinical needs. This development allows for more customization and flexibility in testing methods.
Attributes Details
Nephelometry Kits Market Size (2023) US$ 860.4 million
Nephelometry Kits Market Projected Size (2033) US$ 1.4 billion
Value CAGR (2023 to 2033) 5.5%

Don't pay for what you don't need

Customize your report by selecting specific countries or regions and save 30%!

2012 to 2022 Nephelometry Kits Demand Outlook Compared to 2023 to 2033 Forecast

From 2012 to 2022, the global nephelometry kits market experienced a CAGR of 2.7%, reaching a market size of US$ 860.4 million in 2023.

From 2012 to 2022, Because nephelometry is becoming more widely used as a trustworthy and effective way to measure particular analytes in a variety of clinical and research applications, the market for nephelometry kits has historically shown stable expansion. The diagnosis and follow-up of problems like autoimmune disorders, infectious diseases, cardiovascular diseases, and cancer have all benefited from the widespread use of nephelometry kits. Technology advances, elevated public awareness of the value of early disease detection, and the expanding prevalence of chronic diseases have all benefited the industry.

Future Forecast for Nephelometry Kits Industry:

Looking ahead, the global nephelometry kits industry is expected to rise at a CAGR of 5.5% from 2023 to 2033. During the forecast period, the market size is expected to reach US$ 1.4 billion by 2033.

The market will rise as a result of ongoing research and development projects aimed at enhancing nephelometry technology, creating new assays, and discovering novel biomarkers. Innovation and the creation of cutting-edge nephelometry kits will be fueled by cooperation between industrial participants, research organizations, and academic institutions.

Country-Wise Insights

Nephelometry Kits Market to Surge in the United States Due to Growing demand for early disease detection

Country The United States
Market Size (US$ million) by End of Forecast Period (2033) US$ 540.3 million
CAGR % 2023 to End of Forecast (2033) 6.8%

The nephelometry kits industry in the United States is expected to reach a market size of US$ 540.3 million by 2033, expanding at a CAGR of 6.8%. Effective illness management and better patient outcomes depend on early disease identification. Early detection of many diseases, such as autoimmune disorders, infectious diseases, and kidney-related problems, is made possible by nephelometry kits. The demand for nephelometry kits is rising in the United States due to a focus on preventive medicine and early intervention.

Rising Demand for Nephelometry Kits Due to Increasing focus on personalized medicine to Propel the United Kingdom Market Growth

Country The United Kingdom
Market Size (US$ million) by End of Forecast Period (2033) US$ 55.5 million
CAGR % 2023 to End of Forecast (2033) 6.1%

The nephelometry kits industry in the United Kingdom is expected to reach a market value of US$ 55.5 million, expanding at a CAGR of 6.1% during the forecast period. Personalized medicine approaches are gaining prominence in the UK healthcare system. Nephelometry kits play a crucial role in measuring specific biomarkers and proteins to aid in personalized treatment decisions. As healthcare providers increasingly emphasize tailored treatments for patients, the demand for nephelometry kits rises, driving market growth.

Notable Growth Expected in China's Nephelometry Kits Market Due to Increasing Healthcare Expenditure

Country China
Market Size (US$ million) by End of Forecast Period (2033) US$ 194.4 million
CAGR % 2023 to End of Forecast (2033) 7.6%

The nephelometry kits industry in China is anticipated to reach a market size of US$ 194.4 million, moving at a CAGR of 7.6% during the forecast period. China has been increasing its healthcare expenditure to improve the quality of healthcare services and promote accessible healthcare for its population. Increased healthcare spending allows for better access to diagnostic tests, including nephelometry, and drives the demand for nephelometry kits, contributing to market growth.

Increasing awareness and preventive healthcare measures to Drive Market Growth in Japan

Country Japan
Market Size (US$ million) by End of Forecast Period (2033) US$ 54.8 million
CAGR % 2023 to End of Forecast (2033) 5.6%

The nephelometry kits industry in Japan is estimated to reach a market size of US$ 54.8 million by 2033, thriving at a CAGR of 5.6%. There is a growing emphasis on preventive healthcare in Japan. Awareness campaigns and screening programs aim to identify diseases at an early stage and promote early intervention. Nephelometry kits play a vital role in disease detection, contributing to their adoption and market growth.

Demand for Nephelometry Kits is Rising Due to Increased Investment in Addiction Treatment Increasing research collaborations to Fuel Market Growth in South Korea

Country South Korea
Market Size (US$ million) by End of Forecast Period (2033) US$ 20.3 million
CAGR % 2023 to End of Forecast (2033) 5.6%

The nephelometry kits industry in South Korea is expected to reach a market size of US$ 20.3 million, expanding at a CAGR of 5.6% during the forecast period. The market in South Korea is forecasted to witness growth due to collaborations between academic institutions, research organizations, and industry players promote research and development activities in the nephelometry kits market. These collaborations drive innovation, leading to the development of improved nephelometry kits and expanding their applications in various disease areas.

Sabyasachi Ghosh
Sabyasachi Ghosh

Principal Consultant

Talk to Analyst

Find your sweet spots for generating winning opportunities in this market.

Category-Wise Insights

Reagent Kits to Dominate Nephelometry Kits Industry with 6.1% CAGR through 2033

The Reagent Kits is expected to dominate the nephelometry kits industry with a CAGR of 6.1% from 2023 to 2033. Reagents kits are essential components used in nephelometry assays. They contain specific reagents, antibodies, calibrators, and controls necessary for performing accurate and reliable measurements of analytes in patient samples. These kits provide healthcare professionals with all the required materials in a standardized and convenient format, simplifying the testing process.

How the Serum Sample Type are Driving the Nephelometry Kits Market?

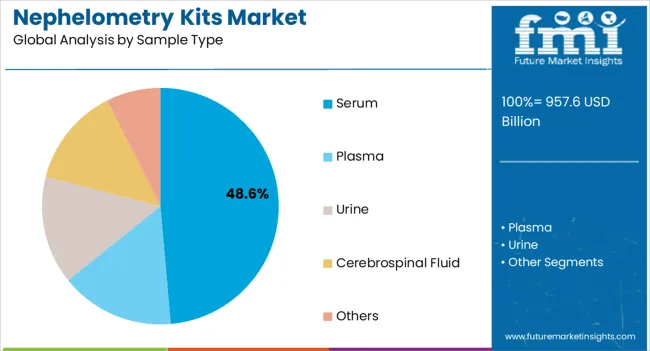
The Serum by sample type segments are expected to dominate the nephelometry kits industry with a CAGR of 6.8% from 2023 to 2033. Serum serves as a key sample matrix for nephelometry assays. Nephelometry kits are designed to measure various analytes, such as proteins, antibodies, antigens, and other biomarkers, present in serum samples. Serum contains a wide range of analytes that can provide valuable diagnostic information. The availability of high-quality serum samples is essential for accurate and reliable nephelometry testing.

How the Disease Diagnosis are Driving the Nephelometry Kits Market?

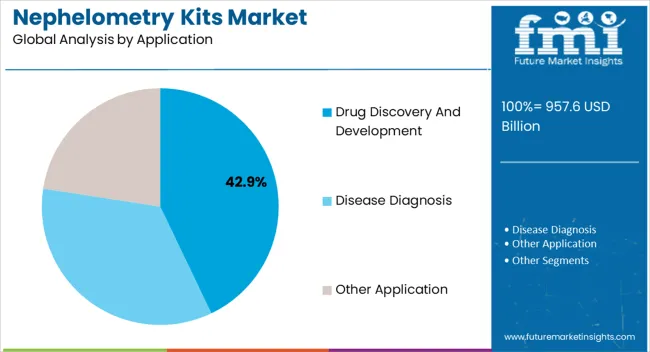
The disease diagnosis segments are expected to dominate the nephelometry kits industry with a CAGR of 5.7% from 2023 to 2033. Due to their great accuracy and precision in assessing particular biomarkers, nephelometry kits are frequently employed in the diagnosis of diseases. With excellent sensitivity and specificity, these kits allow medical personnel to identify and quantify biomarkers found in patient samples. Nephelometry test results that are dependable and accurate help with proper illness diagnosis.

Which End User is Widely Adopted the Nephelometry Kits?

The hospital segment is expected to dominate the nephelometry kits industry with a CAGR of 5.3% from 2023 to 2033. Hospitals serve as primary healthcare facilities, providing medical services to a large number of patients. Nephelometry kits are widely used in hospital laboratories to perform diagnostic tests. The presence of nephelometry kits in hospitals allows for convenient and timely testing for patients, ensuring increased access to nephelometry services and contributing to market growth.

How Key Players Stay Competitive in the Nephelometry Kits Industry?

The nephelometry kits sector is fiercely competitive, with many companies fighting for market dominance. To stay ahead of the competition in such a circumstance, essential players must employ smart techniques.

Key Strategies Used by the Participants

  • Product Development

To produce innovative goods that increase efficacy, dependability, and cost-effectiveness, businesses make significant investments in research and development. Product innovation enables companies to make themselves stand out from the competition while also meeting the shifting needs of their customers.

  • Strategic Alliances & Collaborations

Key industry leaders frequently develop strategic partnerships and collaborations with other companies in order to harness their strengths and increase their market reach. Companies might also gain access to new technology and markets through such agreements.

  • Expansion into Emerging Markets

The nephelometry kits sector is expanding rapidly in emerging regions such as China and India. Key firms are enhancing their distribution networks and developing local manufacturing facilities to increase their presence in these areas.

  • Acquisitions and mergers

Mergers and acquisitions are frequently used by key players in the nephelometry kits business to consolidate their market position, extend their product range, and gain access to new markets.

Get the data you need at a Fraction of the cost

Personalize your report by choosing insights you need
and save 40%!

Key Players in the Nephelometry Kits Industry

  • Siemens Healthineers
  • F. Hoffmann-La Roche Ltd.
  • Shenzhen Mindray Bio-Medical Electronics Co., Ltd
  • Randox Laboratories Ltd.
  • Thermo
  • Beckman Coulter, Inc. (Danaher)
  • Agilent Technologies, Inc.
  • Elabscience Biotechnology Inc.
  • Goldsite Diagnostics Inc.
  • Hipro Biotechnology Co., Ltd.
  • Beijing Strong Biotechnologies, Inc.
  • Getein Biotech, Inc.

Key Developments in the Nephelometry Kits Market:

  • In April 2020, The SARS-CoV-2 Assay test kit from Siemens Healthineers, which detects the coronavirus (Covid-19) disease-causing SARS-CoV-2 virus, has been made available.
  • In October 2022, A shareholder group led by the European equity firm Nordic Capital has entered into a definitive deal for Thermo Fisher Scientific to buy The Binding Site Group, a specialty diagnostics business.

Segmentation Analysis of the Nephelometry Kits Market

By Product:

  • Reagent Kits
    • Albumin Test
    • Microglobulin Albumin Test
    • C-Reactive Protein Test
    • Fibrinogen Test
    • Fibronectin Test
    • Haptoglobin Test
    • Kappa Light Chains
    • Lambda Light Chains
    • Transferrin Test
    • Alpha-1-Acid Glycoprotein Test
    • Alpha-1-Antitrypsin Test
    • Apolipoprotein B Test
    • Cystatin Test
    • Ferritin Test
    • Immunoglobulin Test
    • Lipoprotein Test
    • Others
  • Controls Kits/Reagents

By Sample Type:

  • Serum
  • Plasma
  • Urine
  • Cerebrospinal Fluid
  • Others

By Application:

  • Drug Discovery and Development
  • Disease Diagnosis
    • Cancer
    • Infectious Diseases
    • Blood Coagulation
    • Renal Function
    • Liver Disease
    • Autoimmune Disorders
    • Others
  • Other Application

By End User:

  • Hospital
  • Diagnostic Laboratories
  • Reference Laboratories
  • Specialty Clinics/Standalone

By Region:

  • North America
  • Latin America
  • Europe
  • East Asia
  • South Asia
  • Oceania
  • The Middle East & Africa

Frequently Asked Questions

What is the Nephelometry Kits Market Size in 2023?

The market is valued at US$ 860.4 million in 2023.

Who are the Key Market Players?

Siemens Healthineers, and F. Hoffmann-La Roche Ltd. are the key market players.

What is the Projected Market Size by 2033?

The market is estimated to reach US$ 1.4 billion in 2033.

Which is the Leading Segment by Product?

The reagent kits segment is likely to remain preferred through 2033.

How was the Historical Performance of the Market?

From 2018 to 2022, the market held a CAGR of 2.7%.

Table of Content
1. Executive Summary
    1.1. Global Market Outlook
    1.2. Demand Side Trends
    1.3. Supply Side Trends
    1.4. Analysis and Recommendations
2. Market Overview
    2.1. Market Coverage / Taxonomy
    2.2. Market Definition / Scope / Limitations
    2.3. Inclusions and Exclusions
3. Key Market Trends
    3.1. Key Trends Impacting the Market
    3.2. Product Innovation / Development Trends
4. Value Added Insights
    4.1. Product Adoption / Usage Analysis
    4.2. Product Features/ USPs
    4.3. Recent product Approvals/Launches
    4.4. Regulatory Landscape
    4.5. PESTEL Analysis
    4.6. Porter’s Analysis
5. Market Background
    5.1. Macro-Economic Factors
        5.1.1. Global GDP Growth Outlook
        5.1.2. Global Healthcare Expenditure Outlook
        5.1.3. Global Immunoassay Market Outlook
    5.2. Forecast Factors - Relevance & Impact
        5.2.1. Key Player’s Historic Growth
        5.2.2. Increasing Cases of Autoimmune Disorders
        5.2.3. Favourable Government Regulations
        5.2.4. Rising Demand for Minimally Invasive Procedures
        5.2.5. Technological Advancement in the Kits
        5.2.6. Frequency of Product Approvals
    5.3. Dynamics
        5.3.1. Drivers
        5.3.2. Restraints
        5.3.3. Opportunity Analysis
6. Global Market Volume (in Units) Analysis 2012 to 2022 and Forecast, 2023 to 2033
    6.1. Historical Volume (in Units) Analysis, 2012 to 2022
    6.2. Current and Future Volume (in Units) Projections, 2023 to 2033
        6.2.1. Y-o-Y Growth Trend Analysis
7. Global Market - Pricing Analysis
    7.1. Regional Pricing Analysis By Product
    7.2. Pricing Break-up
        7.2.1. Manufacturer Level Pricing
        7.2.2. Distributor Level Pricing
    7.3. Global Average Pricing Analysis Benchmark
    7.4. Pricing Assumptions
8. Global Market Demand (in Value or Size in US$ Mn) Analysis 2012 to 2022 and Forecast, 2023 to 2033
    8.1. Historical Market Value (US$ Million) Analysis, 2012 to 2022
    8.2. Current and Future Market Value (US$ Million) Projections, 2023 to 2033
        8.2.1. Y-o-Y Growth Trend Analysis
        8.2.2. Absolute $ Opportunity Analysis
9. Global Market Analysis 2012 to 2022 and Forecast 2023 to 2033, By Product
    9.1. Introduction / Key Findings
    9.2. Historical Market Size (US$ Million) and Volume (Units) Analysis By Product, 2012 to 2022
    9.3. Current and Future Market Size (US$ Million) and Volume (Units) Analysis and Forecast By Product, 2023 to 2033
        9.3.1. Reagent Kits
                9.3.1.1.1. Albumin Test Kits
                9.3.1.1.2. Microglobulin Albumin Test Kits
                9.3.1.1.3. C-Reactive Protein Test Kits
                9.3.1.1.4. Fibrinogen Test Kits
                9.3.1.1.5. Fibronectin Test Kits
                9.3.1.1.6. Haptoglobin Test Kits
                9.3.1.1.7. Kappa Light Chains Kits
                9.3.1.1.8. Lambda Light Chains Kits
                9.3.1.1.9. Transferrin Test Kits
                9.3.1.1.10. Alpha-1-Acid Glycoprotein Test Kits
                9.3.1.1.11. Alpha-1-Antitrypsin Test Kits
                9.3.1.1.12. Apolipoprotein B Test Kits
                9.3.1.1.13. Cystatin Test Kits
                9.3.1.1.14. Ferritin Test Kits
                9.3.1.1.15. Immunoglobulin Test Kits
                9.3.1.1.16. Lipoprotein Test Kits
                9.3.1.1.17. Others
        9.3.2. Controls Kits/Reagents
    9.4. Market Attractiveness Analysis By Product
10. Global Market Analysis 2012 to 2022 and Forecast 2023 to 2033, By Sample Type
    10.1. Introduction / Key Findings
    10.2. Historical Market Size (US$ Million) Analysis By Sample Type, 2012 to 2022
    10.3. Current and Future Market Size (US$ Million) Analysis and Forecast By Sample Type, 2023 to 2033
        10.3.1. Serum
        10.3.2. Plasma
        10.3.3. Urine
        10.3.4. Cerebrospinal Fluid
        10.3.5. Others
    10.4. Market Attractiveness Analysis By Sample Type
11. Global Market Analysis 2012 to 2022 and Forecast 2023 to 2033, By Application
    11.1. Introduction / Key Findings
    11.2. Historical Market Size (US$ Million) Analysis By Application, 2012 to 2022
    11.3. Current and Future Market Size (US$ Million) Analysis and Forecast By Application, 2023 to 2033
        11.3.1. Drug Discovery and Development
        11.3.2. Disease Diagnosis
                11.3.2.1.1. Cancer
                11.3.2.1.2. Infectious Diseases
                11.3.2.1.3. Blood Coagulation
                11.3.2.1.4. Renal Function
                11.3.2.1.5. Liver Disease
                11.3.2.1.6. Autoimmune Disorders
                11.3.2.1.7. Others
        11.3.3. Other Application Market Attractiveness Analysis By Application
12. Global Market Analysis 2012 to 2022 and Forecast 2023 to 2033, By End User
    12.1. Introduction / Key Findings
    12.2. Historical Market Size (US$ Million) Analysis By End User, 2012 to 2022
    12.3. Current and Future Market Size (US$ Million) Analysis and Forecast By End User, 2023 to 2033
        12.3.1. Hospitals
        12.3.2. Diagnostic Laboratories
        12.3.3. Reference Laboratories
        12.3.4. Specialty Clinics/Standalone
    12.4. Market Attractiveness Analysis By End User
13. Global Market Analysis 2012 to 2022 and Forecast 2023 to 2033, by Region
    13.1. Introduction
    13.2. Historical Market Size (US$ Million) and Volume (Units) Analysis By Region, 2012 to 2022
    13.3. Current and Future Market Size (US$ Million) and Volume (Units) Analysis and Forecast By Region, 2023 to 2033
        13.3.1. North America
        13.3.2. Latin America
        13.3.3. Europe
        13.3.4. South Asia
        13.3.5. East Asia
        13.3.6. Oceania
        13.3.7. Middle East and Africa (MEA)
    13.4. Market Attractiveness Analysis By Region
14. North America Market Analysis 2012 to 2022 and Forecast 2023 to 2033
    14.1. Introduction
    14.2. Historical Market Size (US$ Million) and Volume (Units) Analysis By Market Taxonomy, 2012 to 2022
    14.3. Current and Future Market Size (US$ Million) and Volume (Units) Analysis and Forecast By Market Taxonomy, 2023 to 2033
        14.3.1. By Country
            14.3.1.1. USA
            14.3.1.2. Canada
        14.3.2. By Product
        14.3.3. By Sample Type
        14.3.4. By Application
        14.3.5. By End User
    14.4. Market Attractiveness Analysis
        14.4.1. By Country
        14.4.2. By Product
        14.4.3. By Sample Type
        14.4.4. By Application
        14.4.5. By End User
    14.5. Country Level Analysis & Forecast
        14.5.1. USA Market Analysis
            14.5.1.1. Introduction
            14.5.1.2. Market Analysis and Forecast by Market Taxonomy
                14.5.1.2.1. By Product
                14.5.1.2.2. By Sample Type
                14.5.1.2.3. By Application
                14.5.1.2.4. By End User
        14.5.2. Canada Market Analysis
            14.5.2.1. Introduction
            14.5.2.2. Market Analysis and Forecast by Market Taxonomy
                14.5.2.2.1. By Product
                14.5.2.2.2. By Sample Type
                14.5.2.2.3. By Application
                14.5.2.2.4. By End User
    14.6. Market Trends
    14.7. Key Market Participants - Intensity Mapping
    14.8. Drivers and Restraints - Impact Analysis
15. Latin America Market Analysis 2012 to 2022 and Forecast 2023 to 2033
    15.1. Introduction
    15.2. Historical Market Size (US$ Million) and Volume (Units) Analysis By Market Taxonomy, 2012 to 2022
    15.3. Current and Future Market Size (US$ Million) and Volume (Units) Analysis and Forecast By Market Taxonomy, 2023 to 2033
        15.3.1. By Country
            15.3.1.1. Brazil
            15.3.1.2. Mexico
            15.3.1.3. Argentina
            15.3.1.4. Rest of Latin America
        15.3.2. By Product
        15.3.3. By Sample Type
        15.3.4. By Application
        15.3.5. By End User
    15.4. Market Attractiveness Analysis
        15.4.1. By Country
        15.4.2. By Product
        15.4.3. By Sample Type
        15.4.4. By Application
        15.4.5. By End User
    15.5. Country Level Analysis & Forecast
        15.5.1. Brazil Market Analysis
            15.5.1.1. Introduction
            15.5.1.2. Market Analysis and Forecast by Market Taxonomy
                15.5.1.2.1. By Product
                15.5.1.2.2. By Sample Type
                15.5.1.2.3. By Application
                15.5.1.2.4. By End User
        15.5.2. Mexico Market Analysis
            15.5.2.1. Introduction
            15.5.2.2. Market Analysis and Forecast by Market Taxonomy
                15.5.2.2.1. By Product
                15.5.2.2.2. By Sample Type
                15.5.2.2.3. By Application
                15.5.2.2.4. By End User
        15.5.3. Argentina Market Analysis
            15.5.3.1. Introduction
            15.5.3.2. Market Analysis and Forecast by Market Taxonomy
                15.5.3.2.1. By Product
                15.5.3.2.2. By Sample Type
                15.5.3.2.3. By Application
                15.5.3.2.4. By End User
    15.6. Market Trends
    15.7. Key Market Participants - Intensity Mapping
    15.8. Drivers and Restraints - Impact Analysis
16. Europe Market Analysis 2012 to 2022 and Forecast 2023 to 2033
    16.1. Introduction
    16.2. Historical Market Size (US$ Million) and Volume (Units) Analysis By Market Taxonomy, 2012 to 2022
    16.3. Current and Future Market Size (US$ Million) and Volume (Units) Analysis and Forecast By Market Taxonomy, 2023 to 2033
        16.3.1. By Country
            16.3.1.1. Germany
            16.3.1.2. France
            16.3.1.3. Italy
            16.3.1.4. UK
            16.3.1.5. Spain
            16.3.1.6. Russia
            16.3.1.7. BENELUX
            16.3.1.8. Rest of Europe
        16.3.2. By Product
        16.3.3. By Sample Type
        16.3.4. By Application
        16.3.5. By End User
    16.4. Market Attractiveness Analysis
        16.4.1. By Country
        16.4.2. By Product
        16.4.3. By Sample Type
        16.4.4. By Application
        16.4.5. By End User
    16.5. Country Level Analysis & Forecast
        16.5.1. Germany Market Analysis
            16.5.1.1. Introduction
            16.5.1.2. Market Analysis and Forecast by Market Taxonomy
                16.5.1.2.1. By Product
                16.5.1.2.2. By Sample Type
                16.5.1.2.3. By Application
                16.5.1.2.4. By End User
        16.5.2. France Market Analysis
            16.5.2.1. Introduction
            16.5.2.2. Market Analysis and Forecast by Market Taxonomy
                16.5.2.2.1. By Product
                16.5.2.2.2. By Sample Type
                16.5.2.2.3. By Application
                16.5.2.2.4. By End User
        16.5.3. Italy Market Analysis
            16.5.3.1. Introduction
            16.5.3.2. Market Analysis and Forecast by Market Taxonomy
                16.5.3.2.1. By Product
                16.5.3.2.2. By Sample Type
                16.5.3.2.3. By Application
                16.5.3.2.4. By End User
        16.5.4. UK Market Analysis
            16.5.4.1. Introduction
            16.5.4.2. Market Analysis and Forecast by Market Taxonomy
                16.5.4.2.1. By Product
                16.5.4.2.2. By Sample Type
                16.5.4.2.3. By Application
                16.5.4.2.4. By End User
        16.5.5. Spain Market Analysis
            16.5.5.1. Introduction
            16.5.5.2. Market Analysis and Forecast by Market Taxonomy
                16.5.5.2.1. By Product
                16.5.5.2.2. By Sample Type
                16.5.5.2.3. By Application
                16.5.5.2.4. By End User
        16.5.6. Russia Market Analysis
            16.5.6.1. Introduction
            16.5.6.2. Market Analysis and Forecast by Market Taxonomy
                16.5.6.2.1. By Product
                16.5.6.2.2. By Sample Type
                16.5.6.2.3. By Application
                16.5.6.2.4. By End User
        16.5.7. BENELUX Market Analysis
            16.5.7.1. Introduction
            16.5.7.2. Market Analysis and Forecast by Market Taxonomy
                16.5.7.2.1. By Product
                16.5.7.2.2. By Sample Type
                16.5.7.2.3. By Application
                16.5.7.2.4. By End User
    16.6. Market Trends
    16.7. Key Market Participants - Intensity Mapping
    16.8. Drivers and Restraints - Impact Analysis
17. South Asia Market Analysis 2012 to 2022 and Forecast 2023 to 2033
    17.1. Introduction
    17.2. Historical Market Size (US$ Million) and Volume (Units) Analysis By Market Taxonomy, 2012 to 2022
    17.3. Current and Future Market Size (US$ Million) and Volume (Units) Analysis and Forecast By Market Taxonomy, 2023 to 2033
        17.3.1. By Country
            17.3.1.1. India
            17.3.1.2. Thailand
            17.3.1.3. Indonesia
            17.3.1.4. Malaysia
            17.3.1.5. Rest of South Asia
        17.3.2. By Product
        17.3.3. By Sample Type
        17.3.4. By Application
        17.3.5. By End User
    17.4. Market Attractiveness Analysis
        17.4.1. By Country
        17.4.2. By Product
        17.4.3. By Sample Type
        17.4.4. By Application
        17.4.5. By End User
    17.5. Country Level Analysis & Forecast
        17.5.1. India Market Analysis
            17.5.1.1. Introduction
            17.5.1.2. Market Analysis and Forecast by Market Taxonomy
                17.5.1.2.1. By Product
                17.5.1.2.2. By Sample Type
                17.5.1.2.3. By Application
                17.5.1.2.4. By End User
        17.5.2. Thailand Market Analysis
            17.5.2.1. Introduction
            17.5.2.2. Market Analysis and Forecast by Market Taxonomy
                17.5.2.2.1. By Product
                17.5.2.2.2. By Sample Type
                17.5.2.2.3. By Application
                17.5.2.2.4. By End User
        17.5.3. Indonesia Market Analysis
            17.5.3.1. Introduction
            17.5.3.2. Market Analysis and Forecast by Market Taxonomy
                17.5.3.2.1. By Product
                17.5.3.2.2. By Sample Type
                17.5.3.2.3. By Application
                17.5.3.2.4. By End User
        17.5.4. Malaysia Market Analysis
            17.5.4.1. Introduction
            17.5.4.2. Market Analysis and Forecast by Market Taxonomy
                17.5.4.2.1. By Product
                17.5.4.2.2. By Sample Type
                17.5.4.2.3. By Application
                17.5.4.2.4. By End User
    17.6. Market Trends
    17.7. Key Market Participants - Intensity Mapping
    17.8. Drivers and Restraints - Impact Analysis
18. East Asia Market Analysis 2012 to 2022 and Forecast 2023 to 2033
    18.1. Introduction
    18.2. Historical Market Size (US$ Million) and Volume (Units) Analysis By Market Taxonomy, 2012 to 2022
    18.3. Current and Future Market Size (US$ Million) and Volume (Units) Analysis and Forecast By Market Taxonomy, 2023 to 2033
        18.3.1. By Country
            18.3.1.1. China
            18.3.1.2. Japan
            18.3.1.3. South Korea
        18.3.2. By Product
        18.3.3. By Sample Type
        18.3.4. By Application
        18.3.5. By End User
    18.4. Market Attractiveness Analysis
        18.4.1. By Country
        18.4.2. By Product
        18.4.3. By Sample Type
        18.4.4. By Application
        18.4.5. By End User
    18.5. Country Level Analysis & Forecast
        18.5.1. China Market Analysis
            18.5.1.1. Introduction
            18.5.1.2. Market Analysis and Forecast by Market Taxonomy
                18.5.1.2.1. By Product
                18.5.1.2.2. By Sample Type
                18.5.1.2.3. By Application
                18.5.1.2.4. By End User
        18.5.2. Japan Market Analysis
            18.5.2.1. Introduction
            18.5.2.2. Market Analysis and Forecast by Market Taxonomy
                18.5.2.2.1. By Product
                18.5.2.2.2. By Sample Type
                18.5.2.2.3. By Application
                18.5.2.2.4. By End User
        18.5.3. South Korea Market Analysis
            18.5.3.1. Introduction
            18.5.3.2. Market Analysis and Forecast by Market Taxonomy
                18.5.3.2.1. By Product
                18.5.3.2.2. By Sample Type
                18.5.3.2.3. By Application
                18.5.3.2.4. By End User
    18.6. Market Trends
    18.7. Key Market Participants - Intensity Mapping
    18.8. Drivers and Restraints - Impact Analysis
19. Oceania Market Analysis 2012 to 2022 and Forecast 2023 to 2033
    19.1. Introduction
    19.2. Historical Market Size (US$ Million) and Volume (Units) Analysis By Market Taxonomy, 2012 to 2022
    19.3. Current and Future Market Size (US$ Million) and Volume (Units) Analysis and Forecast By Market Taxonomy, 2023 to 2033
        19.3.1. By Country
            19.3.1.1. Australia
            19.3.1.2. New Zealand
        19.3.2. By Product
        19.3.3. By Sample Type
        19.3.4. By Application
        19.3.5. By End User
    19.4. Market Attractiveness Analysis
        19.4.1. By Country
        19.4.2. By Product
        19.4.3. By Sample Type
        19.4.4. By Application
        19.4.5. By End User
    19.5. Country Level Analysis & Forecast
        19.5.1. Australia Market Analysis
            19.5.1.1. Introduction
            19.5.1.2. Market Analysis and Forecast by Market Taxonomy
                19.5.1.2.1. By Product
                19.5.1.2.2. By Sample Type
                19.5.1.2.3. By Application
                19.5.1.2.4. By End User
        19.5.2. New Zealand Market Analysis
            19.5.2.1. Introduction
            19.5.2.2. Market Analysis and Forecast by Market Taxonomy
                19.5.2.2.1. By Product
                19.5.2.2.2. By Sample Type
                19.5.2.2.3. By Application
                19.5.2.2.4. By End User
    19.6. Market Trends
    19.7. Key Market Participants - Intensity Mapping
    19.8. Drivers and Restraints - Impact Analysis
20. Middle East and Africa Market Analysis 2012 to 2022 and Forecast 2023 to 2033
    20.1. Introduction
    20.2. Historical Market Size (US$ Million) and Volume (Units) Analysis By Market Taxonomy, 2012 to 2022
    20.3. Current and Future Market Size (US$ Million) and Volume (Units) Analysis and Forecast By Market Taxonomy, 2023 to 2033
        20.3.1. By Country
            20.3.1.1. GCC Countries
            20.3.1.2. Türkiye
            20.3.1.3. Northern Africa
            20.3.1.4. South Africa
            20.3.1.5. Rest of Middle East and Africa
        20.3.2. By Product
        20.3.3. By Sample Type
        20.3.4. By Application
        20.3.5. By End User
    20.4. Market Attractiveness Analysis
        20.4.1. By Country
        20.4.2. By Product
        20.4.3. By Sample Type
        20.4.4. By Application
        20.4.5. By End User
    20.5. Country Level Analysis & Forecast
        20.5.1. GCC Countries Market Analysis
            20.5.1.1. Introduction
            20.5.1.2. Market Analysis and Forecast by Market Taxonomy
                20.5.1.2.1. By Product
                20.5.1.2.2. By Sample Type
                20.5.1.2.3. By Application
                20.5.1.2.4. By End User
        20.5.2. Türkiye Market Analysis
            20.5.2.1. Introduction
            20.5.2.2. Market Analysis and Forecast by Market Taxonomy
                20.5.2.2.1. By Product
                20.5.2.2.2. By Sample Type
                20.5.2.2.3. By Application
                20.5.2.2.4. By End User
        20.5.3. Northern Africa Market Analysis
            20.5.3.1. Introduction
            20.5.3.2. Market Analysis and Forecast by Market Taxonomy
                20.5.3.2.1. By Product
                20.5.3.2.2. By Sample Type
                20.5.3.2.3. By Application
                20.5.3.2.4. By End User
        20.5.4. South Africa Market Analysis
            20.5.4.1. Introduction
            20.5.4.2. Market Analysis and Forecast by Market Taxonomy
                20.5.4.2.1. By Product
                20.5.4.2.2. By Sample Type
                20.5.4.2.3. By Application
                20.5.4.2.4. By End User
    20.6. Market Trends
    20.7. Key Market Participants - Intensity Mapping
    20.8. Drivers and Restraints - Impact Analysis
21. Market Structure Analysis
    21.1. Market Analysis by Tier of Companies
    21.2. Market Share Analysis of Top Players
    21.3. Market Presence Analysis
22. Competition Analysis
    22.1. Competition Dashboard
    22.2. Branding and Promotional Strategies, By Key Players
    22.3. Key Development Analysis
    22.4. Competition Deep Dive
        22.4.1. Siemens Healthineers
            22.4.1.1. Overview
            22.4.1.2. Product Portfolio
            22.4.1.3. Key Financials
            22.4.1.4. Sales Footprint
            22.4.1.5. SWOT Analysis
            22.4.1.6. Strategy Overview
                22.4.1.6.1. Marketing Strategy
                22.4.1.6.2. Product Strategy
                22.4.1.6.3. Channel Strategy
        22.4.2. F. Hoffmann-La Roche Ltd.
            22.4.2.1. Overview
            22.4.2.2. Product Portfolio
            22.4.2.3. Key Financials
            22.4.2.4. Sales Footprint
            22.4.2.5. SWOT Analysis
            22.4.2.6. Strategy Overview
                22.4.2.6.1. Marketing Strategy
                22.4.2.6.2. Product Strategy
                22.4.2.6.3. Channel Strategy
        22.4.3. Shenzhen Mindray Bio-Medical Electronics Co., Ltd
            22.4.3.1. Overview
            22.4.3.2. Product Portfolio
            22.4.3.3. Key Financials
            22.4.3.4. Sales Footprint
            22.4.3.5. SWOT Analysis
            22.4.3.6. Strategy Overview
                22.4.3.6.1. Marketing Strategy
                22.4.3.6.2. Product Strategy
                22.4.3.6.3. Channel Strategy
        22.4.4. Randox Laboratories Ltd.
            22.4.4.1. Overview
            22.4.4.2. Product Portfolio
            22.4.4.3. Key Financials
            22.4.4.4. Sales Footprint
            22.4.4.5. SWOT Analysis
            22.4.4.6. Strategy Overview
                22.4.4.6.1. Marketing Strategy
                22.4.4.6.2. Product Strategy
                22.4.4.6.3. Channel Strategy
        22.4.5. Thermo
            22.4.5.1. Overview
            22.4.5.2. Product Portfolio
            22.4.5.3. Key Financials
            22.4.5.4. Sales Footprint
            22.4.5.5. SWOT Analysis
            22.4.5.6. Strategy Overview
                22.4.5.6.1. Marketing Strategy
                22.4.5.6.2. Product Strategy
                22.4.5.6.3. Channel Strategy
        22.4.6. Beckman Coulter, Inc. (Danaher)
            22.4.6.1. Overview
            22.4.6.2. Product Portfolio
            22.4.6.3. Key Financials
            22.4.6.4. Sales Footprint
            22.4.6.5. SWOT Analysis
            22.4.6.6. Strategy Overview
                22.4.6.6.1. Marketing Strategy
                22.4.6.6.2. Product Strategy
                22.4.6.6.3. Channel Strategy
        22.4.7. Agilent Technologies, Inc.
            22.4.7.1. Overview
            22.4.7.2. Product Portfolio
            22.4.7.3. Key Financials
            22.4.7.4. Sales Footprint
            22.4.7.5. SWOT Analysis
            22.4.7.6. Strategy Overview
                22.4.7.6.1. Marketing Strategy
                22.4.7.6.2. Product Strategy
                22.4.7.6.3. Channel Strategy
        22.4.8. Elabscience Biotechnology Inc.
            22.4.8.1. Overview
            22.4.8.2. Product Portfolio
            22.4.8.3. Key Financials
            22.4.8.4. Sales Footprint
            22.4.8.5. SWOT Analysis
            22.4.8.6. Strategy Overview
                22.4.8.6.1. Marketing Strategy
                22.4.8.6.2. Product Strategy
                22.4.8.6.3. Channel Strategy
        22.4.9. Goldsite Diagnostics Inc.
            22.4.9.1. Overview
            22.4.9.2. Product Portfolio
            22.4.9.3. Key Financials
            22.4.9.4. Sales Footprint
            22.4.9.5. SWOT Analysis
            22.4.9.6. Strategy Overview
                22.4.9.6.1. Marketing Strategy
                22.4.9.6.2. Product Strategy
                22.4.9.6.3. Channel Strategy
        22.4.10. Hipro Biotechnology Co., Ltd.
            22.4.10.1. Overview
            22.4.10.2. Product Portfolio
            22.4.10.3. Key Financials
            22.4.10.4. Sales Footprint
            22.4.10.5. SWOT Analysis
            22.4.10.6. Strategy Overview
                22.4.10.6.1. Marketing Strategy
                22.4.10.6.2. Product Strategy
                22.4.10.6.3. Channel Strategy
        22.4.11. Beijing Strong Biotechnologies, Inc.
            22.4.11.1. Overview
            22.4.11.2. Product Portfolio
            22.4.11.3. Key Financials
            22.4.11.4. Sales Footprint
            22.4.11.5. SWOT Analysis
            22.4.11.6. Strategy Overview
                22.4.11.6.1. Marketing Strategy
                22.4.11.6.2. Product Strategy
                22.4.11.6.3. Channel Strategy
        22.4.12. Getein Biotech, Inc.
            22.4.12.1. Overview
            22.4.12.2. Product Portfolio
            22.4.12.3. Key Financials
            22.4.12.4. Sales Footprint
            22.4.12.5. SWOT Analysis
            22.4.12.6. Strategy Overview
                22.4.12.6.1. Marketing Strategy
                22.4.12.6.2. Product Strategy
                22.4.12.6.3. Channel Strategy
23. Assumptions and Acronyms Used
24. Research Methodology

Explore Healthcare Insights

View Reports
Future Market Insights

Nephelometry Kits Market

Schedule a Call