Natural Food and Beverage Preservatives Market Snapshot (2022 to 2032)

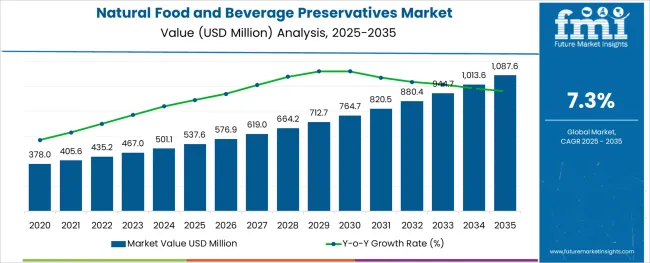
The global Natural Food And Beverage Preservatives market size is expected to reach USD 880.4 million in 2032. As per FMI Analysts, the global natural food and beverage preservatives market is estimated to be valued at USD 435.2 million in 2022 and is projected to increase at a CAGR of 7.3% in the forecast period from 2022 to 2032.

Report Attribute Details
Natural Food and Beverage Preservatives Market Estimated Base Year Value (2021) USD 405.59 Million
Natural Food and Beverage Preservatives Market Expected Market Value (2022) USD 435.2 Million
Natural Food and Beverage Preservatives Market Anticipated Forecast Value (2032) USD 880.4 Million
Natural Food and Beverage Preservatives Market Projected Growth Rate (2022 to 2032) 7.3% CAGR

Natural preservatives market growth is driven by the popularity of packaged food and beverages in the market. Consumers are becoming more dependent on packaged food products due to their busy lifestyles.

Eating ready-made food is becoming more popular. Therefore, food manufacturers are using natural preservatives in order to preserve food and extend its shelf life, in order to fulfill customer demand for natural preservatives.

To meet the anticipated demand for high-growth human milk oligosaccharides, Chr Hansen Holding A/S plans to invest more than EUR 200 million in production assets, including a brownfield factory.

Fast-paced lifestyles and increasing urbanization have had a significant impact on how people consume food, which has significantly raised the demand for ready-to-eat (RTE) food products. Due to its broad use in the creation of food products, the need for natural food preservatives has been steadily expanding alongside the demand for processed and packaged foods.

The need for natural food preservatives is anticipated to rise in the natural food and beverage preservatives market. In the food and beverage industry, there are growing health concerns about problems caused by the use of chemical-based food preservatives, which promotes the natural food and beverage preservatives market share.

The expansion of the global market for natural food preservatives has been constrained by the higher cost of natural food preservatives compared to synthetic food preservatives. Due to the high expense of generating natural food preservatives, small makers of food preservatives are forced to develop natural preservatives.

Natural food preservative companies have relied on product launches as their key strategy to expand their market share. They have also focused on partnership and acquisition in an effort to gain significant market share in the natural preservatives market.

Leading companies are developing cutting-edge marketing strategies, as well as carrying out technical advancements in medical diagnostics.

What are the Various Factors Driving the Natural Food and Beverage Preservatives Market?

The natural food and beverage preservatives market has received a lot of traction in the industry. In response to the burgeoning market for packaged food and beverages, the global natural preservatives market is primarily driven by the ever-increasing demand for ready-made food products.

Consumers are turning more and more to ready-made food products due to their busy lifestyles. Demand for foods with longer shelf lives has increased as a result of rising convenience product needs, driving up demand for natural food preservatives.

The usage of natural food preservatives has increased recently due to the rising demand for ready-to-eat food products. As they frequently don't contain preservatives, the rising demand for organic food items is limiting market growth for natural food preservatives.

There are many different methods and additives used to preserve food. These processes also include nuclear radiation for keeping natural foods and beverages preserved. Chemical preservatives are commonly used to prevent spoilage since they suppress the growth of microbes and bacteria.

What is Regional Analysis of Natural Food and Beverage Preservatives Market Share?

The global natural food and beverage preservatives market is segmented into seven regions, including North America, Latin America, Eastern Europe, Western Europe, Middle East and Africa (MEA), Asia Pacific excluding Japan (APEJ), and Japan.

Due to rapid urbanization and high consumer disposable income, China is experiencing a surge in the demand for packaged food products, such as frozen foods and sweets. The industry is also growing as organic food demand increases, necessitating the use of various types of food preservatives.

Due to the rapid adoption of convenience and packaged foods in Asia-Pacific and the Middle East & Africa, the natural food preservatives market forecasts an increase in demand for natural preservatives equipment.
How is the Performance of North America in the Natural Food and Beverage Preservatives Market?

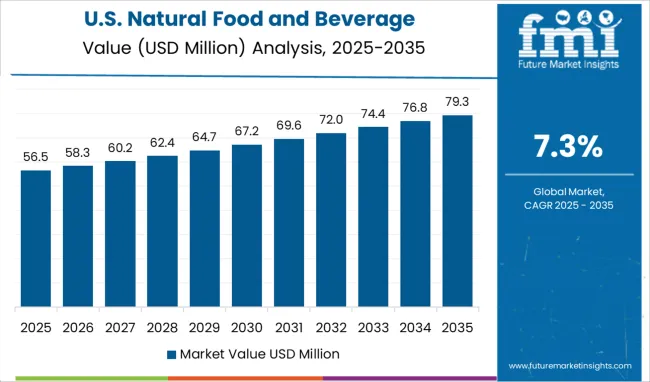
Taking up 37.5% of the market share, North America is projected to account for over one-third of the overall market in 2021. The United States dominates the natural food and beverage preservatives market, with a growth rate of 6%.

The primary factors anticipated to propel the growth of the natural food preservatives market in this region are the rise in consumption of ready-to-eat food products and the rise in consumption of healthy food, particularly with clean-label ingredients.
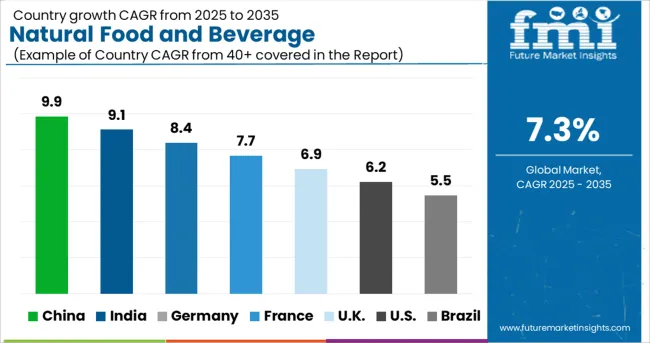
What Is The Europe Natural Food And Beverage Preservatives Market Outlook?

Approximately 28.5% of the natural food and beverage preservatives market share belongs to Europe. There has been a significant advancement in the technology for natural preservatives as a result of the number of illnesses caused by synthetic substances in food.

Prominent companies such as TRinternational, Inc., Chemical Stores Inc., and Bentoli Inc., among others, have made significant contributions to the science of natural preservatives.

How is the Start-up Ecosystem in the Natural Food and Beverage Preservatives Market?

Some of the leading companies operating in the global membrane filter cartridge market include Koninklijke DSM N.V. Akzo Nobel N.V., Cargill, Incorporated, DuPont, etc.

Hansen Holding A/S acquired JenneweinBiotechnologie GmbH in September 2021 to enter the high-growth human milk oligosaccharides market. Prior to 2025, the business plans to invest more than EUR 200 million in production assets, including a brownfield factory, to increase output and meet anticipated demand.

A major player, IFF, completed the merger with DuPont's nutrition and bioscience division in February 2021. IFF will continue to be the name of the new company.
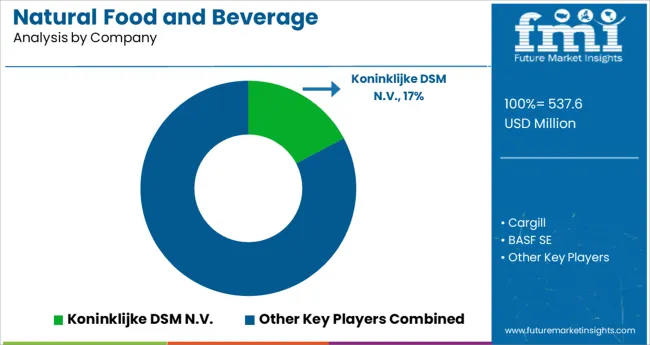
What is the Competition Landscape in the Natural Food and Beverage Preservatives Market?

Some of the leading companies operating in the global natural food and beverage preservatives market include Koninklijke DSM N.V. Akzo Nobel N.V., Cargill, Incorporated, DuPont, etc.

A number of key strategic initiatives have been adopted by the leading players in the natural food preservatives industry to gain significant market share globally, including product launches and partnership acquisitions.

Leading companies are embracing cutting-edge marketing strategies, technical advancements in medical diagnostics, and mergers and acquisitions.

  • DuPont's nutrition and biosciences division and IFF, a major player in the industry, merged in February 2021, with IFF still remaining as the company's name. As well, new innovative marketing techniques were employed by major suppliers such as Cargill Inc., Kerry Group, and Corbion Purac to increase demand for natural preservatives.
  • Hansen Holding A/S acquired Jennewein Biotechnology GmbH in September 2021 to enter the high-growth market for human milk oligosaccharides. It anticipates investing more than EUR 200 million in assets, including a brownfield factory, to significantly increase capacity and meet the demand for natural preservatives.

Report Scope

Report Attribute Details
Growth Rate CAGR of 7.3% from 2022 to 2032
Base Year for Estimation 2021
Historical Data 2015 to 2021
Forecast Period 2022 to 2032
Quantitative Units Revenue in USD Million, CAGR from 2022 to 2032
Report Coverage Revenue Forecast, Volume Forecast, Company Ranking, Competitive Landscape, Growth Factors, Trends, and Pricing Analysis
Segments Covered Product Type, Function, Application Type, Form, Region
Regions Covered North America; Latin America; Western Europe; Middle East and Africa
Key Countries Profiled United States of America, Canada, Brazil, Mexico, Germany, United Kingdom, France, Spain, Italy, Russia, Poland, Australia, New Zealand, China, India, Japan, GCC Countries, South Africa, North Africa
Key Companies Profiled Koninklijke DSM N.V.; Akzo Nobel N.V.; Cargill; Incorporated; DuPont
Customization Available Upon Request

Key Segments Profiled in the Natural Food and Beverage Preservatives Market

By Product Type:

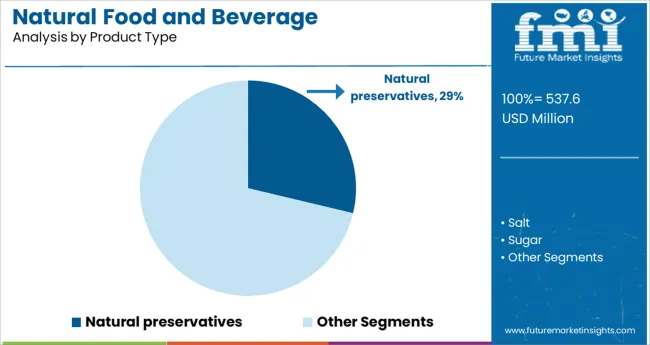
  • Natural preservatives
  • Salt
  • Sugar
  • Alcohol
  • Vinegar
  • Rosemary Extracts
  • Others
  • Artificial preservatives
  • Benzoates
  • Sodium Benzoate
  • Benzoic Acid
  • Nitrites
  • Sodium nitrates
  • Sulfite
  • Sulfur Dioxide
  • Acetic Acid
  • Sodium Diacetate
  • Lactic Acid
  • Sorbates
  • Sodium Sorbate
  • Potassium Sorbate
  • Propionates
  • Others

By Function:

  • Antimicrobials
  • Antioxidants
  • Chelating Agents
  • Flavoring agents
  • Restaurants
  • Emulsifier
  • Others

By Application Type:

  • Bakery
  • Beverages
  • Confectionery
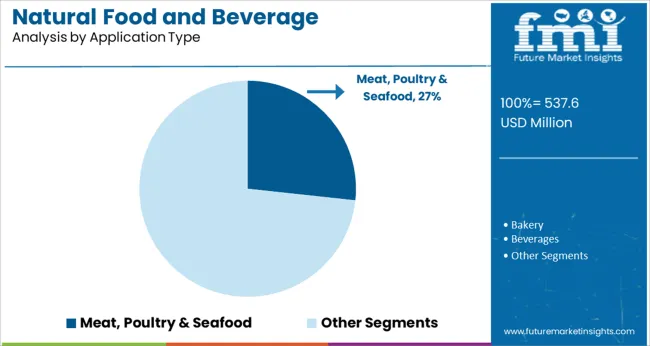
  • Meat, Poultry & Seafood
  • Frozen Food
  • Dairy products
  • Snack Food
  • Fats and Oils
  • Others

By Form:

  • Solid
  • Liquid

By Region:

  • North America
  • Latin America
  • Western Europe
  • Eastern Europe
  • Asia-Pacific
  • Japan
  • Middle East and Africa

Table of Content

  • 1. Executive Summary | Natural Food and Beverage Preservatives Market
  • 2. Market Overview
  • 3. Market Background
  • 4. Global Market Analysis 2017 to 2021 and Forecast 2022 to 2032
  • 5. Global Market Analysis 2017 to 2021 and Forecast 2022 to 2032, By Product Type
    • 5.1. Natural Preservatives
      • 5.1.1. Salt
      • 5.1.2. Sugar
      • 5.1.3. Alcohol
      • 5.1.4. Vinegar
      • 5.1.5. Rosemary Extracts
    • 5.2. Artificial Preservatives
      • 5.2.1. Benzoates
      • 5.2.2. Sodium Benzoate
      • 5.2.3. Benzoic Acid
      • 5.2.4. Nitrites
      • 5.2.5. Sodium Nitrates
      • 5.2.6. Sulfite
      • 5.2.7. Sulphur Dioxide
      • 5.2.8. Acetic Acid
      • 5.2.9. Sodium Diacetate
      • 5.2.10. Others
  • 6. Global Market Analysis 2017 to 2021 and Forecast 2022 to 2032, By Function
    • 6.1. Antimicrobials
    • 6.2. Antioxidants
    • 6.3. Chelating Agents
    • 6.4. Flavoring Agents
    • 6.5. Texturants
    • 6.6. Emulsifier
  • 7. Global Market Analysis 2017 to 2021 and Forecast 2022 to 2032, By Application
    • 7.1. Bakery
    • 7.2. Beverages
    • 7.3. Confectionery
    • 7.4. Meat, Poultry & Sea Food
    • 7.5. Frozen Food
    • 7.6. Dairy Products
    • 7.7. Snack Food
    • 7.8. Fats and Oils
  • 8. Global Market Analysis 2017 to 2021 and Forecast 2022 to 2032, By Form
    • 8.1. Solid
    • 8.2. Liquid
  • 9. Global Market Analysis 2017 to 2021 and Forecast 2022 to 2032, By Region
    • 9.1. North America
    • 9.2. Latin America
    • 9.3. Europe
    • 9.4. Asia Pacific
    • 9.5. Middle East and Africa
  • 10. North America Market Analysis 2017 to 2021 and Forecast 2022 to 2032, By Country
  • 11. Latin America Market Analysis 2017 to 2021 and Forecast 2022 to 2032, By Country
  • 12. Europe Market Analysis 2017 to 2021 and Forecast 2022 to 2032, By Country
  • 13. Asia Pacific Market Analysis 2017 to 2021 and Forecast 2022 to 2032, By Country
  • 14. Middle East and Africa Market Analysis 2017 to 2021 and Forecast 2022 to 2032, By Country
  • 15. Key Countries Market Analysis
  • 16. Market Structure Analysis
  • 17. Competition Analysis
    • 17.1. Koninklijke DSM N.V.
    • 17.2. Akzo Nobel N.V.
    • 17.3. Cargill
    • 17.4. DuPont
    • 17.5. Incorporated
    • 17.6. Kerry Group Plc
    • 17.7. BASF SE
    • 17.8. IFF Nutrition & Biosciences
    • 17.9. Lallemand Inc.
    • 17.10. ADM
  • 18. Assumptions & Acronyms Used
  • 19. Research Methodology

List of Tables

Table 1: Global Market Value (US$ Million) Forecast by Region, 2017 to 2032

Table 2: Global Market Volume (Tonnes) Forecast by Region, 2017 to 2032

Table 3: Global Market Value (US$ Million) Forecast by Product Type, 2017 to 2032

Table 4: Global Market Volume (Tonnes) Forecast by Product Type, 2017 to 2032

Table 5: Global Market Value (US$ Million) Forecast by Function, 2017 to 2032

Table 6: Global Market Volume (Tonnes) Forecast by Function, 2017 to 2032

Table 7: Global Market Value (US$ Million) Forecast by Application, 2017 to 2032

Table 8: Global Market Volume (Tonnes) Forecast by Application, 2017 to 2032

Table 9: Global Market Value (US$ Million) Forecast by Form, 2017 to 2032

Table 10: Global Market Volume (Tonnes) Forecast by Form, 2017 to 2032

Table 11: North America Market Value (US$ Million) Forecast by Country, 2017 to 2032

Table 12: North America Market Volume (Tonnes) Forecast by Country, 2017 to 2032

Table 13: North America Market Value (US$ Million) Forecast by Product Type, 2017 to 2032

Table 14: North America Market Volume (Tonnes) Forecast by Product Type, 2017 to 2032

Table 15: North America Market Value (US$ Million) Forecast by Function, 2017 to 2032

Table 16: North America Market Volume (Tonnes) Forecast by Function, 2017 to 2032

Table 17: North America Market Value (US$ Million) Forecast by Application, 2017 to 2032

Table 18: North America Market Volume (Tonnes) Forecast by Application, 2017 to 2032

Table 19: North America Market Value (US$ Million) Forecast by Form, 2017 to 2032

Table 20: North America Market Volume (Tonnes) Forecast by Form, 2017 to 2032

Table 21: Latin America Market Value (US$ Million) Forecast by Country, 2017 to 2032

Table 22: Latin America Market Volume (Tonnes) Forecast by Country, 2017 to 2032

Table 23: Latin America Market Value (US$ Million) Forecast by Product Type, 2017 to 2032

Table 24: Latin America Market Volume (Tonnes) Forecast by Product Type, 2017 to 2032

Table 25: Latin America Market Value (US$ Million) Forecast by Function, 2017 to 2032

Table 26: Latin America Market Volume (Tonnes) Forecast by Function, 2017 to 2032

Table 27: Latin America Market Value (US$ Million) Forecast by Application, 2017 to 2032

Table 28: Latin America Market Volume (Tonnes) Forecast by Application, 2017 to 2032

Table 29: Latin America Market Value (US$ Million) Forecast by Form, 2017 to 2032

Table 30: Latin America Market Volume (Tonnes) Forecast by Form, 2017 to 2032

Table 31: Europe Market Value (US$ Million) Forecast by Country, 2017 to 2032

Table 32: Europe Market Volume (Tonnes) Forecast by Country, 2017 to 2032

Table 33: Europe Market Value (US$ Million) Forecast by Product Type, 2017 to 2032

Table 34: Europe Market Volume (Tonnes) Forecast by Product Type, 2017 to 2032

Table 35: Europe Market Value (US$ Million) Forecast by Function, 2017 to 2032

Table 36: Europe Market Volume (Tonnes) Forecast by Function, 2017 to 2032

Table 37: Europe Market Value (US$ Million) Forecast by Application, 2017 to 2032

Table 38: Europe Market Volume (Tonnes) Forecast by Application, 2017 to 2032

Table 39: Europe Market Value (US$ Million) Forecast by Form, 2017 to 2032

Table 40: Europe Market Volume (Tonnes) Forecast by Form, 2017 to 2032

Table 41: Asia Pacific Market Value (US$ Million) Forecast by Country, 2017 to 2032

Table 42: Asia Pacific Market Volume (Tonnes) Forecast by Country, 2017 to 2032

Table 43: Asia Pacific Market Value (US$ Million) Forecast by Product Type, 2017 to 2032

Table 44: Asia Pacific Market Volume (Tonnes) Forecast by Product Type, 2017 to 2032

Table 45: Asia Pacific Market Value (US$ Million) Forecast by Function, 2017 to 2032

Table 46: Asia Pacific Market Volume (Tonnes) Forecast by Function, 2017 to 2032

Table 47: Asia Pacific Market Value (US$ Million) Forecast by Application, 2017 to 2032

Table 48: Asia Pacific Market Volume (Tonnes) Forecast by Application, 2017 to 2032

Table 49: Asia Pacific Market Value (US$ Million) Forecast by Form, 2017 to 2032

Table 50: Asia Pacific Market Volume (Tonnes) Forecast by Form, 2017 to 2032

Table 51: Middle East and Africa Market Value (US$ Million) Forecast by Country, 2017 to 2032

Table 52: Middle East and Africa Market Volume (Tonnes) Forecast by Country, 2017 to 2032

Table 53: Middle East and Africa Market Value (US$ Million) Forecast by Product Type, 2017 to 2032

Table 54: Middle East and Africa Market Volume (Tonnes) Forecast by Product Type, 2017 to 2032

Table 55: Middle East and Africa Market Value (US$ Million) Forecast by Function, 2017 to 2032

Table 56: Middle East and Africa Market Volume (Tonnes) Forecast by Function, 2017 to 2032

Table 57: Middle East and Africa Market Value (US$ Million) Forecast by Application, 2017 to 2032

Table 58: Middle East and Africa Market Volume (Tonnes) Forecast by Application, 2017 to 2032

Table 59: Middle East and Africa Market Value (US$ Million) Forecast by Form, 2017 to 2032

Table 60: Middle East and Africa Market Volume (Tonnes) Forecast by Form, 2017 to 2032

List of Figures

Figure 1: Global Market Value (US$ Million) by Product Type, 2022 to 2032

Figure 2: Global Market Value (US$ Million) by Function, 2022 to 2032

Figure 3: Global Market Value (US$ Million) by Application, 2022 to 2032

Figure 4: Global Market Value (US$ Million) by Form, 2022 to 2032

Figure 5: Global Market Value (US$ Million) by Region, 2022 to 2032

Figure 6: Global Market Value (US$ Million) Analysis by Region, 2017 to 2032

Figure 7: Global Market Volume (Tonnes) Analysis by Region, 2017 to 2032

Figure 8: Global Market Value Share (%) and BPS Analysis by Region, 2022 to 2032

Figure 9: Global Market Y-o-Y Growth (%) Projections by Region, 2022 to 2032

Figure 10: Global Market Value (US$ Million) Analysis by Product Type, 2017 to 2032

Figure 11: Global Market Volume (Tonnes) Analysis by Product Type, 2017 to 2032

Figure 12: Global Market Value Share (%) and BPS Analysis by Product Type, 2022 to 2032

Figure 13: Global Market Y-o-Y Growth (%) Projections by Product Type, 2022 to 2032

Figure 14: Global Market Value (US$ Million) Analysis by Function, 2017 to 2032

Figure 15: Global Market Volume (Tonnes) Analysis by Function, 2017 to 2032

Figure 16: Global Market Value Share (%) and BPS Analysis by Function, 2022 to 2032

Figure 17: Global Market Y-o-Y Growth (%) Projections by Function, 2022 to 2032

Figure 18: Global Market Value (US$ Million) Analysis by Application, 2017 to 2032

Figure 19: Global Market Volume (Tonnes) Analysis by Application, 2017 to 2032

Figure 20: Global Market Value Share (%) and BPS Analysis by Application, 2022 to 2032

Figure 21: Global Market Y-o-Y Growth (%) Projections by Application, 2022 to 2032

Figure 22: Global Market Value (US$ Million) Analysis by Form, 2017 to 2032

Figure 23: Global Market Volume (Tonnes) Analysis by Form, 2017 to 2032

Figure 24: Global Market Value Share (%) and BPS Analysis by Form, 2022 to 2032

Figure 25: Global Market Y-o-Y Growth (%) Projections by Form, 2022 to 2032

Figure 26: Global Market Attractiveness by Product Type, 2022 to 2032

Figure 27: Global Market Attractiveness by Function, 2022 to 2032

Figure 28: Global Market Attractiveness by Application, 2022 to 2032

Figure 29: Global Market Attractiveness by Form, 2022 to 2032

Figure 30: Global Market Attractiveness by Region, 2022 to 2032

Figure 31: North America Market Value (US$ Million) by Product Type, 2022 to 2032

Figure 32: North America Market Value (US$ Million) by Function, 2022 to 2032

Figure 33: North America Market Value (US$ Million) by Application, 2022 to 2032

Figure 34: North America Market Value (US$ Million) by Form, 2022 to 2032

Figure 35: North America Market Value (US$ Million) by Country, 2022 to 2032

Figure 36: North America Market Value (US$ Million) Analysis by Country, 2017 to 2032

Figure 37: North America Market Volume (Tonnes) Analysis by Country, 2017 to 2032

Figure 38: North America Market Value Share (%) and BPS Analysis by Country, 2022 to 2032

Figure 39: North America Market Y-o-Y Growth (%) Projections by Country, 2022 to 2032

Figure 40: North America Market Value (US$ Million) Analysis by Product Type, 2017 to 2032

Figure 41: North America Market Volume (Tonnes) Analysis by Product Type, 2017 to 2032

Figure 42: North America Market Value Share (%) and BPS Analysis by Product Type, 2022 to 2032

Figure 43: North America Market Y-o-Y Growth (%) Projections by Product Type, 2022 to 2032

Figure 44: North America Market Value (US$ Million) Analysis by Function, 2017 to 2032

Figure 45: North America Market Volume (Tonnes) Analysis by Function, 2017 to 2032

Figure 46: North America Market Value Share (%) and BPS Analysis by Function, 2022 to 2032

Figure 47: North America Market Y-o-Y Growth (%) Projections by Function, 2022 to 2032

Figure 48: North America Market Value (US$ Million) Analysis by Application, 2017 to 2032

Figure 49: North America Market Volume (Tonnes) Analysis by Application, 2017 to 2032

Figure 50: North America Market Value Share (%) and BPS Analysis by Application, 2022 to 2032

Figure 51: North America Market Y-o-Y Growth (%) Projections by Application, 2022 to 2032

Figure 52: North America Market Value (US$ Million) Analysis by Form, 2017 to 2032

Figure 53: North America Market Volume (Tonnes) Analysis by Form, 2017 to 2032

Figure 54: North America Market Value Share (%) and BPS Analysis by Form, 2022 to 2032

Figure 55: North America Market Y-o-Y Growth (%) Projections by Form, 2022 to 2032

Figure 56: North America Market Attractiveness by Product Type, 2022 to 2032

Figure 57: North America Market Attractiveness by Function, 2022 to 2032

Figure 58: North America Market Attractiveness by Application, 2022 to 2032

Figure 59: North America Market Attractiveness by Form, 2022 to 2032

Figure 60: North America Market Attractiveness by Country, 2022 to 2032

Figure 61: Latin America Market Value (US$ Million) by Product Type, 2022 to 2032

Figure 62: Latin America Market Value (US$ Million) by Function, 2022 to 2032

Figure 63: Latin America Market Value (US$ Million) by Application, 2022 to 2032

Figure 64: Latin America Market Value (US$ Million) by Form, 2022 to 2032

Figure 65: Latin America Market Value (US$ Million) by Country, 2022 to 2032

Figure 66: Latin America Market Value (US$ Million) Analysis by Country, 2017 to 2032

Figure 67: Latin America Market Volume (Tonnes) Analysis by Country, 2017 to 2032

Figure 68: Latin America Market Value Share (%) and BPS Analysis by Country, 2022 to 2032

Figure 69: Latin America Market Y-o-Y Growth (%) Projections by Country, 2022 to 2032

Figure 70: Latin America Market Value (US$ Million) Analysis by Product Type, 2017 to 2032

Figure 71: Latin America Market Volume (Tonnes) Analysis by Product Type, 2017 to 2032

Figure 72: Latin America Market Value Share (%) and BPS Analysis by Product Type, 2022 to 2032

Figure 73: Latin America Market Y-o-Y Growth (%) Projections by Product Type, 2022 to 2032

Figure 74: Latin America Market Value (US$ Million) Analysis by Function, 2017 to 2032

Figure 75: Latin America Market Volume (Tonnes) Analysis by Function, 2017 to 2032

Figure 76: Latin America Market Value Share (%) and BPS Analysis by Function, 2022 to 2032

Figure 77: Latin America Market Y-o-Y Growth (%) Projections by Function, 2022 to 2032

Figure 78: Latin America Market Value (US$ Million) Analysis by Application, 2017 to 2032

Figure 79: Latin America Market Volume (Tonnes) Analysis by Application, 2017 to 2032

Figure 80: Latin America Market Value Share (%) and BPS Analysis by Application, 2022 to 2032

Figure 81: Latin America Market Y-o-Y Growth (%) Projections by Application, 2022 to 2032

Figure 82: Latin America Market Value (US$ Million) Analysis by Form, 2017 to 2032

Figure 83: Latin America Market Volume (Tonnes) Analysis by Form, 2017 to 2032

Figure 84: Latin America Market Value Share (%) and BPS Analysis by Form, 2022 to 2032

Figure 85: Latin America Market Y-o-Y Growth (%) Projections by Form, 2022 to 2032

Figure 86: Latin America Market Attractiveness by Product Type, 2022 to 2032

Figure 87: Latin America Market Attractiveness by Function, 2022 to 2032

Figure 88: Latin America Market Attractiveness by Application, 2022 to 2032

Figure 89: Latin America Market Attractiveness by Form, 2022 to 2032

Figure 90: Latin America Market Attractiveness by Country, 2022 to 2032

Figure 91: Europe Market Value (US$ Million) by Product Type, 2022 to 2032

Figure 92: Europe Market Value (US$ Million) by Function, 2022 to 2032

Figure 93: Europe Market Value (US$ Million) by Application, 2022 to 2032

Figure 94: Europe Market Value (US$ Million) by Form, 2022 to 2032

Figure 95: Europe Market Value (US$ Million) by Country, 2022 to 2032

Figure 96: Europe Market Value (US$ Million) Analysis by Country, 2017 to 2032

Figure 97: Europe Market Volume (Tonnes) Analysis by Country, 2017 to 2032

Figure 98: Europe Market Value Share (%) and BPS Analysis by Country, 2022 to 2032

Figure 99: Europe Market Y-o-Y Growth (%) Projections by Country, 2022 to 2032

Figure 100: Europe Market Value (US$ Million) Analysis by Product Type, 2017 to 2032

Figure 101: Europe Market Volume (Tonnes) Analysis by Product Type, 2017 to 2032

Figure 102: Europe Market Value Share (%) and BPS Analysis by Product Type, 2022 to 2032

Figure 103: Europe Market Y-o-Y Growth (%) Projections by Product Type, 2022 to 2032

Figure 104: Europe Market Value (US$ Million) Analysis by Function, 2017 to 2032

Figure 105: Europe Market Volume (Tonnes) Analysis by Function, 2017 to 2032

Figure 106: Europe Market Value Share (%) and BPS Analysis by Function, 2022 to 2032

Figure 107: Europe Market Y-o-Y Growth (%) Projections by Function, 2022 to 2032

Figure 108: Europe Market Value (US$ Million) Analysis by Application, 2017 to 2032

Figure 109: Europe Market Volume (Tonnes) Analysis by Application, 2017 to 2032

Figure 110: Europe Market Value Share (%) and BPS Analysis by Application, 2022 to 2032

Figure 111: Europe Market Y-o-Y Growth (%) Projections by Application, 2022 to 2032

Figure 112: Europe Market Value (US$ Million) Analysis by Form, 2017 to 2032

Figure 113: Europe Market Volume (Tonnes) Analysis by Form, 2017 to 2032

Figure 114: Europe Market Value Share (%) and BPS Analysis by Form, 2022 to 2032

Figure 115: Europe Market Y-o-Y Growth (%) Projections by Form, 2022 to 2032

Figure 116: Europe Market Attractiveness by Product Type, 2022 to 2032

Figure 117: Europe Market Attractiveness by Function, 2022 to 2032

Figure 118: Europe Market Attractiveness by Application, 2022 to 2032

Figure 119: Europe Market Attractiveness by Form, 2022 to 2032

Figure 120: Europe Market Attractiveness by Country, 2022 to 2032

Figure 121: Asia Pacific Market Value (US$ Million) by Product Type, 2022 to 2032

Figure 122: Asia Pacific Market Value (US$ Million) by Function, 2022 to 2032

Figure 123: Asia Pacific Market Value (US$ Million) by Application, 2022 to 2032

Figure 124: Asia Pacific Market Value (US$ Million) by Form, 2022 to 2032

Figure 125: Asia Pacific Market Value (US$ Million) by Country, 2022 to 2032

Figure 126: Asia Pacific Market Value (US$ Million) Analysis by Country, 2017 to 2032

Figure 127: Asia Pacific Market Volume (Tonnes) Analysis by Country, 2017 to 2032

Figure 128: Asia Pacific Market Value Share (%) and BPS Analysis by Country, 2022 to 2032

Figure 129: Asia Pacific Market Y-o-Y Growth (%) Projections by Country, 2022 to 2032

Figure 130: Asia Pacific Market Value (US$ Million) Analysis by Product Type, 2017 to 2032

Figure 131: Asia Pacific Market Volume (Tonnes) Analysis by Product Type, 2017 to 2032

Figure 132: Asia Pacific Market Value Share (%) and BPS Analysis by Product Type, 2022 to 2032

Figure 133: Asia Pacific Market Y-o-Y Growth (%) Projections by Product Type, 2022 to 2032

Figure 134: Asia Pacific Market Value (US$ Million) Analysis by Function, 2017 to 2032

Figure 135: Asia Pacific Market Volume (Tonnes) Analysis by Function, 2017 to 2032

Figure 136: Asia Pacific Market Value Share (%) and BPS Analysis by Function, 2022 to 2032

Figure 137: Asia Pacific Market Y-o-Y Growth (%) Projections by Function, 2022 to 2032

Figure 138: Asia Pacific Market Value (US$ Million) Analysis by Application, 2017 to 2032

Figure 139: Asia Pacific Market Volume (Tonnes) Analysis by Application, 2017 to 2032

Figure 140: Asia Pacific Market Value Share (%) and BPS Analysis by Application, 2022 to 2032

Figure 141: Asia Pacific Market Y-o-Y Growth (%) Projections by Application, 2022 to 2032

Figure 142: Asia Pacific Market Value (US$ Million) Analysis by Form, 2017 to 2032

Figure 143: Asia Pacific Market Volume (Tonnes) Analysis by Form, 2017 to 2032

Figure 144: Asia Pacific Market Value Share (%) and BPS Analysis by Form, 2022 to 2032

Figure 145: Asia Pacific Market Y-o-Y Growth (%) Projections by Form, 2022 to 2032

Figure 146: Asia Pacific Market Attractiveness by Product Type, 2022 to 2032

Figure 147: Asia Pacific Market Attractiveness by Function, 2022 to 2032

Figure 148: Asia Pacific Market Attractiveness by Application, 2022 to 2032

Figure 149: Asia Pacific Market Attractiveness by Form, 2022 to 2032

Figure 150: Asia Pacific Market Attractiveness by Country, 2022 to 2032

Figure 151: Middle East and Africa Market Value (US$ Million) by Product Type, 2022 to 2032

Figure 152: Middle East and Africa Market Value (US$ Million) by Function, 2022 to 2032

Figure 153: Middle East and Africa Market Value (US$ Million) by Application, 2022 to 2032

Figure 154: Middle East and Africa Market Value (US$ Million) by Form, 2022 to 2032

Figure 155: Middle East and Africa Market Value (US$ Million) by Country, 2022 to 2032

Figure 156: Middle East and Africa Market Value (US$ Million) Analysis by Country, 2017 to 2032

Figure 157: Middle East and Africa Market Volume (Tonnes) Analysis by Country, 2017 to 2032

Figure 158: Middle East and Africa Market Value Share (%) and BPS Analysis by Country, 2022 to 2032

Figure 159: Middle East and Africa Market Y-o-Y Growth (%) Projections by Country, 2022 to 2032

Figure 160: Middle East and Africa Market Value (US$ Million) Analysis by Product Type, 2017 to 2032

Figure 161: Middle East and Africa Market Volume (Tonnes) Analysis by Product Type, 2017 to 2032

Figure 162: Middle East and Africa Market Value Share (%) and BPS Analysis by Product Type, 2022 to 2032

Figure 163: Middle East and Africa Market Y-o-Y Growth (%) Projections by Product Type, 2022 to 2032

Figure 164: Middle East and Africa Market Value (US$ Million) Analysis by Function, 2017 to 2032

Figure 165: Middle East and Africa Market Volume (Tonnes) Analysis by Function, 2017 to 2032

Figure 166: Middle East and Africa Market Value Share (%) and BPS Analysis by Function, 2022 to 2032

Figure 167: Middle East and Africa Market Y-o-Y Growth (%) Projections by Function, 2022 to 2032

Figure 168: Middle East and Africa Market Value (US$ Million) Analysis by Application, 2017 to 2032

Figure 169: Middle East and Africa Market Volume (Tonnes) Analysis by Application, 2017 to 2032

Figure 170: Middle East and Africa Market Value Share (%) and BPS Analysis by Application, 2022 to 2032

Figure 171: Middle East and Africa Market Y-o-Y Growth (%) Projections by Application, 2022 to 2032

Figure 172: Middle East and Africa Market Value (US$ Million) Analysis by Form, 2017 to 2032

Figure 173: Middle East and Africa Market Volume (Tonnes) Analysis by Form, 2017 to 2032

Figure 174: Middle East and Africa Market Value Share (%) and BPS Analysis by Form, 2022 to 2032

Figure 175: Middle East and Africa Market Y-o-Y Growth (%) Projections by Form, 2022 to 2032

Figure 176: Middle East and Africa Market Attractiveness by Product Type, 2022 to 2032

Figure 177: Middle East and Africa Market Attractiveness by Function, 2022 to 2032

Figure 178: Middle East and Africa Market Attractiveness by Application, 2022 to 2032

Figure 179: Middle East and Africa Market Attractiveness by Form, 2022 to 2032

Figure 180: Middle East and Africa Market Attractiveness by Country, 2022 to 2032

Frequently Asked Questions

At What Rate will the Natural Food and Beverage Preservatives Market Grow?

The global natural food and beverage preservatives market is projected to exceed USD 880.4 Million by 2032.

Which Region is set to Lead the Natural Food and Beverage Preservatives Market?

The USA is projected to lead the natural food and beverage preservatives market in the forecast period.

What is the Growth Outlook for the Natural Food and Beverage Preservatives Market?

The natural food and beverage preservatives market is likely to secure a CAGR of 7.3% through 2032.

Explore Functional Food Ingredients Insights

Future Market Insights

Natural Food and Beverage Preservatives Market