Natamycin Market Analysis – Size, Share, and Forecast 2022 to 2032

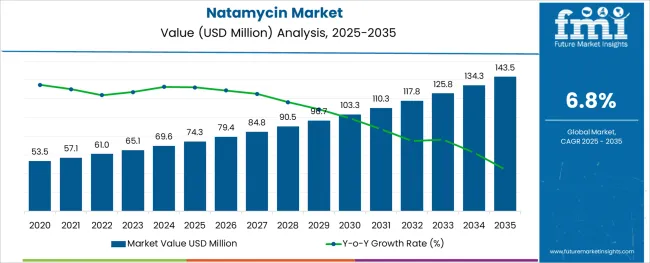
The global Natamycin Market size is expected to reach USD 61.0 Million in 2022 and further expand at a CAGR of 6.8% throughout the forecast period (2022 to 2032). Overall natamycin sales are projected to surpass a total valuation of USD 102.7 Million by the end of 2032.

Rising applications across industries like food and beverage, pharmaceuticals, animal feed, personal care, and pharmaceuticals a key factors driving natamycin demand globally.

Natamycin, also called pimaricin, is an antifungal medication for topical ophthalmic administration to treat fungal infections around the eye, including infections of the cornea, and eyelids.

Once applied, natamycin binds to sterols in fungal cell membranes by exerting its antifungal effects, thereby increasing membrane permeability and eventually blocking fungal growth.

Thus, the rising prevalence of eye disease coupled with the increasing usage of natamycin as an effective antifungal drug will boost the global natamycin industry during the forecast period.

Similarly, increasing preference for natural preservatives along with the growing need for reducing food waste is acting as a catalyst propelling natamycin demand globally.

Increasing food wastage has become a serious concern for both consumers and manufacturers.

According to the Food and Agriculture Organization of the United Nations, approximately 1.3 billion tonnes of food produced gets lost or wasted globally. One of the main reasons for this is food spoilage.

Food spoilage can be delayed or prevented by adding safe and effective preservatives like natamycin which prevents the growth of microorganisms and extends the shelf life of products.

Natamycin has become an ideal bio-preservative or bio-preservation solution used in food products like cheese, sausages, meat, and bakeries to naturally extend their shelf life, prevent microbial growth and reduce food waste.

Thus, rising production and consumption of these products supported by the rapid growth of the food processing industry will continue to generate high demand for natamycin.

Natamycin has been declared safe by organizations like the Food and Drug Administration (FDA) and the European Food Safety Authority (EFSA). This has become a game-changing move for the manufacturers of natamycin.

Additionally, widening applications in nutraceuticals, cosmetics & personal care, animal feed, and pet food sectors will boost natamycin sales over the projection period.

Attribute Key Insights
Natamycin Market Estimated Value (2022E) USD 61.0 Million
Projected Market Value (2033F) USD 102.7 Million
Value-based CAGR (2022 to 2032) 6.8%
USA Market Share 39.7%

2017 to 2021 Global Natamycin Sales Outlook Compared to Forecast from 2022 to 2032

According to Future Market Insights’ latest analysis, the global demand for natamycin is projected to surge at a robust CAGR of 6.8% between 2022 and 2032, in comparison to the 5.4% CAGR registered during the historical period from 2017 to 2021.

Increasing usage of natamycin across diverse industries including pharmaceutical and food & beverage is a key factor spurring growth in the global market for natamycin.

Natamycin is a natural antimicrobial preservative used to prevent the growth of fungi, bacteria, and other microbes in food products. It has been used as an additive in foods for decades and has seen increased demand over the years due to its superior safety profile compared to other additives.

Demand for natamycin is expected to grow at a healthy pace during the next ten years owing to the growing need for preventing food wastage, increasing consumer spending on processed food products, rising application of natamycin in food products such as cheese, bakeries, and processed meat,

Besides this, the rising usage of natamycin as an antifungal medication to treat several fungal infections around the eye will create lucrative opportunities for natamycin manufacturers during the next ten years.

Key Trends Shaping the Growth of the Natamycin Industry

Rising Inclination Towards Clean Label Foods to Positively Impact Natamycin Industry

The trend towards clean-label foods has been growing steadily in recent years, driven by consumer demand for natural ingredients and more transparency on food labels. This shift is having a significant effect on the natamycin market, as manufacturers seek out more natural preservatives to replace synthetic ones.

Natamycin is a naturally-occurring preservative derived from the fermentation of Streptomyces bacteria. It is commonly used in processed foods such as cheese, yogurt, and other dairy products to extend shelf life and guard against spoilage from mold or bacteria.

However, the demand for clean-label foods has made it increasingly difficult for manufacturers to use natamycin due to its synthetically produced status.

As a result, many companies have turned towards more natural preservatives such as vinegar or citrus extracts which are perceived as safer options by health-conscious consumers. This may limit the market expansion to some extent.
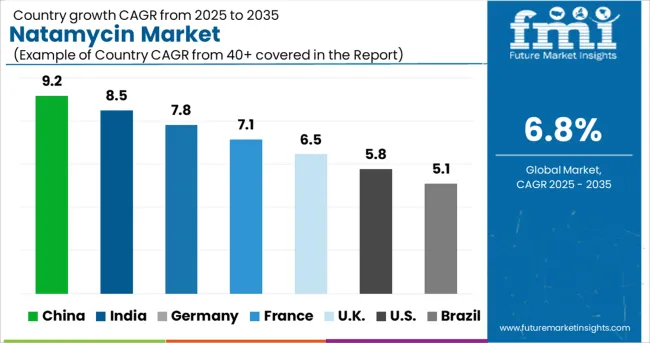
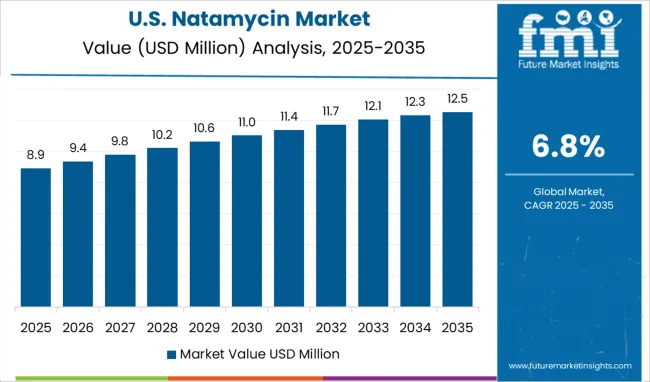
Top Countries Leading Adoption and Production of Natamycin

How is the USA Natamycin Market Shaping?

Rising Usage in Topical Ophthalmic Drugs to Boost Natamycin Sales in the USA Through 2032

The USA's natamycin market is a quickly changing landscape that has seen an increase in demand due to its medical and food safety applications.

Natamycin, an antifungal agent, is widely used as a preservative in products such as cheese and processed meats. As the world increasingly moves towards healthier diets, demand for natamycin has been growing significantly over the past few years across the USA

The increasing prevalence of fungal infections, maturing population, and rising health consciousness among consumers are some of the key factors driving the USA's natamycin industry.

In addition to its use in food products, natamycin is also being used increasingly as a topical drug to treat skin and eye infections caused by fungi. This has led to increased demand for this product from hospitals and pharmacists across the USA and the trend is expected to further escalate amid rising cases of fungal diseases.

Why is the UK Emerging as a Leading Natamycin Producer?

Escalating Research and Development Activities Making the UK a Promising Market

Recently, Europe, spearheaded by the UK, has emerged as a leading producer of natamycin due to its commitment to research and development of this important product.

The primary reason why Europe is becoming a leader in natamycin production is its commitment to long-term investments in research and development activities.

For example, European businesses are investing heavily in ways to increase the efficiency of their production processes and make them more cost-effective. Additionally, they are looking into new technologies that can help reduce waste while still delivering quality natamycin.

Another key factor that is expected to propel natamycin demand across the UK is the rising production and consumption of packaged food products with longer shelf life.

Consumers in the UK seek convenient foods that stay fresh for longer and contain natural ingredients. As a result, food manufacturers are using preservatives like natamycin.

Natamycin Industry Analysis by Type, Application, and End Use

Which is the Most Commonly Used Form of Natamycin?

Demand Remains High for Powdered Natamycin

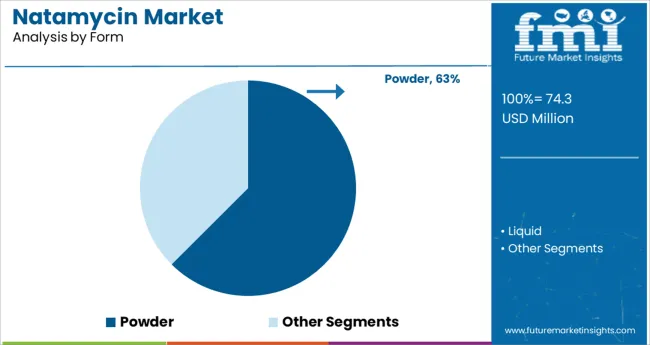
Based on form, the global market for natamycin is segmented into powder and liquid. Among these, the powder segment currently holds the largest market and is expected to retain its dominance during the forecast period. This is due to rising end-user preference for powdered natamycin over other forms.

The use of natamycin powder is advantageous from a cost perspective as it often comes at a lower price than other forms. Additionally, its shelf life is longer than that of liquid or suspension forms which makes it more convenient for food manufacturers to stock up on the powder form for longer-term use.

This allows them to better manage their inventory levels and reduce wastage costs.

Which is the Most Lucrative Application for Natamycin?

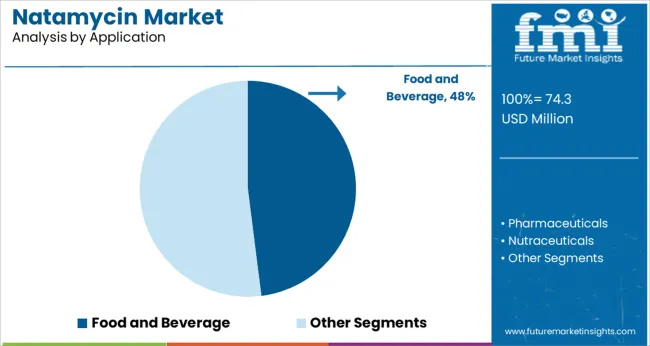
Food and Beverage to Remains the Most Profitable Application

Natamycin is a natural antibiotic that can be used in the food and beverage industries. It inhibits the growth of bacteria, yeast, and mold. It is not harmful to humans or pets, and it does not produce any adverse effects on food. As a result, it has become one of the widely used natural preservatives in the food & beverage sector.

Natamycin is extensively used in food products such as sausages, cheese, bakery items, processed meat, fruits & vegetables, beverages, and others for preventing the growth of bacteria and other microorganisms. Hence, it extends the shelf life of products and reduces food wastage.

Growing demand for packaging food products with longer shelf life along with the rising need for reducing food wastage is playing a key role in boosting natamycin sales and the trend is expected to continue during the next ten years.
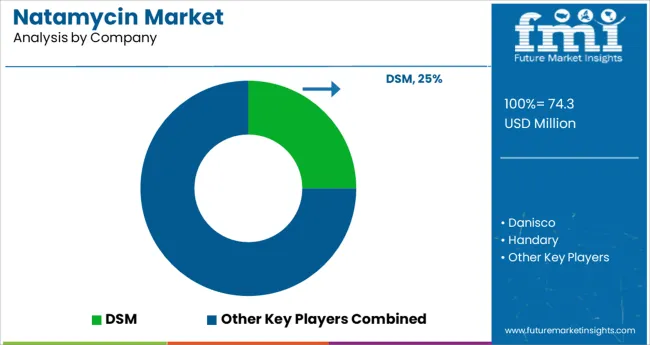
Competitive Landscape of the Global Natamycin Market

The global market for natamycin is quite competitive due to the vast number of producers that operate in this space. The major businesses are making significant investments in Research and Development, which is anticipated to accelerate the expansion of the industry as a whole over the coming years.

Additionally, during the projected period, market participants should benefit significantly from the increased focus on diversifying product portfolios and the rise in mergers and acquisitions.

Recent Developments:

  • In August 2022, for supplying and distributing NATACYN (natamycin) in various markets outside the USA, Clinigen Group plc signed an exclusive agreement with Eyevance Pharmaceuticals.
  • In November 2022, HANDARY unveiled its new natural shelf-life solutions for plant-based foods at Gulfood Manufacturing Expo held in Dubai.
  • In 2019, Royal DSM showcased its complete portfolio of biopreservation solutions at IFT 2019. The new range will enable beverage, dairy, and baking manufacturers to effectively extend the shelf life of their products.

Scope of the Natamycin Market Report

Attribute Details
Estimated Market Size (2022) USD 61.0 Million
Projected Market Size (2032) USD 102.7 Million
Anticipated Growth Rate (2022 to 2032) 6.8% CAGR
Forecast Period 2022 to 2032
Historical Data Available for 2017 to 2021
Market Analysis USD Million for Value and Million. Sq. M. for Volume
Key Regions Covered North America; Latin America; Europe; East Asia; South Asia; and the Middle East & Africa
Key Countries Covered USA, Brazil, Mexico, Germany, UK, China, India, Japan, Australia, and GCC Countries
Key Segments Covered Form, Application, and Region
Key Companies Profiled DSM; Danisco; Handary; VGP; Silver-Elephant; AMTECH BIOTECH; Lanzhou Weiri; Zhengzhou New Frey; Langfang Meihua; Beijing Oriental Rada; Chihon; Jiaozuo Join care; Pucheng Life come
Report Coverage Market Forecast, Company Share Analysis, Competition Intelligence, Drivers, Restraints, Opportunities and Threats Analysis, Market Dynamics and Challenges, and Strategic Growth Initiatives

Natamycin Market Segmentation by Category and Function

By Form:

  • Powder
  • Liquid

By Application:

  • Food and Beverage
  • Pharmaceuticals
  • Nutraceuticals
  • Cosmetics & Personal Care
  • Pet Food
  • Animal Feed

By Region:

  • North America
  • Latin America
  • Europe
  • East Asia
  • South Asia
  • Middle East & Africa

Table of Content

  • 1. Executive Summary | Natamycin Market
  • 2. Market Overview
  • 3. Market Background
  • 4. Global Market Analysis 2017 to 2021 and Forecast, 2022 to 2032
  • 5. Global Market Analysis 2017 to 2021 and Forecast 2022 to 2032, By Form
    • 5.1. Powder
    • 5.2. Liquid
  • 6. Global Market Analysis 2017 to 2021 and Forecast 2022 to 2032, By Application
    • 6.1. Food and Beverage
    • 6.2. Pharmaceuticals
    • 6.3. Nutraceuticals
    • 6.4. Cosmetics & Personal Care
    • 6.5. Pet Food
    • 6.6. Animal Feed
  • 7. Global Market Analysis 2017 to 2021 and Forecast 2022 to 2032, By Region
    • 7.1. North America
    • 7.2. Latin America
    • 7.3. Europe
    • 7.4. East Asia
    • 7.5. South Asia
    • 7.6. Oceania
    • 7.7. Middle East and Africa (MEA)
  • 8. North America Market Analysis 2017 to 2021 and Forecast 2022 to 2032, By Country
  • 9. Latin America Market Analysis 2017 to 2021 and Forecast 2022 to 2032, By Country
  • 10. Europe Market Analysis 2017 to 2021 and Forecast 2022 to 2032, By Country
  • 11. East Asia Market Analysis 2017 to 2021 and Forecast 2022 to 2032, By Country
  • 12. South Asia Market Analysis 2017 to 2021 and Forecast 2022 to 2032, By Country
  • 13. Oceania Market Analysis 2017 to 2021 and Forecast 2022 to 2032, By Country
  • 14. MEA Market Analysis 2017 to 2021 and Forecast 2022 to 2032, By Country
  • 15. Key Countries Market Analysis
  • 16. Market Structure Analysis
  • 17. Competition Analysis
    • 17.1. DSM
    • 17.2. Danisco
    • 17.3. Handary
    • 17.4. VGP
    • 17.5. Silver-Elephant
    • 17.6. AMTECH BIOTECH
    • 17.7. Lanzhou Weiri
    • 17.8. Zhengzhou New Frey
    • 17.9. Langfang Meihua
    • 17.10. Beijing Oriental Rada
    • 17.11. Chihon
    • 17.12. Jiaozuo Join care
    • 17.13. Pucheng Life come
  • 18. Assumptions & Acronyms Used
  • 19. Research Methodology

List of Tables

Table 1: Global Market Value (US$ Million) Forecast by Region, 2017 to 2032

Table 2: Global Market Volume (MT) Forecast by Region, 2017 to 2032

Table 3: Global Market Value (US$ Million) Forecast by Form, 2017 to 2032

Table 4: Global Market Volume (MT) Forecast by Form, 2017 to 2032

Table 5: Global Market Value (US$ Million) Forecast by Application, 2017 to 2032

Table 6: Global Market Volume (MT) Forecast by Application, 2017 to 2032

Table 7: North America Market Value (US$ Million) Forecast by Country, 2017 to 2032

Table 8: North America Market Volume (MT) Forecast by Country, 2017 to 2032

Table 9: North America Market Value (US$ Million) Forecast by Form, 2017 to 2032

Table 10: North America Market Volume (MT) Forecast by Form, 2017 to 2032

Table 11: North America Market Value (US$ Million) Forecast by Application, 2017 to 2032

Table 12: North America Market Volume (MT) Forecast by Application, 2017 to 2032

Table 13: Latin America Market Value (US$ Million) Forecast by Country, 2017 to 2032

Table 14: Latin America Market Volume (MT) Forecast by Country, 2017 to 2032

Table 15: Latin America Market Value (US$ Million) Forecast by Form, 2017 to 2032

Table 16: Latin America Market Volume (MT) Forecast by Form, 2017 to 2032

Table 17: Latin America Market Value (US$ Million) Forecast by Application, 2017 to 2032

Table 18: Latin America Market Volume (MT) Forecast by Application, 2017 to 2032

Table 19: Europe Market Value (US$ Million) Forecast by Country, 2017 to 2032

Table 20: Europe Market Volume (MT) Forecast by Country, 2017 to 2032

Table 21: Europe Market Value (US$ Million) Forecast by Form, 2017 to 2032

Table 22: Europe Market Volume (MT) Forecast by Form, 2017 to 2032

Table 23: Europe Market Value (US$ Million) Forecast by Application, 2017 to 2032

Table 24: Europe Market Volume (MT) Forecast by Application, 2017 to 2032

Table 25: East Asia Market Value (US$ Million) Forecast by Country, 2017 to 2032

Table 26: East Asia Market Volume (MT) Forecast by Country, 2017 to 2032

Table 27: East Asia Market Value (US$ Million) Forecast by Form, 2017 to 2032

Table 28: East Asia Market Volume (MT) Forecast by Form, 2017 to 2032

Table 29: East Asia Market Value (US$ Million) Forecast by Application, 2017 to 2032

Table 30: East Asia Market Volume (MT) Forecast by Application, 2017 to 2032

Table 31: South Asia Market Value (US$ Million) Forecast by Country, 2017 to 2032

Table 32: South Asia Market Volume (MT) Forecast by Country, 2017 to 2032

Table 33: South Asia Market Value (US$ Million) Forecast by Form, 2017 to 2032

Table 34: South Asia Market Volume (MT) Forecast by Form, 2017 to 2032

Table 35: South Asia Market Value (US$ Million) Forecast by Application, 2017 to 2032

Table 36: South Asia Market Volume (MT) Forecast by Application, 2017 to 2032

Table 37: Oceania Market Value (US$ Million) Forecast by Country, 2017 to 2032

Table 38: Oceania Market Volume (MT) Forecast by Country, 2017 to 2032

Table 39: Oceania Market Value (US$ Million) Forecast by Form, 2017 to 2032

Table 40: Oceania Market Volume (MT) Forecast by Form, 2017 to 2032

Table 41: Oceania Market Value (US$ Million) Forecast by Application, 2017 to 2032

Table 42: Oceania Market Volume (MT) Forecast by Application, 2017 to 2032

Table 43: MEA Market Value (US$ Million) Forecast by Country, 2017 to 2032

Table 44: MEA Market Volume (MT) Forecast by Country, 2017 to 2032

Table 45: MEA Market Value (US$ Million) Forecast by Form, 2017 to 2032

Table 46: MEA Market Volume (MT) Forecast by Form, 2017 to 2032

Table 47: MEA Market Value (US$ Million) Forecast by Application, 2017 to 2032

Table 48: MEA Market Volume (MT) Forecast by Application, 2017 to 2032

List of Figures

Figure 1: Global Market Value (US$ Million) by Form, 2022 to 2032

Figure 2: Global Market Value (US$ Million) by Application, 2022 to 2032

Figure 3: Global Market Value (US$ Million) by Region, 2022 to 2032

Figure 4: Global Market Value (US$ Million) Analysis by Region, 2017 to 2032

Figure 5: Global Market Volume (MT) Analysis by Region, 2017 to 2032

Figure 6: Global Market Value Share (%) and BPS Analysis by Region, 2022 to 2032

Figure 7: Global Market Y-o-Y Growth (%) Projections by Region, 2022 to 2032

Figure 8: Global Market Value (US$ Million) Analysis by Form, 2017 to 2032

Figure 9: Global Market Volume (MT) Analysis by Form, 2017 to 2032

Figure 10: Global Market Value Share (%) and BPS Analysis by Form, 2022 to 2032

Figure 11: Global Market Y-o-Y Growth (%) Projections by Form, 2022 to 2032

Figure 12: Global Market Value (US$ Million) Analysis by Application, 2017 to 2032

Figure 13: Global Market Volume (MT) Analysis by Application, 2017 to 2032

Figure 14: Global Market Value Share (%) and BPS Analysis by Application, 2022 to 2032

Figure 15: Global Market Y-o-Y Growth (%) Projections by Application, 2022 to 2032

Figure 16: Global Market Attractiveness by Form, 2022 to 2032

Figure 17: Global Market Attractiveness by Application, 2022 to 2032

Figure 18: Global Market Attractiveness by Region, 2022 to 2032

Figure 19: North America Market Value (US$ Million) by Form, 2022 to 2032

Figure 20: North America Market Value (US$ Million) by Application, 2022 to 2032

Figure 21: North America Market Value (US$ Million) by Country, 2022 to 2032

Figure 22: North America Market Value (US$ Million) Analysis by Country, 2017 to 2032

Figure 23: North America Market Volume (MT) Analysis by Country, 2017 to 2032

Figure 24: North America Market Value Share (%) and BPS Analysis by Country, 2022 to 2032

Figure 25: North America Market Y-o-Y Growth (%) Projections by Country, 2022 to 2032

Figure 26: North America Market Value (US$ Million) Analysis by Form, 2017 to 2032

Figure 27: North America Market Volume (MT) Analysis by Form, 2017 to 2032

Figure 28: North America Market Value Share (%) and BPS Analysis by Form, 2022 to 2032

Figure 29: North America Market Y-o-Y Growth (%) Projections by Form, 2022 to 2032

Figure 30: North America Market Value (US$ Million) Analysis by Application, 2017 to 2032

Figure 31: North America Market Volume (MT) Analysis by Application, 2017 to 2032

Figure 32: North America Market Value Share (%) and BPS Analysis by Application, 2022 to 2032

Figure 33: North America Market Y-o-Y Growth (%) Projections by Application, 2022 to 2032

Figure 34: North America Market Attractiveness by Form, 2022 to 2032

Figure 35: North America Market Attractiveness by Application, 2022 to 2032

Figure 36: North America Market Attractiveness by Country, 2022 to 2032

Figure 37: Latin America Market Value (US$ Million) by Form, 2022 to 2032

Figure 38: Latin America Market Value (US$ Million) by Application, 2022 to 2032

Figure 39: Latin America Market Value (US$ Million) by Country, 2022 to 2032

Figure 40: Latin America Market Value (US$ Million) Analysis by Country, 2017 to 2032

Figure 41: Latin America Market Volume (MT) Analysis by Country, 2017 to 2032

Figure 42: Latin America Market Value Share (%) and BPS Analysis by Country, 2022 to 2032

Figure 43: Latin America Market Y-o-Y Growth (%) Projections by Country, 2022 to 2032

Figure 44: Latin America Market Value (US$ Million) Analysis by Form, 2017 to 2032

Figure 45: Latin America Market Volume (MT) Analysis by Form, 2017 to 2032

Figure 46: Latin America Market Value Share (%) and BPS Analysis by Form, 2022 to 2032

Figure 47: Latin America Market Y-o-Y Growth (%) Projections by Form, 2022 to 2032

Figure 48: Latin America Market Value (US$ Million) Analysis by Application, 2017 to 2032

Figure 49: Latin America Market Volume (MT) Analysis by Application, 2017 to 2032

Figure 50: Latin America Market Value Share (%) and BPS Analysis by Application, 2022 to 2032

Figure 51: Latin America Market Y-o-Y Growth (%) Projections by Application, 2022 to 2032

Figure 52: Latin America Market Attractiveness by Form, 2022 to 2032

Figure 53: Latin America Market Attractiveness by Application, 2022 to 2032

Figure 54: Latin America Market Attractiveness by Country, 2022 to 2032

Figure 55: Europe Market Value (US$ Million) by Form, 2022 to 2032

Figure 56: Europe Market Value (US$ Million) by Application, 2022 to 2032

Figure 57: Europe Market Value (US$ Million) by Country, 2022 to 2032

Figure 58: Europe Market Value (US$ Million) Analysis by Country, 2017 to 2032

Figure 59: Europe Market Volume (MT) Analysis by Country, 2017 to 2032

Figure 60: Europe Market Value Share (%) and BPS Analysis by Country, 2022 to 2032

Figure 61: Europe Market Y-o-Y Growth (%) Projections by Country, 2022 to 2032

Figure 62: Europe Market Value (US$ Million) Analysis by Form, 2017 to 2032

Figure 63: Europe Market Volume (MT) Analysis by Form, 2017 to 2032

Figure 64: Europe Market Value Share (%) and BPS Analysis by Form, 2022 to 2032

Figure 65: Europe Market Y-o-Y Growth (%) Projections by Form, 2022 to 2032

Figure 66: Europe Market Value (US$ Million) Analysis by Application, 2017 to 2032

Figure 67: Europe Market Volume (MT) Analysis by Application, 2017 to 2032

Figure 68: Europe Market Value Share (%) and BPS Analysis by Application, 2022 to 2032

Figure 69: Europe Market Y-o-Y Growth (%) Projections by Application, 2022 to 2032

Figure 70: Europe Market Attractiveness by Form, 2022 to 2032

Figure 71: Europe Market Attractiveness by Application, 2022 to 2032

Figure 72: Europe Market Attractiveness by Country, 2022 to 2032

Figure 73: East Asia Market Value (US$ Million) by Form, 2022 to 2032

Figure 74: East Asia Market Value (US$ Million) by Application, 2022 to 2032

Figure 75: East Asia Market Value (US$ Million) by Country, 2022 to 2032

Figure 76: East Asia Market Value (US$ Million) Analysis by Country, 2017 to 2032

Figure 77: East Asia Market Volume (MT) Analysis by Country, 2017 to 2032

Figure 78: East Asia Market Value Share (%) and BPS Analysis by Country, 2022 to 2032

Figure 79: East Asia Market Y-o-Y Growth (%) Projections by Country, 2022 to 2032

Figure 80: East Asia Market Value (US$ Million) Analysis by Form, 2017 to 2032

Figure 81: East Asia Market Volume (MT) Analysis by Form, 2017 to 2032

Figure 82: East Asia Market Value Share (%) and BPS Analysis by Form, 2022 to 2032

Figure 83: East Asia Market Y-o-Y Growth (%) Projections by Form, 2022 to 2032

Figure 84: East Asia Market Value (US$ Million) Analysis by Application, 2017 to 2032

Figure 85: East Asia Market Volume (MT) Analysis by Application, 2017 to 2032

Figure 86: East Asia Market Value Share (%) and BPS Analysis by Application, 2022 to 2032

Figure 87: East Asia Market Y-o-Y Growth (%) Projections by Application, 2022 to 2032

Figure 88: East Asia Market Attractiveness by Form, 2022 to 2032

Figure 89: East Asia Market Attractiveness by Application, 2022 to 2032

Figure 90: East Asia Market Attractiveness by Country, 2022 to 2032

Figure 91: South Asia Market Value (US$ Million) by Form, 2022 to 2032

Figure 92: South Asia Market Value (US$ Million) by Application, 2022 to 2032

Figure 93: South Asia Market Value (US$ Million) by Country, 2022 to 2032

Figure 94: South Asia Market Value (US$ Million) Analysis by Country, 2017 to 2032

Figure 95: South Asia Market Volume (MT) Analysis by Country, 2017 to 2032

Figure 96: South Asia Market Value Share (%) and BPS Analysis by Country, 2022 to 2032

Figure 97: South Asia Market Y-o-Y Growth (%) Projections by Country, 2022 to 2032

Figure 98: South Asia Market Value (US$ Million) Analysis by Form, 2017 to 2032

Figure 99: South Asia Market Volume (MT) Analysis by Form, 2017 to 2032

Figure 100: South Asia Market Value Share (%) and BPS Analysis by Form, 2022 to 2032

Figure 101: South Asia Market Y-o-Y Growth (%) Projections by Form, 2022 to 2032

Figure 102: South Asia Market Value (US$ Million) Analysis by Application, 2017 to 2032

Figure 103: South Asia Market Volume (MT) Analysis by Application, 2017 to 2032

Figure 104: South Asia Market Value Share (%) and BPS Analysis by Application, 2022 to 2032

Figure 105: South Asia Market Y-o-Y Growth (%) Projections by Application, 2022 to 2032

Figure 106: South Asia Market Attractiveness by Form, 2022 to 2032

Figure 107: South Asia Market Attractiveness by Application, 2022 to 2032

Figure 108: South Asia Market Attractiveness by Country, 2022 to 2032

Figure 109: Oceania Market Value (US$ Million) by Form, 2022 to 2032

Figure 110: Oceania Market Value (US$ Million) by Application, 2022 to 2032

Figure 111: Oceania Market Value (US$ Million) by Country, 2022 to 2032

Figure 112: Oceania Market Value (US$ Million) Analysis by Country, 2017 to 2032

Figure 113: Oceania Market Volume (MT) Analysis by Country, 2017 to 2032

Figure 114: Oceania Market Value Share (%) and BPS Analysis by Country, 2022 to 2032

Figure 115: Oceania Market Y-o-Y Growth (%) Projections by Country, 2022 to 2032

Figure 116: Oceania Market Value (US$ Million) Analysis by Form, 2017 to 2032

Figure 117: Oceania Market Volume (MT) Analysis by Form, 2017 to 2032

Figure 118: Oceania Market Value Share (%) and BPS Analysis by Form, 2022 to 2032

Figure 119: Oceania Market Y-o-Y Growth (%) Projections by Form, 2022 to 2032

Figure 120: Oceania Market Value (US$ Million) Analysis by Application, 2017 to 2032

Figure 121: Oceania Market Volume (MT) Analysis by Application, 2017 to 2032

Figure 122: Oceania Market Value Share (%) and BPS Analysis by Application, 2022 to 2032

Figure 123: Oceania Market Y-o-Y Growth (%) Projections by Application, 2022 to 2032

Figure 124: Oceania Market Attractiveness by Form, 2022 to 2032

Figure 125: Oceania Market Attractiveness by Application, 2022 to 2032

Figure 126: Oceania Market Attractiveness by Country, 2022 to 2032

Figure 127: MEA Market Value (US$ Million) by Form, 2022 to 2032

Figure 128: MEA Market Value (US$ Million) by Application, 2022 to 2032

Figure 129: MEA Market Value (US$ Million) by Country, 2022 to 2032

Figure 130: MEA Market Value (US$ Million) Analysis by Country, 2017 to 2032

Figure 131: MEA Market Volume (MT) Analysis by Country, 2017 to 2032

Figure 132: MEA Market Value Share (%) and BPS Analysis by Country, 2022 to 2032

Figure 133: MEA Market Y-o-Y Growth (%) Projections by Country, 2022 to 2032

Figure 134: MEA Market Value (US$ Million) Analysis by Form, 2017 to 2032

Figure 135: MEA Market Volume (MT) Analysis by Form, 2017 to 2032

Figure 136: MEA Market Value Share (%) and BPS Analysis by Form, 2022 to 2032

Figure 137: MEA Market Y-o-Y Growth (%) Projections by Form, 2022 to 2032

Figure 138: MEA Market Value (US$ Million) Analysis by Application, 2017 to 2032

Figure 139: MEA Market Volume (MT) Analysis by Application, 2017 to 2032

Figure 140: MEA Market Value Share (%) and BPS Analysis by Application, 2022 to 2032

Figure 141: MEA Market Y-o-Y Growth (%) Projections by Application, 2022 to 2032

Figure 142: MEA Market Attractiveness by Form, 2022 to 2032

Figure 143: MEA Market Attractiveness by Application, 2022 to 2032

Figure 144: MEA Market Attractiveness by Country, 2022 to 2032

Frequently Asked Questions

How big is the global market for natamycin?

The global natamycin market size is expected to reach nearly USD 61.0 Million by 2022.

At what rate is the demand for natamycin expected to grow between 2022 and 2032?

Between 2022 and 2032, natamycin demand is poised to grow at around 6.8% CAGR.

What is the projected valuation for the global natamycin industry?

The worldwide natamycin industry is expected to reach a valuation of USD 102.7 Million by the end of 2032.

What is the growth projection for the North America market?

The North America natamycin industry is expected to register 6.4% CAGR between 2022 and 2032.

At what rate will natamycin demand grow in Europe?

Demand for natamycin is expected to grow at 5.7% CAGR during the forecast period.

What are the key trends shaping the natamycin industry?

Widening application of natamycin across diverse industries and increased investment by major players in this field are expected to help the market to thrive swiftly during the forecast period.

At what rate will demand for natamycin grow in China?

overall natamycin demand across China is projected to grow at 6.7% CAGR between 2022 and 2032.

Future Market Insights

Natamycin Market