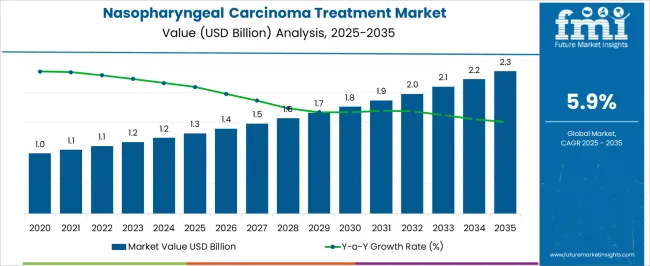
The Nasopharyngeal Carcinoma Treatment Market is estimated to be valued at USD 1.3 billion in 2025 and is projected to reach USD 2.3 billion by 2035, registering a compound annual growth rate (CAGR) of 5.9% over the forecast period.
| Metric | Value |
|---|---|
| Nasopharyngeal Carcinoma Treatment Market Estimated Value in (2025 E) | USD 1.3 billion |
| Nasopharyngeal Carcinoma Treatment Market Forecast Value in (2035 F) | USD 2.3 billion |
| Forecast CAGR (2025 to 2035) | 5.9% |
The nasopharyngeal carcinoma treatment market is expanding steadily due to the rising prevalence of head and neck cancers, advancements in chemotherapy and immunotherapy, and increasing awareness around early cancer diagnosis. Improved clinical guidelines and government-backed cancer control programs are also supporting wider access to effective treatment options.
Pharmaceutical innovations, particularly in targeted therapies and supportive care, are enhancing survival outcomes and reducing side effects associated with conventional treatments. Hospital networks and oncology centers are strengthening their infrastructure to provide specialized care, which is contributing to increased treatment adoption.
The overall outlook remains positive as healthcare systems focus on comprehensive cancer care pathways, precision medicine approaches, and the integration of advanced treatment regimens that improve patient quality of life and treatment efficacy.
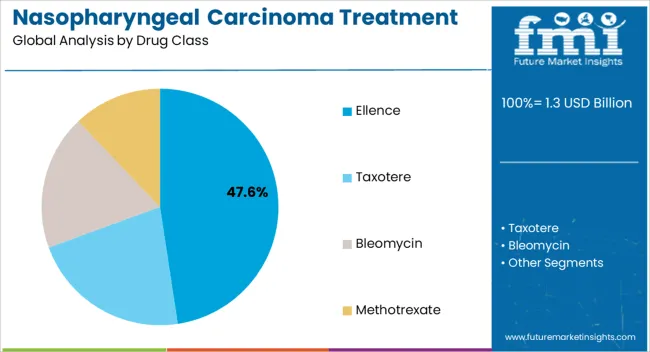
The Ellence drug class segment is projected to account for 47.60% of total market revenue by 2025, making it the most prominent category. This dominance is being driven by its established role in combination chemotherapy protocols and its effectiveness in treating locally advanced and metastatic stages of nasopharyngeal carcinoma.
High prescription rates, clinical efficacy, and widespread physician familiarity have reinforced its leading position. Continued clinical adoption and ongoing research aimed at improving dosage regimens and reducing toxicity are further contributing to the sustained growth of this segment.
As oncology practices emphasize both effectiveness and accessibility, Ellence remains a cornerstone drug class in nasopharyngeal carcinoma treatment.
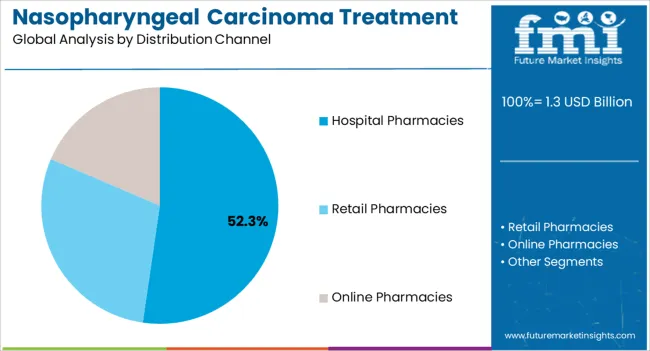
The hospital pharmacies segment is expected to represent 52.30% of total market revenue by 2025 within the distribution channel category, positioning it as the leading segment. This growth is being driven by the critical role hospital pharmacies play in dispensing oncology therapeutics that require close monitoring and specialized handling.
The availability of multidisciplinary oncology teams, patient counseling services, and immediate access to supportive care therapies has strengthened reliance on hospital pharmacies. Moreover, reimbursement structures and patient insurance coverage are often streamlined through hospital-based distribution systems.
As cancer care becomes increasingly centralized within hospital networks, hospital pharmacies continue to dominate the distribution channel segment by ensuring safe, reliable, and timely delivery of cancer therapeutics.
According to market research and competitive intelligence provider Future Market Insights- the market for Nasopharyngeal carcinoma treatment reflected a value of 3.1% during the historical period, 2020 to 2025.
The growth of the market can be attributed to various factors, such as the increasing prevalence of nasopharyngeal carcinoma, the rising demand for effective treatment options, and the growing investments in research and development activities for the development of new therapies.
Additionally, the increasing adoption of combination therapies and the development of targeted therapies and immunotherapies are also driving market growth.
Overall, the nasopharyngeal carcinoma treatment market is expected to continue to grow in the coming years, driven by the increasing prevalence of the disease and the ongoing efforts to develop more effective and personalized treatment options.
Thus, the market for Nasopharyngeal carcinoma treatment is expected to register a CAGR of 5.9% in the forecast period 2025 to 2035.
Increasing prevalence of nasopharyngeal carcinoma along with Technological advancements driving market growth of market
The incidence of nasopharyngeal carcinoma is increasing globally, particularly in certain regions such as Asia and Africa, where the disease is more prevalent. This is driving the demand for effective treatment options and contributing to market growth.
There is a growing focus on research and development activities for the development of new therapies and treatment options for nasopharyngeal carcinoma. This is leading to the development of innovative treatment approaches, such as targeted therapy and immunotherapy, which are expected to drive market growth.
Advancements in medical technology, such as the development of minimally invasive surgical procedures, are enabling more effective and less invasive treatment options for nasopharyngeal carcinoma. This is contributing to the growth of the market by increasing patient comfort and reducing treatment-related complications.
As healthcare expenditure continues to rise globally, more resources are being allocated towards the treatment of cancer, including nasopharyngeal carcinoma. This is driving the growth of the market by increasing access to treatment and improving patient outcomes.
Various awareness initiatives aimed at educating patients and healthcare professionals about the symptoms, risk factors, and treatment options for nasopharyngeal carcinoma are also contributing to market growth by promoting early detection and treatment.
Availability of treatments shaping landscape for nasopharyngeal carcinoma treatment market
Radiation therapy: This is the most common treatment for nasopharyngeal carcinoma. Radiation therapy uses high-energy radiation beams to kill cancer cells.
Chemotherapy: Chemotherapy involves the use of drugs to kill cancer cells. Chemotherapy may be used alone or in combination with radiation therapy.
Surgery: Surgery may be used to remove tumors in the nasopharynx, particularly in early-stage cancers. However, surgery is often not the primary treatment for nasopharyngeal carcinoma, as the nasopharynx is a difficult area to operate on.
Targeted therapy: Targeted therapy is a newer treatment option that involves the use of drugs that specifically target cancer cells, sparing healthy cells from damage.
Immunotherapy: Immunotherapy is a treatment that uses the body's immune system to fight cancer. This involves the use of drugs that stimulate the immune system to attack cancer cells.
Combination therapy: Combination therapy involves the use of multiple treatment options, such as radiation therapy and chemotherapy, to improve the effectiveness of treatment.
Limited awareness along with high cost of treatment hampering growth of market
Many patients and healthcare professionals have limited awareness of nasopharyngeal carcinoma, its symptoms, and treatment options. This can lead to delays in diagnosis and treatment, and may hinder the growth of the market.
The cost of treatment for nasopharyngeal carcinoma can be very high, particularly for newer treatments such as immunotherapy and targeted therapy. This may limit the access of patients to these treatments and may negatively impact market growth.
The side effects of treatment for nasopharyngeal carcinoma can be significant, particularly for radiation therapy and chemotherapy. This may impact patient compliance and limit the use of these treatments.
Despite recent advancements in treatment options, there is still a lack of effective therapies for patients with advanced-stage nasopharyngeal carcinoma. This may limit the treatment options available for these patients and may impact market growth.
The regulatory environment for cancer treatment is complex, with many therapies requiring approval from regulatory agencies before they can be marketed. This can lead to delays in the approval process and may impact market growth.
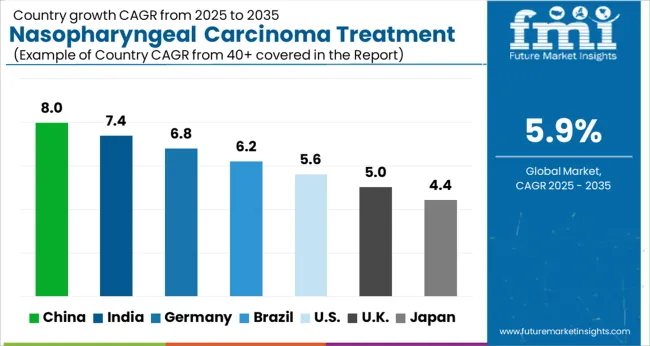
Presence of pharmaceutical companies propelling market growth of nasopharyngeal carcinoma Treatment
In recent years, there have been significant advancements in the treatment of NPC in Asia Pacific. For example, the use of intensity-modulated radiation therapy (IMRT) has improved treatment outcomes for patients with advanced NPC, while targeted therapies such as cetuximab and pembrolizumab have shown promise in clinical trials.
Several pharmaceutical companies, including AstraZeneca, Bristol-Myers Squibb, and Merck, are also actively developing new therapies and drugs for NPC. These companies are investing in research and development to improve the efficacy and safety of existing treatments and to identify new treatment options for patients with advanced NPC.
Overall, the Asia Pacific nasopharyngeal carcinoma treatment market is expected to experience growth in the coming years, driven by factors such as increasing prevalence of the disease, advancements in treatment options, and rising healthcare spending in the region.
However, the COVID-19 pandemic has also had an impact on the healthcare industry in the region, and may temporarily slow down market growth.
Thus, Asia Pacific is expected to possess 47% market share for nasopharyngeal carcinoma treatment market in 2025.
Launch of novel therapies bolstering growth of nasopharyngeal carcinoma treatment market
One of the major drivers of the market growth is the increasing incidence of nasopharyngeal carcinoma in the region. According to the World Health Organization (WHO), the incidence of nasopharyngeal carcinoma in the Middle East and Africa is higher compared to other parts of the world.
This is attributed to several factors such as genetic predisposition, environmental factors, and the high prevalence of Epstein-Barr virus infection in the region.
Another factor driving the market growth is the increasing awareness about nasopharyngeal carcinoma among the population. Governments and healthcare organizations in the region are taking initiatives to raise awareness about the disease, its symptoms, and the importance of early diagnosis and treatment.
This has led to an increase in the number of patients seeking medical attention, thereby boosting the demand for nasopharyngeal carcinoma treatment in the region.
Furthermore, the increasing investments by the government and private sector to improve healthcare infrastructure in the region is expected to drive the market growth. The government is investing in the development of advanced healthcare facilities and the procurement of advanced medical equipment, which is expected to improve the diagnosis and treatment of nasopharyngeal carcinoma.
In addition, the launch of novel therapies and drugs by pharmaceutical companies is expected to boost the market growth. Companies are investing in research and development to develop new and innovative treatments for nasopharyngeal carcinoma, which is expected to increase the demand for these drugs and therapies in the region.
Thus, Middle East and Africa is expected to possess 41% market share for nasopharyngeal carcinoma treatment market in 2025.
Access to latest treatments making hospital pharmacies a dependable choice for nasopharyngeal carcinoma treatment
Hospital pharmacies are equipped with a wide range of drugs and therapies used in the treatment of nasopharyngeal carcinoma. This allows healthcare professionals to prescribe the most effective and appropriate treatment for their patients, based on their medical history and the stage of the cancer.
Hospital pharmacies also stock drugs and therapies that are not easily available in retail pharmacies, which ensures that patients have access to the latest and most advanced treatments.
Hospital pharmacies are staffed by highly trained pharmacists who have extensive knowledge of the drugs and therapies used in the treatment of nasopharyngeal carcinoma. They are able to provide expert advice to healthcare professionals and patients, ensuring that the treatment is administered correctly and that any potential side effects are managed appropriately.
Hospital pharmacies are able to maintain a consistent supply of drugs and therapies used in the treatment of nasopharyngeal carcinoma.
This is critical for patients with cancer, who require uninterrupted access to their medications to manage their symptoms and maintain their quality of life. Thus, hospital pharmacies are expected to possess 40% market share for nasopharyngeal carcinoma treatment market in 2025.
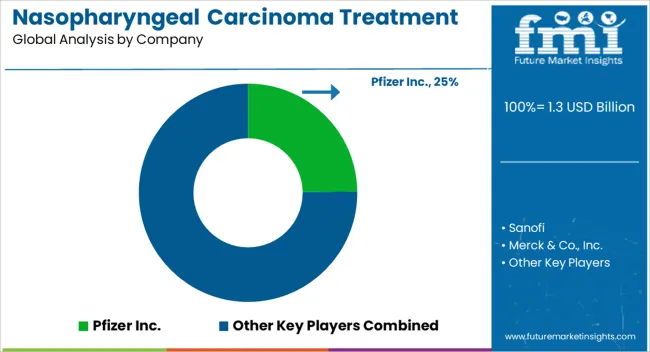
Key players in the nasopharyngeal carcinoma treatment are Pfizer Inc., Sanofi, Merck & Co., Inc., Eli Lilly and Company, Teva Pharmaceutical Industries Ltd., Fresenius SE & Co. KGaA, Cyclacel Pharmaceuticals Inc., F. Hoffmann-La Roche Ltd, CELGENE CORPORATION and BioDiem Ltd
| Report Attribute | Details |
|---|---|
| Market Value in 2025 | USD 1.3 billion |
| Market Value in 2035 | USD 2.3 billion |
| Growth Rate | CAGR of 5.9% from 2025 to 2035 |
| Base Year for Estimation | 2025 |
| Historical Data | 2020 to 2025 |
| Forecast Period | 2025 to 2035 |
| Quantitative Units | Revenue in USD Billion and CAGR from 2025 to 2035 |
| Report Coverage | Revenue Forecast, Volume Forecast, Company Ranking, Competitive Landscape, Growth Factors, Trends and Pricing Analysis |
| Segments Covered | Drug Class, Distribution Channel, Region |
| Regions Covered | North America; Latin America; Europe; South Asia; East Asia; Oceania; Middle East & Africa |
| Key Countries Profiled | USA, Canada, Brazil, Mexico, Rest of Latin America, Germany, United kingdom, France, Spain, Italy, Rest of Europe, India, Malaysia, Singapore, Thailand, Rest of South Asia, China, Japan, South Korea, Austria, New Zealand, GCC countries, South Africa, Israel, Rest of MEA |
| Key Companies Profiled | Pfizer Inc.; Sanofi; Merck & Co., Inc.; Eli Lilly and Company; Teva Pharmaceutical Industries Ltd.; Fresenius SE & Co. KGaA; Cyclacel Pharmaceuticals Inc.; F. Hoffmann-La Roche Ltd; CELGENE CORPORATION; BioDiem Ltd |
| Customization | Available Upon Request |
The global nasopharyngeal carcinoma treatment market is estimated to be valued at USD 1.3 billion in 2025.
The market size for the nasopharyngeal carcinoma treatment market is projected to reach USD 2.3 billion by 2035.
The nasopharyngeal carcinoma treatment market is expected to grow at a 5.9% CAGR between 2025 and 2035.
The key product types in nasopharyngeal carcinoma treatment market are ellence, taxotere, bleomycin and methotrexate.
In terms of distribution channel, hospital pharmacies segment to command 52.3% share in the nasopharyngeal carcinoma treatment market in 2025.


Our Research Products

The "Full Research Suite" delivers actionable market intel, deep dives on markets or technologies, so clients act faster, cut risk, and unlock growth.

The Leaderboard benchmarks and ranks top vendors, classifying them as Established Leaders, Leading Challengers, or Disruptors & Challengers.

Locates where complements amplify value and substitutes erode it, forecasting net impact by horizon

We deliver granular, decision-grade intel: market sizing, 5-year forecasts, pricing, adoption, usage, revenue, and operational KPIs—plus competitor tracking, regulation, and value chains—across 60 countries broadly.

Spot the shifts before they hit your P&L. We track inflection points, adoption curves, pricing moves, and ecosystem plays to show where demand is heading, why it is changing, and what to do next across high-growth markets and disruptive tech

Real-time reads of user behavior. We track shifting priorities, perceptions of today’s and next-gen services, and provider experience, then pace how fast tech moves from trial to adoption, blending buyer, consumer, and channel inputs with social signals (#WhySwitch, #UX).

Partner with our analyst team to build a custom report designed around your business priorities. From analysing market trends to assessing competitors or crafting bespoke datasets, we tailor insights to your needs.
Supplier Intelligence
Discovery & Profiling
Capacity & Footprint
Performance & Risk
Compliance & Governance
Commercial Readiness
Who Supplies Whom
Scorecards & Shortlists
Playbooks & Docs
Category Intelligence
Definition & Scope
Demand & Use Cases
Cost Drivers
Market Structure
Supply Chain Map
Trade & Policy
Operating Norms
Deliverables
Buyer Intelligence
Account Basics
Spend & Scope
Procurement Model
Vendor Requirements
Terms & Policies
Entry Strategy
Pain Points & Triggers
Outputs
Pricing Analysis
Benchmarks
Trends
Should-Cost
Indexation
Landed Cost
Commercial Terms
Deliverables
Brand Analysis
Positioning & Value Prop
Share & Presence
Customer Evidence
Go-to-Market
Digital & Reputation
Compliance & Trust
KPIs & Gaps
Outputs
Full Research Suite comprises of:
Market outlook & trends analysis
Interviews & case studies
Strategic recommendations
Vendor profiles & capabilities analysis
5-year forecasts
8 regions and 60+ country-level data splits
Market segment data splits
12 months of continuous data updates
DELIVERED AS:
PDF EXCEL ONLINE
Chloangiocarcinoma (CCA) Therapeutics Market - Growth & Drug Innovations 2025 to 2035
Merkel Cell Carcinoma Treatment Market
Neuroendocrine Carcinoma Treatment Market Size and Share Forecast Outlook 2025 to 2035
Hepatocellular Carcinoma HCC Treatment Market Size and Share Forecast Outlook 2025 to 2035
Advance Renal Cell Carcinoma Therapeutics Market Size and Share Forecast Outlook 2025 to 2035
Non-Small Cell Lung Carcinoma (NSCLC) Market Size and Share Forecast Outlook 2025 to 2035
Unresectable Hepatocellular Carcinoma Market - Growth & Outlook 2025 to 2035
Head and Neck Squamous Cell Carcinoma Market
Gastroesophageal Junction Adenocarcinoma Therapeutics Market by Drug, Diagnosis, Treatment, Distribution Channel, and Region through 2035
Treatment-Resistant Hypertension Management Market Size and Share Forecast Outlook 2025 to 2035
Treatment-Resistant Depression Treatment Market Size and Share Forecast Outlook 2025 to 2035
Treatment Pumps Market Insights Growth & Demand Forecast 2025 to 2035
Pretreatment Coatings Market Size and Share Forecast Outlook 2025 to 2035
Air Treatment Ozone Generator Market Size and Share Forecast Outlook 2025 to 2035
CNS Treatment and Therapy Market Insights - Trends & Growth Forecast 2025 to 2035
Seed Treatment Materials Market Size and Share Forecast Outlook 2025 to 2035
Acne Treatment Solutions Market Size and Share Forecast Outlook 2025 to 2035
Scar Treatment Market Overview - Growth & Demand Forecast 2025 to 2035
Soil Treatment Chemicals Market
Water Treatment System Market Size and Share Forecast Outlook 2025 to 2035

Thank you!
You will receive an email from our Business Development Manager. Please be sure to check your SPAM/JUNK folder too.
Chat With
MaRIA