Nanosensors Market Outlook (2023 to 2033)

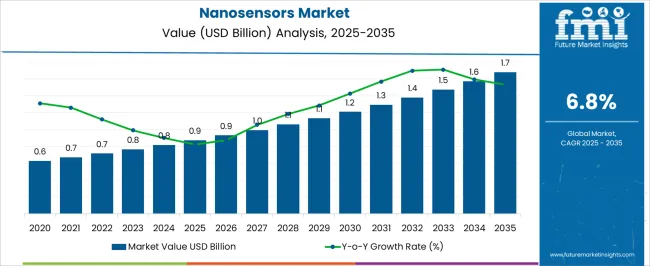
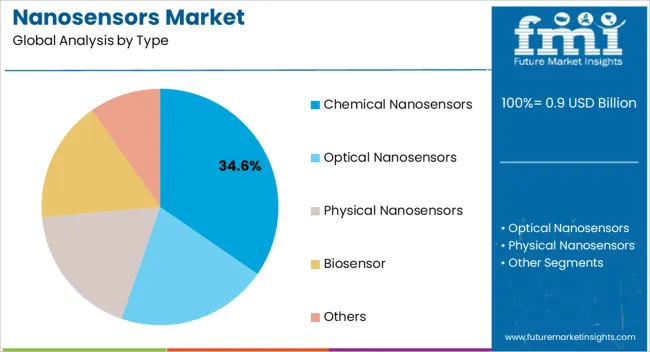
The global nanosensors market was valued at around US$ 759.4 million in 2023. With a CAGR of 7.1%, the market is likely to reach a valuation of US$ 1,512.5 million by 2033. Future Market Insights’ analysis reveals that most of the market revenue is grossed from Biosensors, with a predicted CAGR of 6.6% by 2033. Healthcare is the top application of these tests, with a CAGR of 6.3% in the forecast period.

Nanosensors, which can collect nanoscale data to be processed that would have been hard to reach with larger sensors, are being used extensively across various applications, ranging from healthcare to electronics to manufacturing and aerospace and defense. This widespread usage and increased funding for research and production by authorities is expected to be the key driver for demand in the forecast period.

Report Attributes Details
Global Estimated Market Value (2023E) US$ 759.4 million
Global Forecasted Market Value (2033) US$ 1,512.5 million

Don't pay for what you don't need

Customize your report by selecting specific countries or regions and save 30%!

Both Top-Down and Bottom-Up technologies show comparative advantages

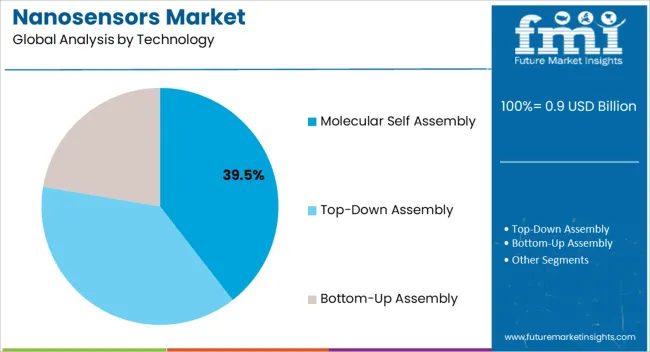
Top-down and Bottom-Up are the key types of nanosensor production technology. Top-down techniques which involve miniaturizing existing patterns are beneficial in several ways, especially in long-range order and macroscale dimensions. However, they become more difficult when applied in nanoscale dimensions. Also, the involvement of planar technology means difficulty in constructing 3-dimensional objects that are difficult to construct. The final product can also suffer from imperfections in surface structure.

The bottom-up approach involves the usage of physical and chemical forces to assemble structures from smaller basic units in an almost atom-for-atom form of building molecular structure. Bottom-up techniques are beneficial, especially in short-range order in nanoscale dimensions. This technique, however, is still in the emerging stages. The integration of both is an emerging field of interest as nanotechnology looks at new techniques.

Use of Nanosensors Allows for the Optimization of Aircraft Usage and Is an Emerging Trend in the Defense Sector

Nanosensors and nanotechnology, in general, showcase the massive potential for various applications in the defense sector. For example, Nanosensors can be used to detect harmful substances, such as toxic gases and explosives, based on a mass-based identification. Another application for nanotechnology lies in military apparel and gears. Nanophotonic technology harnesses nanosensors that sense optic changes in response to the target stimuli. This can be helpful when informing those in the line of defense when parts of their gear or themselves are at risk or exposed to danger. Bionanosensor technology can also be harnessed to collect and analyze health-related data, which can be vital in monitoring soldiers.

Use in aerospace is also driving demand for Nanosensors. Sensors are important in aircraft and are vital for measuring various indicators, such as fuel levels, external conditions, and performance updates. Nanosensors, when integrated into these sensor systems, can benefit the systems with improvements in sensitivity and reduction of weight.

Both these factors are vital to aircraft designers since smaller and lightweight sensors mean that more sensors can be used, improving safety and ensuring optimal usage of craft parts without compromising on the lightweight of their aircraft and the benefits lightweight has on fuel usage and efficiency. Also, these Nanosensors can be used in monitoring and camera systems owing to their broader electromagnetic spectrum bandwidth, so the sensing can occur even in bad climates and low visibility situations.
Sudip Saha
Sudip Saha

Principal Consultant

Talk to Analyst

Find your sweet spots for generating winning opportunities in this market.

Region-Wise Insights

Europe to be an emerging market with significant investments in research

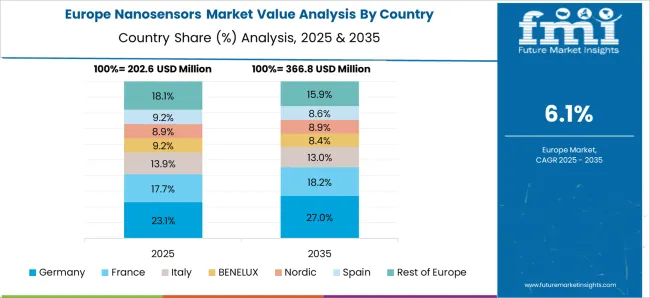
The nanosensors market in Europe is expected to witness a CAGR of 6%, with a forecasted valuation of US$ 326 million at a CAGR of 7.7%. The market in the United Kingdom witnessed a CAGR of 9.8% from 2018 to 2022, and it is forecasted to reach a valuation of US$ 54.2 million by 2033.

In 2023, Ireland’s Causeway Sensors, a diagnostics company that developed Nanosensors to detect early-stage cancer and other diseases, announced that they had raised US$ 18 million in investment, as well as a US$ 3.9 million grant it received as part of the Smart NNI group that raised approximately US$ 50 million from the government agency. Causeway is in the developmental stage for a Nanosensors platform, which is intended to have the ability to integrate directly with a bioreactor.

In 2020, Israel’s NonoVation announced that the European Union had awarded them a US$ 2.8 million Grant under the Horizon 2020 EIC Accelerator Program. The grant award is to be used for the further development of their nanosensor-based product, SenseGuard. The device has CE certification and is intended as a continuous monitoring system for respiratory concerns. In 2021, the European Innovation Council also provided a US$ 5.9 million investment in NonoVation.

Country-wise Insights

United States to Continue Being the Region with High Demand for Nanosensors

The United States to be the country with the largest contribution to demand in the forecast period

The United States is a key market for nanosensors, having witnessed a CAGR of 10.5%, with an absolute dollar opportunity of US$ 200.5 million and a forecasted market size of US$ 759.4 million at a CAGR of 7.7%. Significant research funding and grant allocation is the key driver for demand in the United States

In September 2020, Nanobiofab announced that they had been awarded a grant from the Defence Health Agency’s SBIR program. The grant amounts to US$ 250,000 and will be used to further research. The proposal submitted was for an Inkjet-assisted nano-printing sensing platform.

Under the National Institute of Food and Science, there are 4 key grant programs that fund nanotechnology-related projects, with research on their use in the detection of contaminants like pathogens and allergens being the key concern.

In August 2021, the NIH or National Institutes of Health’s NIGMS or National Institute of General Medical Sciences awarded funding of US$ 1.96 million to a City College of New York biomedical engineer as part of the MIRA ESI or Maximizing Investigator’s Research Award for Early Stage Investigators program. The funding has to be used to create implantable novel Nanosensors of the fluorescent type to study cytokine signaling in chronic diseases.

Get the data you need at a Fraction of the cost

Personalize your report by choosing insights you need
and save 40%!

Category-wise Insights

Healthcare to Come Out as Dominant Application Type in the Nanosensors Industry

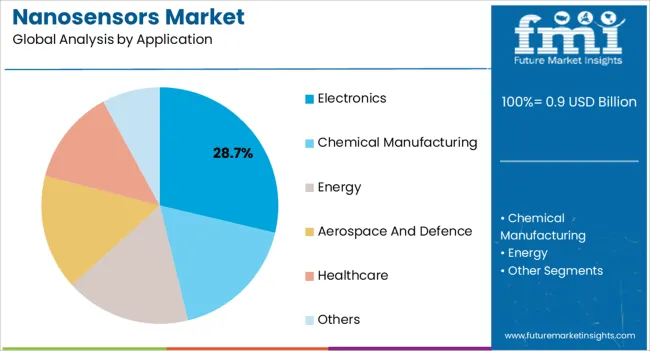
Healthcare is the top application of Nanosensors, having witnessed a CAGR of 9.4% and a forecasted CAGR of 6.3%. Rapid, sensitive, and accurate detections are vital to diagnostic medicine. The early detection of conditions is essential since many problems have symptoms that do not start showing observable signs until the condition has progressed to stages that can prove to be hard to treat. Currently, a key form of the use of nanosensors in the diagnostics field is for immediate diagnostics of conditions through techniques such as real-time monitoring.

One example of this is through the use of QDs or Quantum Dots, which can be used as photoluminescent nanosensors to detect chemicals and even tumors. Quantum dots have been the topic of a large volume of current research. Nanosensors can also be used in IV lines as silicon nanowires. They can detect biomarkers that would allow their monitoring over time to sense any abnormalities and thus help analyze organ health over time. They can also be used to monitor for contamination in organ implants, with embedded implants that can detect contaminations over time through continuous monitoring.

Competitive Landscape

At present, nanosensor providers are focused on research and development to understand possible applications for the use of their products across various industries and applications. The key companies operating include Affymetrix Inc., Agilent Technologies Inc., Altair Nanotechnologies Inc., Bayer AG, BioCrystal Ltd., Biosensors International Group Ltd., Debiotech S.A., Diabetech, Kleindiek Nanotechnik GmbH, Micro-Tech Scientific Incorporated, Nanomix Inc, Nano Detection Technologies Inc., Spectra Fluidics, Fischer Scientific

Some of the recent developments in Nanosensors are as follows :

  • In June 2022, LiveMetric announced the launch of their new product, LiveOne. The product is a wearable solution for monitoring blood pressure at 10-second intervals. It has gained 510(k) clearance from the FDA and is intended as an affordable and convenient alternative to the present form of BP cuff. Holter monitors through the use of Nanosensor technology.
  • In July 2021, NanoDx announced that they had licensed IBM’s nanosensor technology, which includes nano biosensors that show CMOS compatibility. The company intends to use this technology in its NnanoDx diagnostic platform to provide timely, sensitive, and accurate detections for various healthcare conditions such as influenza, sepsis, and COVID-19.
  • In October 2021, Mursla announced that its novel nanoelectronic-based exosome detection method had been granted the GB 2583550B patent. The technology introduces liquid biology samples to a nanochip with several Nanosensors via a complex detection technique. The data will be analyzed using a nanoparticle calibration curve-based algorithm.
  • In May 2020, Roswell Technologies and IMEC announced a collaboration to make available commercially available molecular electronics biosensor chips
  • In February 2020, Pinpoint Science and Analog Devices announced a collaboration. Under this collaboration, the two will aim to invest in research efforts to develop and manufacture novel nanosensor diagnostics to provide users with instant results with high levels of accuracy.
  • In February 2020, Europe’s University of Twente and the Wageningen University announced that through their collaborative efforts, they had created a nanosensor that would detect cancer biomarkers in significantly broad concentration ranges.
  • In June 2021, OncoNano Medicine, Inc. announced that it had raised US$ 50 million in Series B funding. The company plans to use the funding for further product development and research. OncoNano’s biosensor can detect cancer by reacting to low pH levels and illuminating cancerous cells.

Key Segments Covered in Nanosensors Industry Survey

By Type :

  • Chemical Nanosensors
  • Optical Nanosensors
  • Physical Nanosensors
  • Biosensor
  • Others

By Application :

  • Electronics
  • Chemical Manufacturing
  • Energy
  • Aerospace and Defence
  • Healthcare,
  • Others

By Technology :

  • Molecular Self Assembly
  • Top-Down Assembly
  • Bottom-Up Assembly

By Region :

  • North America
  • Latin America
  • Europe
  • Asia Pacific
  • Middle East & Africa

Frequently Asked Questions

Which Application Type Holds Lucrative Opportunities?

Healthcare holds high revenue potential.

Which Countries Dominate the Nanosensors Market?

The United States and the United Kingdom are estimated to dominate the global market.

What is the Growth Forecast for the Nanosensors Market?

The market is forecast to register a CAGR of 7.1% through 2033.

How is the Historical Performance of the Nanosensors Market?

During 2018 to 2022, the market registered a CAGR of 7.1%.

Which is the Top Trend in the Nanosensors Market?

The rising demand for nutritional value food is the current market trend.

Table of Content

1. Executive Summary

    1.1. Global Market Outlook

    1.2. Demand-side Trends

    1.3. Supply-side Trends

    1.4. Technology Roadmap Analysis

    1.5. Analysis and Recommendations

2. Market Overview

    2.1. Market Coverage / Taxonomy

    2.2. Market Definition / Scope / Limitations

3. Market Background

    3.1. Market Dynamics

        3.1.1. Drivers

        3.1.2. Restraints

        3.1.3. Opportunity

        3.1.4. Trends

    3.2. Scenario Forecast

        3.2.1. Demand in Optimistic Scenario

        3.2.2. Demand in Likely Scenario

        3.2.3. Demand in Conservative Scenario

    3.3. Opportunity Map Analysis

    3.4. Product Life Cycle Analysis

    3.5. Supply Chain Analysis

        3.5.1. Supply Side Participants and their Roles

            3.5.1.1. Producers

            3.5.1.2. Mid-Level Participants (Traders/ Agents/ Brokers)

            3.5.1.3. Wholesalers and Distributors

        3.5.2. Value Added and Value Created at Node in the Supply Chain

        3.5.3. List of Raw Material Suppliers

        3.5.4. List of Existing and Potential Buyer’s

    3.6. Investment Feasibility Matrix

    3.7. Value Chain Analysis

        3.7.1. Profit Margin Analysis

        3.7.2. Wholesalers and Distributors

        3.7.3. Retailers

    3.8. PESTLE and Porter’s Analysis

    3.9. Regulatory Landscape

        3.9.1. By Key Regions

        3.9.2. By Key Countries

    3.10. Regional Parent Market Outlook

    3.11. Production and Consumption Statistics

    3.12. Import and Export Statistics

4. Global Market Analysis 2018 to 2022 and Forecast, 2023 to 2033

    4.1. Historical Market Size Value (US$ Million) & Volume (Units) Analysis, 2018 to 2022

    4.2. Current and Future Market Size Value (US$ Million) & Volume (Units) Projections, 2023 to 2033

        4.2.1. Y-o-Y Growth Trend Analysis

        4.2.2. Absolute $ Opportunity Analysis

5. Global Market Analysis 2018 to 2022 and Forecast 2023 to 2033, By Type

    5.1. Introduction / Key Findings

    5.2. Historical Market Size Value (US$ Million) & Volume (Units) Analysis By Type, 2018 to 2022

    5.3. Current and Future Market Size Value (US$ Million) & Volume (Units) Analysis and Forecast By Type, 2023 to 2033

        5.3.1. Chemical Nanosensors

        5.3.2. Optical Nanosensors

        5.3.3. Physical Nanosensors

        5.3.4. Biosensor

        5.3.5. Others

    5.4. Y-o-Y Growth Trend Analysis By Type, 2018 to 2022

    5.5. Absolute $ Opportunity Analysis By Type, 2023 to 2033

6. Global Market Analysis 2018 to 2022 and Forecast 2023 to 2033, By Application

    6.1. Introduction / Key Findings

    6.2. Historical Market Size Value (US$ Million) & Volume (Units) Analysis By Application, 2018 to 2022

    6.3. Current and Future Market Size Value (US$ Million) & Volume (Units) Analysis and Forecast By Application, 2023 to 2033

        6.3.1. Electronics

        6.3.2. Chemical Manufacturing

        6.3.3. Energy

        6.3.4. Aerospace and Defence

        6.3.5. Healthcare

        6.3.6. Others

    6.4. Y-o-Y Growth Trend Analysis By Application, 2018 to 2022

    6.5. Absolute $ Opportunity Analysis By Application, 2023 to 2033

7. Global Market Analysis 2018 to 2022 and Forecast 2023 to 2033, By Technology

    7.1. Introduction / Key Findings

    7.2. Historical Market Size Value (US$ Million) & Volume (Units) Analysis By Technology, 2018 to 2022

    7.3. Current and Future Market Size Value (US$ Million) & Volume (Units) Analysis and Forecast By Technology, 2023 to 2033

        7.3.1. Molecular Self Assembly

        7.3.2. Top-Down Assembly

        7.3.3. Bottom-Up Assembly

    7.4. Y-o-Y Growth Trend Analysis By Technology, 2018 to 2022

    7.5. Absolute $ Opportunity Analysis By Technology, 2023 to 2033

8. Global Market Analysis 2018 to 2022 and Forecast 2023 to 2033, By Region

    8.1. Introduction

    8.2. Historical Market Size Value (US$ Million) & Volume (Units) Analysis By Region, 2018 to 2022

    8.3. Current Market Size Value (US$ Million) & Volume (Units) Analysis and Forecast By Region, 2023 to 2033

        8.3.1. North America

        8.3.2. Latin America

        8.3.3. Western Europe

        8.3.4. Eastern Europe

        8.3.5. South Asia and Pacific

        8.3.6. East Asia

        8.3.7. Middle East and Africa

    8.4. Market Attractiveness Analysis By Region

9. North America Market Analysis 2018 to 2022 and Forecast 2023 to 2033, By Country

    9.1. Historical Market Size Value (US$ Million) & Volume (Units) Trend Analysis By Market Taxonomy, 2018 to 2022

    9.2. Market Size Value (US$ Million) & Volume (Units) Forecast By Market Taxonomy, 2023 to 2033

        9.2.1. By Country

            9.2.1.1. USA

            9.2.1.2. Canada

        9.2.2. By Type

        9.2.3. By Application

        9.2.4. By Technology

    9.3. Market Attractiveness Analysis

        9.3.1. By Country

        9.3.2. By Type

        9.3.3. By Application

        9.3.4. By Technology

    9.4. Key Takeaways

10. Latin America Market Analysis 2018 to 2022 and Forecast 2023 to 2033, By Country

    10.1. Historical Market Size Value (US$ Million) & Volume (Units) Trend Analysis By Market Taxonomy, 2018 to 2022

    10.2. Market Size Value (US$ Million) & Volume (Units) Forecast By Market Taxonomy, 2023 to 2033

        10.2.1. By Country

            10.2.1.1. Brazil

            10.2.1.2. Mexico

            10.2.1.3. Rest of Latin America

        10.2.2. By Type

        10.2.3. By Application

        10.2.4. By Technology

    10.3. Market Attractiveness Analysis

        10.3.1. By Country

        10.3.2. By Type

        10.3.3. By Application

        10.3.4. By Technology

    10.4. Key Takeaways

11. Western Europe Market Analysis 2018 to 2022 and Forecast 2023 to 2033, By Country

    11.1. Historical Market Size Value (US$ Million) & Volume (Units) Trend Analysis By Market Taxonomy, 2018 to 2022

    11.2. Market Size Value (US$ Million) & Volume (Units) Forecast By Market Taxonomy, 2023 to 2033

        11.2.1. By Country

            11.2.1.1. Germany

            11.2.1.2. UK

            11.2.1.3. France

            11.2.1.4. Spain

            11.2.1.5. Italy

            11.2.1.6. Rest of Western Europe

        11.2.2. By Type

        11.2.3. By Application

        11.2.4. By Technology

    11.3. Market Attractiveness Analysis

        11.3.1. By Country

        11.3.2. By Type

        11.3.3. By Application

        11.3.4. By Technology

    11.4. Key Takeaways

12. Eastern Europe Market Analysis 2018 to 2022 and Forecast 2023 to 2033, By Country

    12.1. Historical Market Size Value (US$ Million) & Volume (Units) Trend Analysis By Market Taxonomy, 2018 to 2022

    12.2. Market Size Value (US$ Million) & Volume (Units) Forecast By Market Taxonomy, 2023 to 2033

        12.2.1. By Country

            12.2.1.1. Poland

            12.2.1.2. Russia

            12.2.1.3. Czech Republic

            12.2.1.4. Romania

            12.2.1.5. Rest of Eastern Europe

        12.2.2. By Type

        12.2.3. By Application

        12.2.4. By Technology

    12.3. Market Attractiveness Analysis

        12.3.1. By Country

        12.3.2. By Type

        12.3.3. By Application

        12.3.4. By Technology

    12.4. Key Takeaways

13. South Asia and Pacific Market Analysis 2018 to 2022 and Forecast 2023 to 2033, By Country

    13.1. Historical Market Size Value (US$ Million) & Volume (Units) Trend Analysis By Market Taxonomy, 2018 to 2022

    13.2. Market Size Value (US$ Million) & Volume (Units) Forecast By Market Taxonomy, 2023 to 2033

        13.2.1. By Country

            13.2.1.1. India

            13.2.1.2. Bangladesh

            13.2.1.3. Australia

            13.2.1.4. New Zealand

            13.2.1.5. Rest of South Asia and Pacific

        13.2.2. By Type

        13.2.3. By Application

        13.2.4. By Technology

    13.3. Market Attractiveness Analysis

        13.3.1. By Country

        13.3.2. By Type

        13.3.3. By Application

        13.3.4. By Technology

    13.4. Key Takeaways

14. East Asia Market Analysis 2018 to 2022 and Forecast 2023 to 2033, By Country

    14.1. Historical Market Size Value (US$ Million) & Volume (Units) Trend Analysis By Market Taxonomy, 2018 to 2022

    14.2. Market Size Value (US$ Million) & Volume (Units) Forecast By Market Taxonomy, 2023 to 2033

        14.2.1. By Country

            14.2.1.1. China

            14.2.1.2. Japan

            14.2.1.3. South Korea

        14.2.2. By Type

        14.2.3. By Application

        14.2.4. By Technology

    14.3. Market Attractiveness Analysis

        14.3.1. By Country

        14.3.2. By Type

        14.3.3. By Application

        14.3.4. By Technology

    14.4. Key Takeaways

15. Middle East and Africa Market Analysis 2018 to 2022 and Forecast 2023 to 2033, By Country

    15.1. Historical Market Size Value (US$ Million) & Volume (Units) Trend Analysis By Market Taxonomy, 2018 to 2022

    15.2. Market Size Value (US$ Million) & Volume (Units) Forecast By Market Taxonomy, 2023 to 2033

        15.2.1. By Country

            15.2.1.1. GCC Countries

            15.2.1.2. South Africa

            15.2.1.3. Israel

            15.2.1.4. Rest of MEA

        15.2.2. By Type

        15.2.3. By Application

        15.2.4. By Technology

    15.3. Market Attractiveness Analysis

        15.3.1. By Country

        15.3.2. By Type

        15.3.3. By Application

        15.3.4. By Technology

    15.4. Key Takeaways

16. Key Countries Market Analysis

    16.1. USA

        16.1.1. Pricing Analysis

        16.1.2. Market Share Analysis, 2022

            16.1.2.1. By Type

            16.1.2.2. By Application

            16.1.2.3. By Technology

    16.2. Canada

        16.2.1. Pricing Analysis

        16.2.2. Market Share Analysis, 2022

            16.2.2.1. By Type

            16.2.2.2. By Application

            16.2.2.3. By Technology

    16.3. Brazil

        16.3.1. Pricing Analysis

        16.3.2. Market Share Analysis, 2022

            16.3.2.1. By Type

            16.3.2.2. By Application

            16.3.2.3. By Technology

    16.4. Mexico

        16.4.1. Pricing Analysis

        16.4.2. Market Share Analysis, 2022

            16.4.2.1. By Type

            16.4.2.2. By Application

            16.4.2.3. By Technology

    16.5. Germany

        16.5.1. Pricing Analysis

        16.5.2. Market Share Analysis, 2022

            16.5.2.1. By Type

            16.5.2.2. By Application

            16.5.2.3. By Technology

    16.6. UK

        16.6.1. Pricing Analysis

        16.6.2. Market Share Analysis, 2022

            16.6.2.1. By Type

            16.6.2.2. By Application

            16.6.2.3. By Technology

    16.7. France

        16.7.1. Pricing Analysis

        16.7.2. Market Share Analysis, 2022

            16.7.2.1. By Type

            16.7.2.2. By Application

            16.7.2.3. By Technology

    16.8. Spain

        16.8.1. Pricing Analysis

        16.8.2. Market Share Analysis, 2022

            16.8.2.1. By Type

            16.8.2.2. By Application

            16.8.2.3. By Technology

    16.9. Italy

        16.9.1. Pricing Analysis

        16.9.2. Market Share Analysis, 2022

            16.9.2.1. By Type

            16.9.2.2. By Application

            16.9.2.3. By Technology

    16.10. Poland

        16.10.1. Pricing Analysis

        16.10.2. Market Share Analysis, 2022

            16.10.2.1. By Type

            16.10.2.2. By Application

            16.10.2.3. By Technology

    16.11. Russia

        16.11.1. Pricing Analysis

        16.11.2. Market Share Analysis, 2022

            16.11.2.1. By Type

            16.11.2.2. By Application

            16.11.2.3. By Technology

    16.12. Czech Republic

        16.12.1. Pricing Analysis

        16.12.2. Market Share Analysis, 2022

            16.12.2.1. By Type

            16.12.2.2. By Application

            16.12.2.3. By Technology

    16.13. Romania

        16.13.1. Pricing Analysis

        16.13.2. Market Share Analysis, 2022

            16.13.2.1. By Type

            16.13.2.2. By Application

            16.13.2.3. By Technology

    16.14. India

        16.14.1. Pricing Analysis

        16.14.2. Market Share Analysis, 2022

            16.14.2.1. By Type

            16.14.2.2. By Application

            16.14.2.3. By Technology

    16.15. Bangladesh

        16.15.1. Pricing Analysis

        16.15.2. Market Share Analysis, 2022

            16.15.2.1. By Type

            16.15.2.2. By Application

            16.15.2.3. By Technology

    16.16. Australia

        16.16.1. Pricing Analysis

        16.16.2. Market Share Analysis, 2022

            16.16.2.1. By Type

            16.16.2.2. By Application

            16.16.2.3. By Technology

    16.17. New Zealand

        16.17.1. Pricing Analysis

        16.17.2. Market Share Analysis, 2022

            16.17.2.1. By Type

            16.17.2.2. By Application

            16.17.2.3. By Technology

    16.18. China

        16.18.1. Pricing Analysis

        16.18.2. Market Share Analysis, 2022

            16.18.2.1. By Type

            16.18.2.2. By Application

            16.18.2.3. By Technology

    16.19. Japan

        16.19.1. Pricing Analysis

        16.19.2. Market Share Analysis, 2022

            16.19.2.1. By Type

            16.19.2.2. By Application

            16.19.2.3. By Technology

    16.20. South Korea

        16.20.1. Pricing Analysis

        16.20.2. Market Share Analysis, 2022

            16.20.2.1. By Type

            16.20.2.2. By Application

            16.20.2.3. By Technology

    16.21. GCC Countries

        16.21.1. Pricing Analysis

        16.21.2. Market Share Analysis, 2022

            16.21.2.1. By Type

            16.21.2.2. By Application

            16.21.2.3. By Technology

    16.22. South Africa

        16.22.1. Pricing Analysis

        16.22.2. Market Share Analysis, 2022

            16.22.2.1. By Type

            16.22.2.2. By Application

            16.22.2.3. By Technology

    16.23. Israel

        16.23.1. Pricing Analysis

        16.23.2. Market Share Analysis, 2022

            16.23.2.1. By Type

            16.23.2.2. By Application

            16.23.2.3. By Technology

17. Market Structure Analysis

    17.1. Competition Dashboard

    17.2. Competition Benchmarking

    17.3. Market Share Analysis of Top Players

        17.3.1. By Regional

        17.3.2. By Type

        17.3.3. By Application

        17.3.4. By Technology

18. Competition Analysis

    18.1. Competition Deep Dive

        18.1.1. Affymetrix Inc.

            18.1.1.1. Overview

            18.1.1.2. Product Portfolio

            18.1.1.3. Profitability by Market Segments

            18.1.1.4. Sales Footprint

            18.1.1.5. Strategy Overview

                18.1.1.5.1. Marketing Strategy

                18.1.1.5.2. Product Strategy

                18.1.1.5.3. Channel Strategy

        18.1.2. Agilent Technologies Inc.

            18.1.2.1. Overview

            18.1.2.2. Product Portfolio

            18.1.2.3. Profitability by Market Segments

            18.1.2.4. Sales Footprint

            18.1.2.5. Strategy Overview

                18.1.2.5.1. Marketing Strategy

                18.1.2.5.2. Product Strategy

                18.1.2.5.3. Channel Strategy

        18.1.3. Attocube systems AG

            18.1.3.1. Overview

            18.1.3.2. Product Portfolio

            18.1.3.3. Profitability by Market Segments

            18.1.3.4. Sales Footprint

            18.1.3.5. Strategy Overview

                18.1.3.5.1. Marketing Strategy

                18.1.3.5.2. Product Strategy

                18.1.3.5.3. Channel Strategy

        18.1.4. Altair Nanotechnologies Inc.

            18.1.4.1. Overview

            18.1.4.2. Product Portfolio

            18.1.4.3. Profitability by Market Segments

            18.1.4.4. Sales Footprint

            18.1.4.5. Strategy Overview

                18.1.4.5.1. Marketing Strategy

                18.1.4.5.2. Product Strategy

                18.1.4.5.3. Channel Strategy

        18.1.5. Bayer AG

            18.1.5.1. Overview

            18.1.5.2. Product Portfolio

            18.1.5.3. Profitability by Market Segments

            18.1.5.4. Sales Footprint

            18.1.5.5. Strategy Overview

                18.1.5.5.1. Marketing Strategy

                18.1.5.5.2. Product Strategy

                18.1.5.5.3. Channel Strategy

        18.1.6. BioCrystal Ltd.

            18.1.6.1. Overview

            18.1.6.2. Product Portfolio

            18.1.6.3. Profitability by Market Segments

            18.1.6.4. Sales Footprint

            18.1.6.5. Strategy Overview

                18.1.6.5.1. Marketing Strategy

                18.1.6.5.2. Product Strategy

                18.1.6.5.3. Channel Strategy

        18.1.7. Biosensors International Group Ltd.

            18.1.7.1. Overview

            18.1.7.2. Product Portfolio

            18.1.7.3. Profitability by Market Segments

            18.1.7.4. Sales Footprint

            18.1.7.5. Strategy Overview

                18.1.7.5.1. Marketing Strategy

                18.1.7.5.2. Product Strategy

                18.1.7.5.3. Channel Strategy

        18.1.8. Debiotech S.A.

            18.1.8.1. Overview

            18.1.8.2. Product Portfolio

            18.1.8.3. Profitability by Market Segments

            18.1.8.4. Sales Footprint

            18.1.8.5. Strategy Overview

                18.1.8.5.1. Marketing Strategy

                18.1.8.5.2. Product Strategy

                18.1.8.5.3. Channel Strategy

        18.1.9. Diabetech

            18.1.9.1. Overview

            18.1.9.2. Product Portfolio

            18.1.9.3. Profitability by Market Segments

            18.1.9.4. Sales Footprint

            18.1.9.5. Strategy Overview

                18.1.9.5.1. Marketing Strategy

                18.1.9.5.2. Product Strategy

                18.1.9.5.3. Channel Strategy

        18.1.10. Kleindiek Nanotechnik GmbH

            18.1.10.1. Overview

            18.1.10.2. Product Portfolio

            18.1.10.3. Profitability by Market Segments

            18.1.10.4. Sales Footprint

            18.1.10.5. Strategy Overview

                18.1.10.5.1. Marketing Strategy

                18.1.10.5.2. Product Strategy

                18.1.10.5.3. Channel Strategy

        18.1.11. Micro-Tech Scientific Incorporated

            18.1.11.1. Overview

            18.1.11.2. Product Portfolio

            18.1.11.3. Profitability by Market Segments

            18.1.11.4. Sales Footprint

            18.1.11.5. Strategy Overview

                18.1.11.5.1. Marketing Strategy

                18.1.11.5.2. Product Strategy

                18.1.11.5.3. Channel Strategy

        18.1.12. Nanomix Inc.

            18.1.12.1. Overview

            18.1.12.2. Product Portfolio

            18.1.12.3. Profitability by Market Segments

            18.1.12.4. Sales Footprint

            18.1.12.5. Strategy Overview

                18.1.12.5.1. Marketing Strategy

                18.1.12.5.2. Product Strategy

                18.1.12.5.3. Channel Strategy

        18.1.13. Nano Detection Technologies Inc.

            18.1.13.1. Overview

            18.1.13.2. Product Portfolio

            18.1.13.3. Profitability by Market Segments

            18.1.13.4. Sales Footprint

            18.1.13.5. Strategy Overview

                18.1.13.5.1. Marketing Strategy

                18.1.13.5.2. Product Strategy

                18.1.13.5.3. Channel Strategy

        18.1.14. Spectra Fluidics

            18.1.14.1. Overview

            18.1.14.2. Product Portfolio

            18.1.14.3. Profitability by Market Segments

            18.1.14.4. Sales Footprint

            18.1.14.5. Strategy Overview

                18.1.14.5.1. Marketing Strategy

                18.1.14.5.2. Product Strategy

                18.1.14.5.3. Channel Strategy

        18.1.15. Thermo Fischer Scientific

            18.1.15.1. Overview

            18.1.15.2. Product Portfolio

            18.1.15.3. Profitability by Market Segments

            18.1.15.4. Sales Footprint

            18.1.15.5. Strategy Overview

                18.1.15.5.1. Marketing Strategy

                18.1.15.5.2. Product Strategy

                18.1.15.5.3. Channel Strategy

19. Assumptions & Acronyms Used

20. Research Methodology

Recommendations

Technology

Sensors Market

June 2023

REP-GB-272

315 pages

Explore Technology Insights

View Reports
Future Market Insights

Nanosensors Market

Schedule a Call