Top Multiplex PCR Assays Market Size and Share Forecast Outlook 2023to 2033

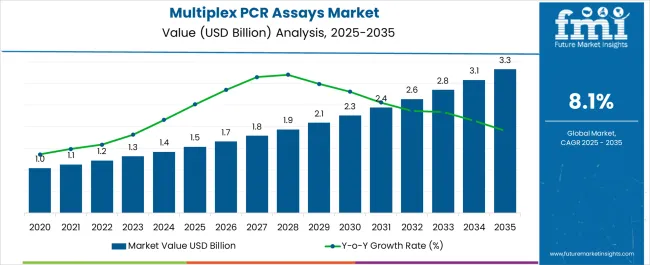
The multiplex PCR assays market size is projected to be worth USD 1.3 billion in 2023. The market is likely to surpass USD 3.0 billion by 2033 at a CAGR of 8.5% during the forecast period.

The global burden of infectious diseases, such as respiratory infections, sexually transmitted infections, and gastrointestinal infections, continues to rise. Multiplex PCR assays play a crucial role in the diagnosis and surveillance of these diseases by enabling the simultaneous detection of multiple pathogens. The increasing prevalence of infectious diseases is expected to drive the demand for multiplex PCR assays.

Other Drivers Propelling the Demand for Multiplex PCR Assays Market include:

  • Multiplex PCR assays are widely used in research laboratories for various applications, including gene expression analysis, genotyping, and mutation detection. The increasing adoption of molecular techniques in research settings is driving the demand for multiplex PCR assays.
  • Both academic and industrial research institutions are actively engaged in the development of multiplex PCR assays for various applications. The focus is on expanding the range of detectable targets, improving assay performance, and exploring new applications in areas such as oncology, genetic testing, and personalized medicine. The ongoing research and development efforts are expected to fuel market growth.
  • Multiplex PCR assays have gained significant importance in the field of molecular diagnostics. The increasing demand for efficient and reliable diagnostic techniques is driving the growth of the market.

Challenges for Companies /Manufacturers in the Multiplex PCR Assays Market:

  • Regulatory approval processes for diagnostic assays can be time-consuming and complex. Multiplex PCR assays must meet stringent regulatory requirements to ensure accuracy, reliability, and safety. Compliance with regulations such as the USA FDA approval or the European CE mark certification can pose challenges and delay market entry for new assays.
  • Multiplex PCR assays face competition from alternative diagnostic technologies, such as next-generation sequencing (NGS), microarrays, and digital PCR. The growing adoption of these alternative technologies poses a challenge for the market share of multiplex PCR assays.
  • The awareness and adoption of multiplex PCR assays can vary across different regions and healthcare settings. In some areas, particularly in developing regions, there may be limited awareness about the benefits and applications of multiplex PCR assays. This can significantly obstruct the growth of the market.

Opportunities in the Multiplex PCR Assays Industry:

  • The field of multiplex PCR assays is witnessing continuous technological advancements. These advancements include the development of new multiplex PCR platforms, improved primer design strategies, and enhanced detection methods. These innovations are leading to improved sensitivity, specificity, and multiplexing capacity of the assays, thereby expanding their applications and driving market growth.
  • The need for efficient and reliable diagnostic tools is growing rapidly. Multiplex PCR assays offer the ability to simultaneously detect multiple targets in a single reaction, providing faster results and reducing the need for multiple individual tests.
  • Automation plays a crucial role in streamlining laboratory workflows and increasing efficiency. Integrating multiplex PCR assays with automated platforms and high-throughput systems allows for higher sample throughput and reduces manual handling, leading to increased productivity and cost savings.

Latest Trends in the Multiplex PCR Assays Market:

  • The demand for customized multiplex PCR assay panels is increasing. Instead of relying solely on commercially available multiplex panels, researchers and clinicians are opting for customizable assays tailored to their specific needs. This trend enables the detection of a combination of targets relevant to a particular disease.
  • While infectious disease testing has been a primary application of multiplex PCR assays, there is a growing trend of exploring their use in non-infectious disease applications. Multiplex PCR assays are being employed in areas such as oncology, genetic testing, pharmacogenomics, and prenatal screening.
  • The multiplex PCR assays market is experiencing significant growth in emerging markets, including Asia-Pacific, Latin America, and the Middle East. Factors such as improving healthcare infrastructure, rising awareness about advanced diagnostic technologies, and increasing healthcare expenditure are driving the adoption of multiplex PCR assays in these regions.
Attributes Details
Multiplex PCR Assays Market Size (2023) USD 1.3 billion
Multiplex PCR Assays Market Projected Size (2033) USD 3.0 billion
Value CAGR (2023 to 2033) 8.5%

2017 to 2022 Global Multiplex PCR Assays Sales Outlook Compared to Demand Forecast from 2023 to 2033

From 2017 to 2022, the global multiplex PCR assays market experienced a CAGR of 7.8%, reaching a market size of USD 1.3 billion in 2023.

Multiplex PCR assays play a vital role in diagnostic applications, particularly in infectious disease testing. The need for rapid and accurate detection of multiple pathogens in a single test is driving the demand for multiplex PCR assays.

With the increasing prevalence of infectious diseases, such as respiratory infections, sexually transmitted infections, and hospital-acquired infections, the demand for multiplex PCR assays is expected to grow.

Future Forecast for Multiplex PCR Assays Industry:

Looking ahead, the global multiplex PCR assays market is expected to rise at a CAGR of 8.5% from 2023 to 2033. During the forecast period, the market size is expected to reach USD 3.0 billion by 2033.

Point-of-care (POC) and decentralized testing are gaining prominence in healthcare. Multiplex PCR assays offer the potential for on-site, rapid, and accurate diagnosis in settings such as clinics, emergency departments, and resource-limited areas. The demand for multiplex PCR assays in POC and decentralized testing is expected to increase as the focus on accessible and timely diagnostics grows.
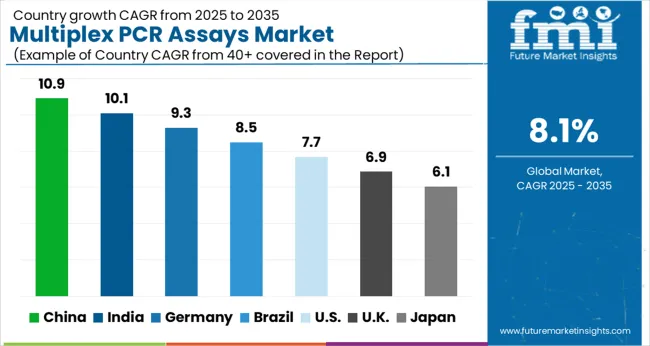
Analysis of Key Countries in the Multiplex PCR Assays Market

What is Spurring the Growth of the USA Market?

Country The United States
Market Size (USD Million) by End of Forecast Period (2033) USD 740.9 million
CAGR % 2023 to End of Forecast (2033) 7.1%

The multiplex PCR assays market in the United States is expected to reach a market size of USD 740.9 billion by 2033, expanding at a CAGR of 7.1%.

The USA has a substantial burden of infectious diseases, including respiratory infections, sexually transmitted infections, and healthcare-associated infections. The increasing demand for accurate and comprehensive infectious disease testing is driving the growth of the multiplex PCR assays market in the USA

  • The USA is at the forefront of genomics research and molecular diagnostics. The continuous advancements in sequencing technologies, genetic understanding, and biomarker discovery are driving the demand for multiplex PCR assays

Multiplex PCR Assays Market is Expected to Grow at a Significant Rate Owing to Strong Research and Development Landscape.

Country The United Kingdom
Market Size (USD Million) by End of Forecast Period (2033) USD 146.9 million
CAGR % 2023 to End of Forecast (2033) 8.7%

The multiplex PCR assays market in the United Kingdom is expected to reach a market value of USD 146.9 billion, expanding at a CAGR of 8.7% during the forecast period. The UK has a strong research and development landscape, with renowned academic institutions, biotechnology companies, and pharmaceutical companies actively engaged in life sciences research.

Multiplex PCR assays are widely utilized in research laboratories for their ability to detect multiple targets simultaneously. The expanding research and development activities across diverse fields, such as genomics, oncology, and infectious diseases, are driving the demand for multiplex PCR assays in the UK.

Why China is a Lucrative Market in East Asia Multiplex PCR Assays Market?

Country China
Market Size (USD billion) by End of Forecast Period (2033) USD 188.7 billion
CAGR % 2023 to End of Forecast (2033) 6.6%

The multiplex PCR assays market in China is anticipated to reach a market size of USD 188.7 billion by the end of 2033, growing at a CAGR of 6.6% throughout the forecast period. China has faced several epidemics and disease outbreaks in the past, which has heightened the focus on epidemic and disease control measures.

Multiplex PCR assays play a critical role in rapid and accurate diagnosis, surveillance, and control of infectious diseases. The emphasis on epidemic and disease control drives the demand for multiplex PCR assays as essential tools in public health initiatives.
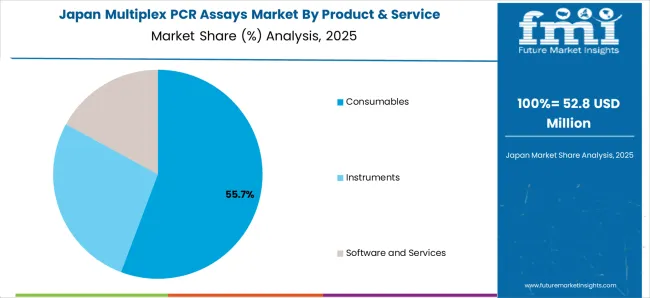
Substantial Investments in Healthcare Infrastructure and Technology Have Led Japan to Develop and Innovate Novel Multiplex PCR Assays.

Country Japan
Market Size (USD billion) by End of Forecast Period (2033) USD 115.0 billion
CAGR % 2023 to End of Forecast (2033) 7.0%

The multiplex PCR assays market in Japan is estimated to reach a market size of USD 115.0 billion by 2033, expected to thrive at a CAGR of 7.0%. Japan has made significant investments in healthcare infrastructure and technology, leading to advancements in diagnostics and molecular testing.

The country has witnessed improvements in laboratory facilities, research capabilities, and access to advanced diagnostic technologies. These developments create a favorable environment for the adoption of multiplex PCR assays in Japan.

Demand for Multiplex PCR Assays Market is Rising Due to Rapidly Expanding Biopharmaceutical and Pharmaceutical Industry.

Country South Korea
Market Size (USD billion) by End of Forecast Period (2033) USD 51.9 billion
CAGR % 2023 to End of Forecast (2033) 4.7%

The multiplex PCR assays market in South Korea is expected to reach a market size of USD 51.9 billion, expanding at a CAGR of 4.7% during the forecast period. South Korea’s biotechnology and pharmaceutical industries have been growing rapidly in recent years. The country has made significant investments in research and development, fostering innovation in life sciences. Multiplex PCR assays find applications in various research and clinical areas, making them valuable tools for biotech and pharma companies. The expansion of these industries fuels the demand for multiplex PCR assays in South Korea.

Multiplex PCR Assays Industry Segmentation by Key Investment Segments

Which Segment of Product & Service Dominated the Global Market?

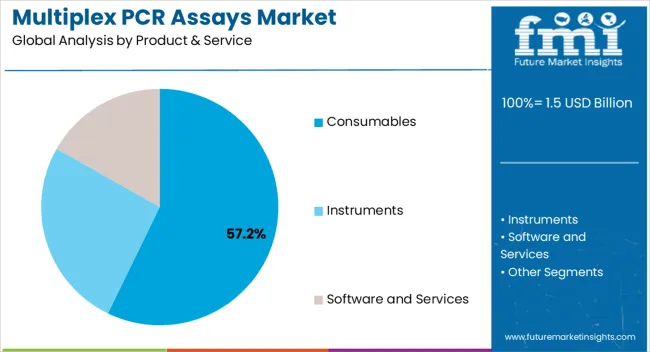
Instrument segment dominated the multiplex PCR assays market with a market share of 53.5% in 2022. Instruments typically have a longer lifespan compared to consumables. Once purchased, instruments can be used for several years with proper maintenance and calibration.

In contrast, consumables such as PCR reagents, primers, probes, and plates are required for each assay and need to be replenished regularly. The lower replacement frequency of instruments compared to consumables contributes to their dominance in the market.

Which Assay Type is Widely Utilized in the Multiplex PCR Assays Industry?

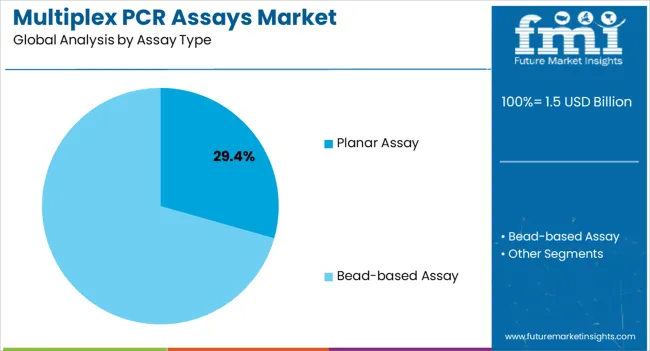
Based on assay type, planar assay segment has dominated the category withholding the significant share of the market at around 64.5% at the end of 2022. Planar assays offer the ability to simultaneously detect and analyze multiple targets in a single assay. They enable the parallel detection of multiple DNA or RNA sequences, gene mutations, or protein markers in a high-throughput manner.

This multiplexing capability is crucial for applications that require the simultaneous analysis of multiple targets, such as genotyping, mutation screening, gene expression profiling, and pathogen detection.

Which Segment is Expected to Lead the ‘Application’ Category Throughout the Forecast Period?

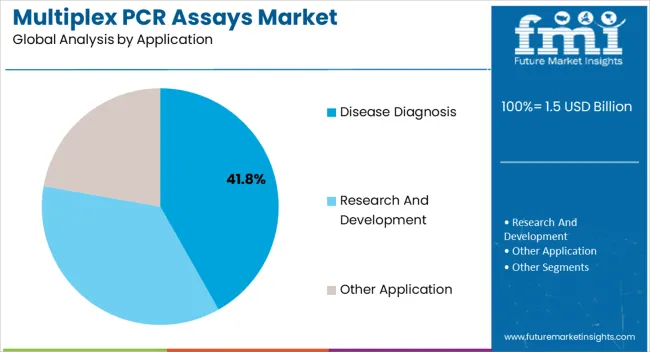
By application, research and development segment is expected to continue leading the market over a CAGR of 9.2% throughout the projected timeframe. Multiplex PCR assays simplify experimental workflows in research and development.

By consolidating multiple targets into a single assay, researchers can reduce the number of experimental steps, including DNA extraction, PCR setup, and sample handling. This streamlining of workflows minimizes the risk of errors, improves reproducibility, and enhances overall experimental efficiency.

Which End User Has Widely Adopted the Multiplex PCR Assay?

The biopharmaceutical companies have led the multiplex PCR assays market as the leading end user with the market share of 40.7% in 2022. Biopharmaceutical companies are engaged in the research and development of new drugs and therapies.

Multiplex PCR assays play a crucial role in the early stages of drug discovery by enabling the simultaneous analysis of multiple genes, biomarkers, or mutations associated with diseases or drug responses. These assays help in identifying potential drug targets, characterizing patient populations, and assessing the efficacy and safety of candidate drugs.
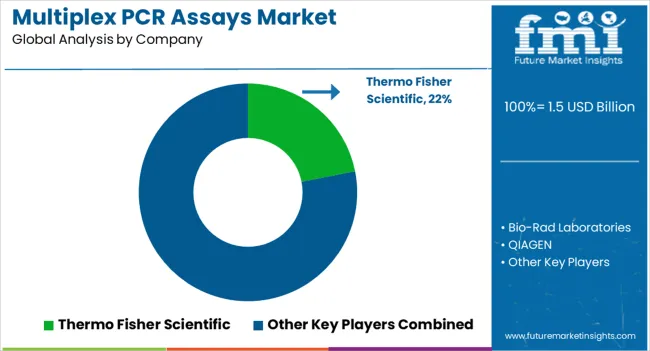
Competitive Landscape of the Multiplex PCR Assays Industry

The multiplex PCR assays industry includes several key players that are actively involved in the development, manufacturing, and distribution of multiplex PCR assay products. Manufacturers are heavily investing in the research and developments activities to come up with novel products in the industry.

Key Strategies Used by the Participants

Product & Service Innovation

Key players continuously invest in research and development to introduce innovative products. They strive to develop assays with improved sensitivity, specificity, accuracy, and ease of use.

Strategic Partnerships and Collaborations

Key players often form strategic partnerships and collaborations with other companies, research institutions, and healthcare organizations. These partnerships can lead to knowledge sharing, joint product development, and expanded market reach.

Expansion into Emerging Markets

Expanding into emerging markets with growing healthcare infrastructure and rising demand for multiplex PCR assays allows companies to tap into new opportunities and gain a competitive edge.

Mergers and Acquisitions

Companies in the market may engage in mergers or acquisitions to streamline their product portfolio, obtain new technologies, enter new market niches, and gain access to novel products or intellectual property.

Leading Players in the Multiplex PCR Assays Industry

  • Thermo Fisher Scientific Inc.
  • Bio-Rad Laboratories
  • QIAGEN
  • Luminex Corporation
  • Fluidigm Corporation
  • BioFire Diagnostics.

Key Developments in the Multiplex PCR Assays Market:

In June 2021, Bio-Rad confirmed its agreement with Seegene to supply molecular testing services in the USA market.

Key Segments

By Product & Service:

  • Consumables
  • Instruments
  • Software and Services

By Assay Type:

  • Planar Assay
    • Blends Protein Arrays (Multiplexed ELISA)
    • Antibody Arrays
  • Bead-based Assay
    • Magnetic Bead-based
    • Non-magnetic Bead-based

By Application:

  • Disease Diagnosis
    • Infectious Disease
    • Cancer
    • Autoimmune Disease
    • Other Diseases
  • Research and Development
  • Other Application

By End User:

  • Biopharmaceutical Companies
  • Clinical Research Organizations
  • Academic Research Institutes
  • Diagnostic Centers
  • Others

By Region:

  • North America
  • Latin America
  • Europe
  • East Asia
  • South Asia
  • Oceania
  • The Middle East & Africa

Table of Content

  • 1. Executive Summary
  • 2. Market Overview
  • 3. Key Market Trends
  • 4. Value Added Insights
  • 5. Market Background
  • 6. Global Market Volume (in Units) Analysis 2017 to 2022 and Forecast, 2023 to 2033
  • 7. Global Market - Pricing Analysis
  • 8. Global Market Demand (in Value or Size in USD Million) Analysis 2017 to 2022 and Forecast, 2023 to 2033
  • 9. Global Market Analysis 2017 to 2022 and Forecast 2023 to 2033, By Product and Services
    • 9.1. Consumables
    • 9.2. Instruments
    • 9.3. Software and Services
  • 10. Global Market Analysis 2017 to 2022 and Forecast 2023 to 2033, By Assay Type
    • 10.1. Planar Assays
      • 10.1.1. Blends Protein Arrays (Multiplexed ELISA)
      • 10.1.2. Antibody Arrays
    • 10.2 Bead-based Assays
      • 10.2.1. Magnetic Bead-based
      • 10.2.2. Non-magnetic Bead-based
  • 11. Global Market Analysis 2017 to 2022 and Forecast 2023 to 2033, By Application
    • 11.1. Disease Diagnosis
      • 11.1.1. Infectious Disease
      • 11.1.2. Cancer
      • 11.1.3. Autoimmune Disease
      • 11.1.4. Other Diseases
    • 11.2 Research and Development
    • 11.3 Other Applications
  • 12. Global Market Analysis 2017 to 2022 and Forecast 2023 to 2033, By End User
    • 12.1. Biopharmaceutical Companies
    • 12.2. Clinical Research Organizations
    • 12.3. Academic Research Institutes
    • 12.4. Diagnostic Centers
    • 12.5. Others
  • 13. Global Market Analysis 2017 to 2022 and Forecast 2023 to 2033, By Region
    • 13.1. North America
    • 13.2. Latin America
    • 13.3. Europe
    • 13.4. South Asia
    • 13.5. East Asia
    • 13.6. Oceania
    • 13.7. Middle East and Africa (MEA)
  • 14. North America Market Analysis 2017 to 2022 and Forecast 2023 to 2033
  • 15. Latin America Market Analysis 2017 to 2022 and Forecast 2023 to 2033
  • 16. Europe Market Analysis 2017 to 2022 and Forecast 2023 to 2033
  • 17. South Asia Market Analysis 2017 to 2022 and Forecast 2023 to 2033
  • 18. East Asia Market Analysis 2017 to 2022 and Forecast 2023 to 2033
  • 19. Oceania Market Analysis 2017 to 2022 and Forecast 2023 to 2033
  • 20. Middle East and Africa Market Analysis 2017 to 2022 and Forecast 2023 to 2033
  • 21. Market Structure Analysis
  • 22. Competition Analysis
    • 22.1. Thermo Fisher Scientific
    • 22.2. Bio-Rad Laboratories
    • 22.3. QIAGEN
    • 22.4. Luminex Corporation
    • 22.5. Fluidigm Corporation
    • 22.6. BioFire Diagnostics
  • 23. Assumptions and Acronyms Used
  • 24. Research Methodology

List of Tables

Table 01: Global Market Value (US$ Million) Analysis and Forecast 2017 to 2033, by Product and Services

Table 02: Global Market Volume (Units) Analysis and Forecast 2017 to 2033, by Product and Services

Table 03: Global Market Value (US$ Million) Analysis and Forecast 2017 to 2033, by Assay Type

Table 04: Global Market Value (US$ Million) Analysis and Forecast 2017 to 2033, by Application

Table 05: Global Market Value (US$ Million) Analysis and Forecast 2017 to 2033, by End User

Table 06: Global Market Value (US$ Million) Analysis and Forecast 2017 to 2033, by Region

Table 07: North America Market Value (US$ Million) Analysis 2017 to 2022 and Forecast 2022 to 2033, by Country

Table 08: North America Market Value (US$ Million) Analysis and Forecast 2017 to 2033, by Product and Services

Table 09: North America Market Volume (Units) Analysis and Forecast 2017 to 2033, by Product and Services

Table 10: North America Market Value (US$ Million) Analysis and Forecast 2017 to 2033, by Assay Type

Table 11: North America Market Value (US$ Million) Analysis and Forecast 2017 to 2033, by Application

Table 12: North America Market Value (US$ Million) Analysis and Forecast 2017 to 2033, by End User

Table 13: Latin America Market Value (US$ Million) Analysis 2017 to 2022 and Forecast 2022 to 2033, by Country

Table 14: Latin America Market Value (US$ Million) Analysis and Forecast 2017 to 2033, by Product and Services

Table 15: Latin America Market Volume (Units) Analysis and Forecast 2017 to 2033, by Product and Services

Table 16: Latin America Market Value (US$ Million) Analysis and Forecast 2017 to 2033, by Assay Type

Table 17: Latin America Market Value (US$ Million) Analysis and Forecast 2017 to 2033, by Application

Table 18: Latin America Market Value (US$ Million) Analysis and Forecast 2017 to 2033, by End User

Table 19: Europe Market Value (US$ Million) Analysis 2017 to 2022 and Forecast 2022 to 2033, by Country

Table 20: Europe Market Value (US$ Million) Analysis and Forecast 2017 to 2033, by Product and Services

Table 21: Europe Market Volume (Units) Analysis and Forecast 2017 to 2033, by Product and Services

Table 22: Europe Market Value (US$ Million) Analysis and Forecast 2017 to 2033, by Assay Type

Table 23: Europe Market Value (US$ Million) Analysis and Forecast 2017 to 2033, by Application

Table 24: Europe Market Value (US$ Million) Analysis and Forecast 2017 to 2033, by End User

Table 25: South Asia Market Value (US$ Million) Analysis 2017 to 2022 and Forecast 2022 to 2033, by Country

Table 26: South Asia Market Value (US$ Million) Analysis and Forecast 2017 to 2033, by Product and Services

Table 27: South Asia Market Volume (Units) Analysis and Forecast 2017 to 2033, by Product and Services

Table 28: South Asia Market Value (US$ Million) Analysis and Forecast 2017 to 2033, by Assay Type

Table 29: South Asia Market Value (US$ Million) Analysis and Forecast 2017 to 2033, by Application

Table 30: South Asia Market Value (US$ Million) Analysis and Forecast 2017 to 2033, by End User

Table 31: East Asia Market Value (US$ Million) Analysis 2017 to 2022 and Forecast 2022 to 2033, by Country

Table 32: East Asia Market Value (US$ Million) Analysis and Forecast 2017 to 2033, by Product and Services

Table 33: East Asia Market Volume (Units) Analysis and Forecast 2017 to 2033, by Product and Services

Table 34: East Asia Market Value (US$ Million) Analysis and Forecast 2017 to 2033, by Assay Type

Table 35: East Asia Market Value (US$ Million) Analysis and Forecast 2017 to 2033, by Application

Table 36: East Asia Market Value (US$ Million) Analysis and Forecast 2017 to 2033, by End User

Table 37: Oceania Market Value (US$ Million) Analysis 2017 to 2022 and Forecast 2022 to 2033, by Country

Table 38: Oceania Market Value (US$ Million) Analysis and Forecast 2017 to 2033, by Product and Services

Table 39: Oceania Market Volume (Units) Analysis and Forecast 2017 to 2033, by Product and Services

Table 40: Oceania Market Value (US$ Million) Analysis and Forecast 2017 to 2033, by Assay Type

Table 41: Oceania Market Value (US$ Million) Analysis and Forecast 2017 to 2033, by Application

Table 42: Oceania Market Value (US$ Million) Analysis and Forecast 2017 to 2033, by End User

Table 43: Middle East and Africa Market Value (US$ Million) Analysis 2017 to 2022 and Forecast 2022 to 2033, by Country

Table 44: Middle East and Africa Market Value (US$ Million) Analysis and Forecast 2017 to 2033, by Product and Services

Table 45: Middle East and Africa Market Volume (Units) Analysis and Forecast 2017 to 2033, by Product and Services

Table 46: Middle East and Africa Market Value (US$ Million) Analysis and Forecast 2017 to 2033, by Assay Type

Table 47: Middle East and Africa Market Value (US$ Million) Analysis and Forecast 2017 to 2033, by Application

Table 48: Middle East and Africa Market Value (US$ Million) Analysis and Forecast 2017 to 2033, by End User

List of Figures

Figure 01: Global Market Volume (Units), 2017 to 2022

Figure 02: Global Market Volume (Units) & Y-o-Y Growth (%) Analysis,

Figure 03: Pricing Analysis per unit (US$), in 2022

Figure 04: Pricing Forecast per unit (US$), in 2033

Figure 05: Global Market Value (US$ Million) Analysis, 2017 to 2022

Figure 06: Global Market Forecast & Y-o-Y Growth, 2022 to 2033

Figure 07: Global Market Absolute $ Opportunity (US$ Million) Analysis, 2022 to 2033

Figure 08: Global Market Value Share (%) Analysis 2023 and 2033, by Product and Services

Figure 09: Global Market Y-o-Y Growth (%) Analysis 2023 to 2033, by Product and Services

Figure 10: Global Market Attractiveness Analysis 2022 to 2033, by Product and Services

Figure 11: Global Market Value Share (%) Analysis 2023 and 2033, by Assay Type

Figure 12: Global Market Y-o-Y Growth (%) Analysis 2023 to 2033, by Assay Type

Figure 13: Global Market Attractiveness Analysis 2022 to 2033, by Assay Type

Figure 14: Global Market Value Share (%) Analysis 2023 and 2033, by Application

Figure 15: Global Market Y-o-Y Growth (%) Analysis 2023 to 2033, by Application

Figure 16: Global Market Attractiveness Analysis 2022 to 2033, by Application

Figure 17: Global Market Value Share (%) Analysis 2023 and 2033, by End User

Figure 18: Global Market Y-o-Y Growth (%) Analysis 2023 to 2033, by End User

Figure 19: Global Market Attractiveness Analysis 2022 to 2033, by End User

Figure 20: Global Market Value Share (%) Analysis 2023 and 2033, by Region

Figure 21: Global Market Y-o-Y Growth (%) Analysis 2023 to 2033, by Region

Figure 22: Global Market Attractiveness Analysis 2022 to 2033, by Region

Figure 23: North America Market Value (US$ Million) Analysis, 2017 to 2022

Figure 24: North America Market Value (US$ Million) Forecast, 2023 to 2033

Figure 25: North America Market Value Share, by Product and Services (2023 E)

Figure 26: North America Market Value Share, by Assay Type (2023 E)

Figure 27: North America Market Value Share, by Application (2023 E)

Figure 28: North America Market Value Share, by End User (2023 E)

Figure 29: North America Market Value Share, by Country (2023 E)

Figure 30: North America Market Attractiveness Analysis by Product and Services, 2022 to 2033

Figure 31: North America Market Attractiveness Analysis by Assay Type, 2022 to 2033

Figure 32: North America Market Attractiveness Analysis by Application, 2022 to 2033

Figure 33: North America Market Attractiveness Analysis by End User, 2022 to 2033

Figure 34: North America Market Attractiveness Analysis by Country, 2022 to 2033

Figure 35: USA Market Value Proportion Analysis, 2022

Figure 36: Global Vs. USA Growth Comparison

Figure 37: USA Market Share Analysis (%) by Product and Services, 2022 & 2033

Figure 38: USA Market Share Analysis (%) by Assay Type, 2022 & 2033

Figure 39: USA Market Share Analysis (%) by Application, 2022 & 2033

Figure 40: USA Market Share Analysis (%) by End User, 2022 & 2033

Figure 41: Canada Market Value Proportion Analysis, 2022

Figure 42: Global Vs. Canada. Growth Comparison

Figure 43: Canada Market Share Analysis (%) by Product and Services, 2022 & 2033

Figure 44: Canada Market Share Analysis (%) by Assay Type, 2022 & 2033

Figure 45: Canada Market Share Analysis (%) by Application, 2022 & 2033

Figure 46: Canada Market Share Analysis (%) by End User, 2022 & 2033

Figure 47: Latin America Market Value (US$ Million) Analysis, 2017 to 2022

Figure 48: Latin America Market Value (US$ Million) Forecast, 2023 to 2033

Figure 49: Latin America Market Value Share, by Product and Services (2023 E)

Figure 50: Latin America Market Value Share, by Assay Type (2023 E)

Figure 51: Latin America Market Value Share, by Application (2023 E)

Figure 52: Latin America Market Value Share, by End User (2023 E)

Figure 53: Latin America Market Value Share, by Country (2023 E)

Figure 54: Latin America Market Attractiveness Analysis by Product and Services, 2022 to 2033

Figure 55: Latin America Market Attractiveness Analysis by Assay Type, 2022 to 2033

Figure 56: Latin America Market Attractiveness Analysis by Application, 2022 to 2033

Figure 57: Latin America Market Attractiveness Analysis by End User, 2022 to 2033

Figure 58: Latin America Market Attractiveness Analysis by Country, 2022 to 2033

Figure 59: Mexico Market Value Proportion Analysis, 2022

Figure 60: Global Vs Mexico Growth Comparison

Figure 61: Mexico Market Share Analysis (%) by Product and Services, 2022 & 2033

Figure 62: Mexico Market Share Analysis (%) by Assay Type, 2022 & 2033

Figure 63: Mexico Market Share Analysis (%) by Application, 2022 & 2033

Figure 64: Mexico Market Share Analysis (%) by End User, 2022 & 2033

Figure 65: Brazil Market Value Proportion Analysis, 2022

Figure 66: Global Vs. Brazil. Growth Comparison

Figure 67: Brazil Market Share Analysis (%) by Product and Services, 2022 & 2033

Figure 68: Brazil Market Share Analysis (%) by Assay Type, 2022 & 2033

Figure 69: Brazil Market Share Analysis (%) by Application, 2022 & 2033

Figure 70: Brazil Market Share Analysis (%) by End User, 2022 & 2033

Figure 71: Argentina Market Value Proportion Analysis, 2022

Figure 72: Global Vs Argentina Growth Comparison

Figure 73: Argentina Market Share Analysis (%) by Product and Services, 2022 & 2033

Figure 74: Argentina Market Share Analysis (%) by Assay Type, 2022 & 2033

Figure 75: Argentina Market Share Analysis (%) by Application, 2022 & 2033

Figure 76: Argentina Market Share Analysis (%) by End User, 2022 & 2033

Figure 77: Europe Market Value (US$ Million) Analysis, 2017 to 2022

Figure 78: Europe Market Value (US$ Million) Forecast, 2023 to 2033

Figure 79: Europe Market Value Share, by Product and Services (2023 E)

Figure 80: Europe Market Value Share, by Assay Type (2023 E)

Figure 81: Europe Market Value Share, by Application (2023 E)

Figure 82: Europe Market Value Share, by End User (2023 E)

Figure 83: Europe Market Value Share, by Country (2023 E)

Figure 84: Europe Market Attractiveness Analysis by Product and Services, 2022 to 2033

Figure 85: Europe Market Attractiveness Analysis by Assay Type, 2022 to 2033

Figure 86: Europe Market Attractiveness Analysis by Application, 2022 to 2033

Figure 87: Europe Market Attractiveness Analysis by End User, 2022 to 2033

Figure 88: Europe Market Attractiveness Analysis by Country, 2022 to 2033

Figure 89: UK Market Value Proportion Analysis, 2022

Figure 90: Global Vs. UK Growth Comparison

Figure 91: UK Market Share Analysis (%) by Product and Services, 2022 & 2033

Figure 92: UK Market Share Analysis (%) by Assay Type, 2022 & 2033

Figure 93: UK Market Share Analysis (%) by Application, 2022 & 2033

Figure 94: UK Market Share Analysis (%) by End User, 2022 & 2033

Figure 95: Germany Market Value Proportion Analysis, 2022

Figure 96: Global Vs. Germany Growth Comparison

Figure 97: Germany Market Share Analysis (%) by Product and Services, 2022 & 2033

Figure 98: Germany Market Share Analysis (%) by Assay Type, 2022 & 2033

Figure 99: Germany Market Share Analysis (%) by Application, 2022 & 2033

Figure 100: Germany Market Share Analysis (%) by End User, 2022 & 2033

Figure 101: Italy Market Value Proportion Analysis, 2022

Figure 102: Global Vs. Italy Growth Comparison

Figure 103: Italy Market Share Analysis (%) by Product and Services, 2022 & 2033

Figure 104: Italy Market Share Analysis (%) by Assay Type, 2022 & 2033

Figure 105: Italy Market Share Analysis (%) by Application, 2022 & 2033

Figure 106: Italy Market Share Analysis (%) by End User, 2022 & 2033

Figure 107: France Market Value Proportion Analysis, 2022

Figure 108: Global Vs France Growth Comparison

Figure 109: France Market Share Analysis (%) by Product and Services, 2022 & 2033

Figure 110: France Market Share Analysis (%) by Assay Type, 2022 & 2033

Figure 111: France Market Share Analysis (%) by Application, 2022 & 2033

Figure 112: France Market Share Analysis (%) by End User, 2022 & 2033

Figure 113: Spain Market Value Proportion Analysis, 2022

Figure 114: Global Vs Spain Growth Comparison

Figure 115: Spain Market Share Analysis (%) by Product and Services, 2022 & 2033

Figure 116: Spain Market Share Analysis (%) by Assay Type, 2022 & 2033

Figure 117: Spain Market Share Analysis (%) by Application, 2022 & 2033

Figure 118: Spain Market Share Analysis (%) by End User, 2022 & 2033

Figure 119: Russia Market Value Proportion Analysis, 2022

Figure 120: Global Vs Russia Growth Comparison

Figure 121: Russia Market Share Analysis (%) by Product and Services, 2022 & 2033

Figure 122: Russia Market Share Analysis (%) by Assay Type, 2022 & 2033

Figure 123: Russia Market Share Analysis (%) by Application, 2022 & 2033

Figure 124: Russia Market Share Analysis (%) by End User, 2022 & 2033

Figure 125: BENELUX Market Value Proportion Analysis, 2022

Figure 126: Global Vs BENELUX Growth Comparison

Figure 127: BENELUX Market Share Analysis (%) by Product and Services, 2022 & 2033

Figure 128: BENELUX Market Share Analysis (%) by Assay Type, 2022 & 2033

Figure 129: BENELUX Market Share Analysis (%) by Application, 2022 & 2033

Figure 130: BENELUX Market Share Analysis (%) by End User, 2022 & 2033

Figure 131: East Asia Market Value (US$ Million) Analysis, 2017 to 2022

Figure 132: East Asia Market Value (US$ Million) Forecast, 2023 to 2033

Figure 133: East Asia Market Value Share, by Product and Services (2023 E)

Figure 134: East Asia Market Value Share, by Assay Type (2023 E)

Figure 135: East Asia Market Value Share, by Application (2023 E)

Figure 136: East Asia Market Value Share, by End User (2023 E)

Figure 137: East Asia Market Value Share, by Country (2023 E)

Figure 138: East Asia Market Attractiveness Analysis by Product and Services, 2022 to 2033

Figure 139: East Asia Market Attractiveness Analysis by Assay Type, 2022 to 2033

Figure 140: East Asia Market Attractiveness Analysis by Application, 2022 to 2033

Figure 141: East Asia Market Attractiveness Analysis by End User, 2022 to 2033

Figure 142: East Asia Market Attractiveness Analysis by Country, 2022 to 2033

Figure 143: China Market Value Proportion Analysis, 2022

Figure 144: Global Vs. China Growth Comparison

Figure 145: China Market Share Analysis (%) by Product and Services, 2022 & 2033

Figure 146: China Market Share Analysis (%) by Assay Type, 2022 & 2033

Figure 147: China Market Share Analysis (%) by Application, 2022 & 2033

Figure 148: China Market Share Analysis (%) by End User, 2022 & 2033

Figure 149: Japan Market Value Proportion Analysis, 2022

Figure 150: Global Vs. Japan Growth Comparison

Figure 151: Japan Market Share Analysis (%) by Product and Services, 2022 & 2033

Figure 152: Japan Market Share Analysis (%) by Assay Type, 2022 & 2033

Figure 153: Japan Market Share Analysis (%) by Application, 2022 & 2033

Figure 154: Japan Market Share Analysis (%) by End User, 2022 & 2033

Figure 155: South Korea Market Value Proportion Analysis, 2022

Figure 156: Global Vs South Korea Growth Comparison

Figure 157: South Korea Market Share Analysis (%) by Product and Services, 2022 & 2033

Figure 158: South Korea Market Share Analysis (%) by Assay Type, 2022 & 2033

Figure 159: South Korea Market Share Analysis (%) by Application, 2022 & 2033

Figure 160: South Korea Market Share Analysis (%) by End User, 2022 & 2033

Figure 161: South Asia Market Value (US$ Million) Analysis, 2017 to 2022

Figure 162: South Asia Market Value (US$ Million) Forecast, 2023 to 2033

Figure 163: South Asia Market Value Share, by Product and Services (2023 E)

Figure 164: South Asia Market Value Share, by Assay Type (2023 E)

Figure 165: South Asia Market Value Share, by Application (2023 E)

Figure 166: South Asia Market Value Share, by End User (2023 E)

Figure 167: South Asia Market Value Share, by Country (2023 E)

Figure 168: South Asia Market Attractiveness Analysis by Product and Services, 2022 to 2033

Figure 169: South Asia Market Attractiveness Analysis by Assay Type, 2022 to 2033

Figure 170: South Asia Market Attractiveness Analysis by Application, 2022 to 2033

Figure 171: South Asia Market Attractiveness Analysis by End User, 2022 to 2033

Figure 172: South Asia Market Attractiveness Analysis by Country, 2022 to 2033

Figure 173: India Market Value Proportion Analysis, 2022

Figure 174: Global Vs. India Growth Comparison

Figure 175: India Market Share Analysis (%) by Product and Services, 2022 & 2033

Figure 176: India Market Share Analysis (%) by Assay Type, 2022 & 2033

Figure 177: India Market Share Analysis (%) by Application, 2022 & 2033

Figure 178: India Market Share Analysis (%) by End User, 2022 & 2033

Figure 179: Indonesia Market Value Proportion Analysis, 2022

Figure 180: Global Vs. Indonesia Growth Comparison

Figure 181: Indonesia Market Share Analysis (%) by Product and Services, 2022 & 2033

Figure 182: Indonesia Market Share Analysis (%) by Assay Type, 2022 & 2033

Figure 183: Indonesia Market Share Analysis (%) by Application, 2022 & 2033

Figure 184: Indonesia Market Share Analysis (%) by End User, 2022 & 2033

Figure 185: Malaysia Market Value Proportion Analysis, 2022

Figure 186: Global Vs. Malaysia Growth Comparison

Figure 187: Malaysia Market Share Analysis (%) by Product and Services, 2022 & 2033

Figure 188: Malaysia Market Share Analysis (%) by Assay Type, 2022 & 2033

Figure 189: Malaysia Market Share Analysis (%) by Application, 2022 & 2033

Figure 190: Malaysia Market Share Analysis (%) by End User, 2022 & 2033

Figure 191: Thailand Market Value Proportion Analysis, 2022

Figure 192: Global Vs. Thailand Growth Comparison

Figure 193: Thailand Market Share Analysis (%) by Product and Services, 2022 & 2033

Figure 194: Thailand Market Share Analysis (%) by Assay Type, 2022 & 2033

Figure 195: Thailand Market Share Analysis (%) by Application, 2022 & 2033

Figure 196: Thailand Market Share Analysis (%) by End User, 2022 & 2033

Figure 197: Oceania Market Value (US$ Million) Analysis, 2017 to 2022

Figure 198: Oceania Market Value (US$ Million) Forecast, 2023 to 2033

Figure 199: Oceania Market Value Share, by Product and Services (2023 E)

Figure 200: Oceania Market Value Share, by Assay Type (2023 E)

Figure 201: Oceania Market Value Share, by Application (2023 E)

Figure 202: Oceania Market Value Share, by End User (2023 E)

Figure 203: Oceania Market Value Share, by Country (2023 E)

Figure 204: Oceania Market Attractiveness Analysis by Product and Services, 2022 to 2033

Figure 205: Oceania Market Attractiveness Analysis by Assay Type, 2022 to 2033

Figure 206: Oceania Market Attractiveness Analysis by Application, 2022 to 2033

Figure 207: Oceania Market Attractiveness Analysis by End User, 2022 to 2033

Figure 208: Oceania Market Attractiveness Analysis by Country, 2022 to 2033

Figure 209: Australia Market Value Proportion Analysis, 2022

Figure 210: Global Vs. Australia Growth Comparison

Figure 211: Australia Market Share Analysis (%) by Product and Services, 2022 & 2033

Figure 212: Australia Market Share Analysis (%) by Assay Type, 2022 & 2033

Figure 213: Australia Market Share Analysis (%) by Application, 2022 & 2033

Figure 214: Australia Market Share Analysis (%) by End User, 2022 & 2033

Figure 215: New Zealand Market Value Proportion Analysis, 2022

Figure 216: Global Vs New Zealand Growth Comparison

Figure 217: New Zealand Market Share Analysis (%) by Product and Services, 2022 & 2033

Figure 218: New Zealand Market Share Analysis (%) by Assay Type, 2022 & 2033

Figure 219: New Zealand Market Share Analysis (%) by Application, 2022 & 2033

Figure 220: New Zealand Market Share Analysis (%) by End User, 2022 & 2033

Figure 221: Middle East & Africa Market Value (US$ Million) Analysis, 2017 to 2022

Figure 222: Middle East & Africa Market Value (US$ Million) Forecast, 2023 to 2033

Figure 223: Middle East & Africa Market Value Share, by Product and Services (2023 E)

Figure 224: Middle East & Africa Market Value Share, by Assay Type (2023 E)

Figure 225: Middle East & Africa Market Value Share, by Application (2023 E)

Figure 226: Middle East & Africa Market Value Share, by End User (2023 E)

Figure 227: Middle East & Africa Market Value Share, by Country (2023 E)

Figure 228: Middle East & Africa Market Attractiveness Analysis by Product and Services, 2022 to 2033

Figure 229: Middle East & Africa Market Attractiveness Analysis by Assay Type, 2022 to 2033

Figure 230: Middle East & Africa Market Attractiveness Analysis by Application, 2022 to 2033

Figure 231: Middle East & Africa Market Attractiveness Analysis by End User, 2022 to 2033

Figure 232: Middle East & Africa Market Attractiveness Analysis by Country, 2022 to 2033

Figure 233: GCC Countries Market Value Proportion Analysis, 2022

Figure 234: Global Vs GCC Countries Growth Comparison

Figure 235: GCC Countries Market Share Analysis (%) by Product and Services, 2022 & 2033

Figure 236: GCC Countries Market Share Analysis (%) by Assay Type, 2022 & 2033

Figure 237: GCC Countries Market Share Analysis (%) by Application, 2022 & 2033

Figure 238: GCC Countries Market Share Analysis (%) by End User, 2022 & 2033

Figure 239: Türkiye Market Value Proportion Analysis, 2022

Figure 240: Global Vs. Türkiye Growth Comparison

Figure 241: Türkiye Market Share Analysis (%) by Product and Services, 2022 & 2033

Figure 242: Türkiye Market Share Analysis (%) by Assay Type, 2022 & 2033

Figure 243: Türkiye Market Share Analysis (%) by Application, 2022 & 2033

Figure 244: Türkiye Market Share Analysis (%) by End User, 2022 & 2033

Figure 245: South Africa Market Value Proportion Analysis, 2022

Figure 246: Global Vs. South Africa Growth Comparison

Figure 247: South Africa Market Share Analysis (%) by Product and Services, 2022 & 2033

Figure 248: South Africa Market Share Analysis (%) by Assay Type, 2022 & 2033

Figure 249: South Africa Market Share Analysis (%) by Application, 2022 & 2033

Figure 250: South Africa Market Share Analysis (%) by End User, 2022 & 2033

Figure 251: Northern Africa Market Value Proportion Analysis, 2022

Figure 252: Global Vs Northern Africa Growth Comparison

Figure 253: Northern Africa Market Share Analysis (%) by Product and Services, 2022 & 2033

Figure 254: Northern Africa Market Share Analysis (%) by Assay Type, 2022 & 2033

Figure 255: Northern Africa Market Share Analysis (%) by Application, 2022 & 2033

Figure 256: Northern Africa Market Share Analysis (%) by End User, 2022 & 2033

Frequently Asked Questions

What is the Current Worth of the Multiplex PCR Assays Market?

The global multiplex PCR assays market is expected to reach a valuation of USD 1.3 billion by 2023.

How is the Demand for Multiplex PCR Assays Market Increasing?

The multiplex PCR assays market demand is set to expand by 8.5% during the assessment period.

Which Product & Service Holds the Notable Market Share in the Global Multiplex PCR Assays Market?

The instrument segment is projected to hold the dominant share of the market.

What is the Predicted Valuation of the Multiplex PCR Assays Market by 2033?

The market is predicted to exceed USD 3.0 billion by 2033.

Which is the Most Profitable Region for the Multiplex PCR Assays Industry?

The North America offers key opportunities for new entrants in the multiplex PCR assays market.

Explore Similar Insights

Future Market Insights

Multiplex PCR Assays Market