The Multichannel Networks Market is estimated to be valued at USD 6.3 billion in 2025 and is projected to reach USD 20.9 billion by 2035, registering a compound annual growth rate (CAGR) of 12.8% over the forecast period.
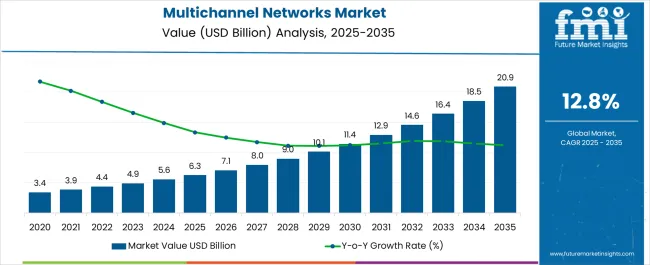
| Metric | Value |
|---|---|
| Multichannel Networks Market Estimated Value in (2025E) | USD 6.3 billion |
| Multichannel Networks Market Forecast Value in (2035F) | USD 20.9 billion |
| Forecast CAGR (2025 to 2035) | 12.8% |
The multichannel networks (MCN) market is experiencing steady momentum, driven by the rising demand for content monetization, influencer partnerships, and cross-platform video distribution. As digital consumption habits evolve, MCNs are being leveraged to manage rights, optimize revenue streams, and support creator scalability on platforms like YouTube, Facebook, and OTT networks.
The shift toward short-form and mobile-friendly video content is accelerating the adoption of MCN services among both individual creators and brands. Enterprises are increasingly depending on MCNs to execute audience targeting, brand collaborations, and analytics-backed campaign strategies.
Industry consolidation, regional content expansion, and growing investments in vernacular and niche content have further contributed to MCN platform relevance. The market is expected to grow through advancements in automation tools, AI-driven metadata management, and integration with e-commerce and live streaming models, enhancing the monetization ecosystem for creators and advertisers alike.
The market is segmented by Services, Application, and End User and region. By Services, the market is divided into Production & Editing, Funding, Monetization Assistance, Cross-Promotion, and Digital Rights Management. In terms of Application, the market is classified into Media & Entertainment, Telecommunication, BFSI, TV Broadcasting, and Information Technology. Based on End User, the market is segmented into Large Enterprises, Small, and Medium. Regionally, the market is classified into North America, Latin America, Western Europe, Eastern Europe, Balkan & Baltic Countries, Russia & Belarus, Central Asia, East Asia, South Asia & Pacific, and the Middle East & Africa.
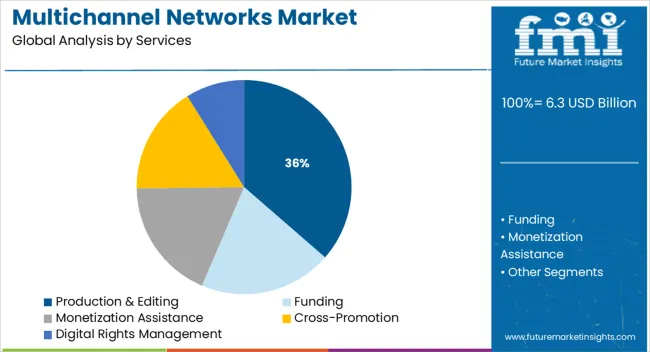
Production & editing services are projected to contribute 36.4% of the total market revenue in 2025, making it the leading services segment in the multichannel networks market. This segment’s growth is being supported by the increasing need for high-quality, brand-consistent video content that aligns with platform-specific algorithms and viewer expectations.
MCNs are investing in in-house studios, motion graphics, and post-production expertise to provide end-to-end content solutions for creators and enterprise clients. The demand for editing automation tools and dynamic templates has also improved service scalability.
Furthermore, with rising competition in the creator economy, professional editing services are being positioned as a differentiator for audience retention and engagement.
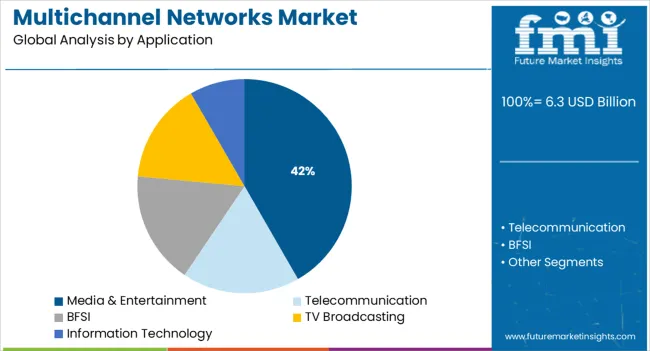
Media and entertainment is anticipated to lead with a 41.7% revenue share in 2025, representing the top application area for MCN services. This segment is benefiting from a surge in digital-first programming, OTT channel expansion, and content syndication strategies.
MCNs are acting as intermediaries between content producers and platforms, offering performance analytics, monetization planning, and IP protection. Increased demand for binge-worthy series, music videos, vlogs, and behind-the-scenes content is fueling continuous engagement cycles that require MCN support.
As streaming platforms seek consistent content pipelines, MCNs are strengthening their position by enabling scale, cross-platform publishing, and audience engagement optimization.
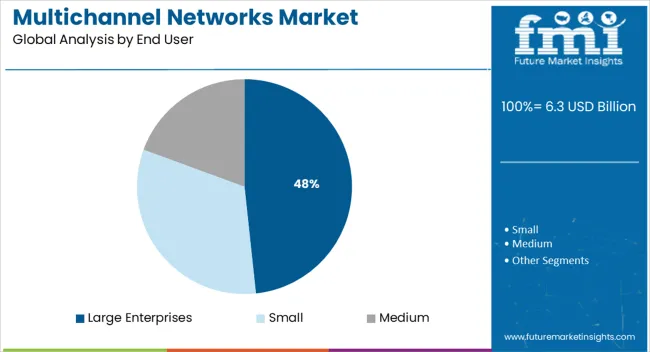
Large enterprises are projected to contribute 48.3% of the multichannel networks market revenue in 2025, securing their position as the dominant end-user segment. Their leadership stems from increased reliance on influencer marketing, branded content campaigns, and regional content partnerships to engage digital audiences.
Enterprises are using MCNs to outsource creator collaborations, track ROI on campaigns, and maintain content governance across multiple geographies and platforms. The scalability and operational support offered by MCNs have become essential for companies managing multiple digital brands and campaigns simultaneously.
As enterprises invest in content-driven customer acquisition and loyalty, MCNs are evolving into strategic partners for long-term digital communication strategies.
Vloggers and/or content creators are increasing business on YouTube with creative content catered to their type of audience. This boosts online and mobile viewership and manifests platform diversification.
Hence, the growth in the number of content creators bolsters the rise in business on YouTube, which is expected to propel the multichannel networks market growth.
Content creators are further partnering with multichannel networks to enhance video creation, higher CPM, production and editing facilities, marketing and promotion, events, copyrights, licenses, etc., for videos.
Moreover, multichannel networks also assist content creators in various areas, including product, programming, cross-promotion, sales, audience development, partner management, digital rights management, etc., in exchange for a percentage of ad revenue.
Video platform channels have witnessed an increase in their audience base, performance, and revenue augmentation. Additionally, the number of online videos is increasing, which is changing the viewing habits of video consumers/viewers.
This is because the contents of a video can be anything that creators want to share with viewers, which gives their viewers a myriad of preferences. This is likely to surge the adoption of multichannel networks.
There is an increasing threat due to cyberattacks which can lead to severe complications and loss or theft of data. Additionally, there are high investments associated with MCNs.
In addition, the growth of the market may be further hampered due to siloed departments having minimal data sharing and cross-communication, which makes it difficult to manage campaigns without understanding aspects of consumer behavior. This is likely to expand the global multichannel networks market size.
On the contrary, key providers are considering expanding campaigns to encompass more channels to reach more possible potential customers. Moreover, there has been a high demand for detailed reviews on brands or receiving expository advertisements of products from a brand.
Furthermore, social media can be used to reach potential customers and content creators to reinforce marketing messages as a mutually beneficial strategy that is likely to produce market opportunities.
With a remarkable revenue of 37.1%, North America holds the largest share of the multichannel networks market. This is attributed to digital transformation and rising online viewership.
Ongoing digital developments are driving the growth of video viewing. Furthermore, new audiences for publishers and content creators are increasing owing to the expansion of the internet in this region. Channels such as Hulu and Netflix are anticipated to broadcast the multichannel network market.
Europe is the second largest market, with a revenue of 20.5%. This is owing to YouTube and Facebook together having a whopping 56% market share of online video advertising in the European region. This is anticipated to boost the global multichannel networks market growth.
Start-up companies have witnessed the growth of social media video platforms and the surge in the number of content creators who generate significant ad revenues and are contributing to the expansion of the multichannel networks market size:
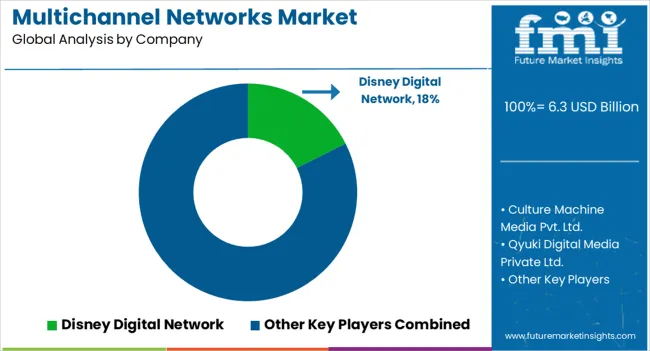
The top market players contribute greatly to the multichannel networks market share with innovative ideas and advancements to enhance the social media platforms and ensure the beneficiary of every party involved in advertising and revenue generation.
Key Market Players Of The Multichannel Networks Market:
Latest developments in the multichannel networks market:
| Report Attribute | Details |
|---|---|
| Growth Rate | CAGR of 12.8% from 2025 to 2035 |
| The base year for estimation | 2024 |
| Historical data | 2020 to 2024 |
| Forecast period | 2025 to 2035 |
| Quantitative units | Revenue in USD million and CAGR from 2025 to 2035 |
| Report Coverage | Revenue forecast, volume forecast, company ranking, competitive landscape, growth factors, and trends, Pricing Analysis |
| Segments Covered | Services, Application, End User, and Region. |
| Regional scope | North America; Western Europe; Eastern Europe; the Middle East; Africa; ASEAN; South Asia; the Rest of Asia |
| Country scope | USA, Canada, Mexico, Germany, United Kingdom, France, Italy, Spain, Russia, Belgium, Poland, Czech Republic, China, India, Japan, Australia, Brazil, Argentina, Colombia, Saudi Arabia, United Arab Emirates(UAE), Iran, South Africa |
| Key companies profiled | Maker Studios Inc.; Fullscreen Inc.; Culture Machine Media Pvt. Ltd; Qyuki Digital Media Private Limited; Vevo LLC; ZEFR Inc.; Universal Music Group Inc.; Warner Bros. Entertainment Inc.; The Orchard Enterprises Inc.; Disney Digital Network; Brave Bison; RTL Group; Mediakraft Networks GmbH; Warner Music Inc.; ZINFI Technologies Inc.; The Yogscast; Base79; ProSiebenSat.1 Media; Endemol; Divimove GmbH; Rutube; Mediakraft Networks GmbH; Banijay; Machinima Inc. etc. |
| Customization scope | Free report customization (equivalent to up to 8 analysts' working days) with purchase. Addition or alteration to country, regional & segment scope. |
| Pricing and purchase options | Avail customized purchase options to meet your exact research needs. |
The global multichannel networks market is estimated to be valued at USD 6.3 billion in 2025.
The market size for the multichannel networks market is projected to reach USD 20.9 billion by 2035.
The multichannel networks market is expected to grow at a 12.8% CAGR between 2025 and 2035.
The key product types in multichannel networks market are production & editing, funding, monetization assistance, cross-promotion and digital rights management.
In terms of application, media & entertainment segment to command 41.7% share in the multichannel networks market in 2025.


Full Research Suite comprises of:
Market outlook & trends analysis
Interviews & case studies
Strategic recommendations
Vendor profiles & capabilities analysis
5-year forecasts
8 regions and 60+ country-level data splits
Market segment data splits
12 months of continuous data updates
DELIVERED AS:
PDF EXCEL ONLINE
Multichannel Electrochemical Workstation Market Size and Share Forecast Outlook 2025 to 2035
Multichannel Order Management Market Forecast and Outlook 2025 to 2035
Multichannel Reagent Reservoir Market Size and Share Forecast Outlook 2025 to 2035
Multichannel Infusion Pump Market
Electronic Multichannel Pipettes Market
Life Science Multichannel Campaign Management Market Size and Share Forecast Outlook 2025 to 2035
Mobile Social Networks Market Size and Share Forecast Outlook 2025 to 2035
Enterprise Social Networks Market Size and Share Forecast Outlook 2025 to 2035
LTE And 5G NR-Based CBRS Networks Market Size and Share Forecast Outlook 2025 to 2035

Thank you!
You will receive an email from our Business Development Manager. Please be sure to check your SPAM/JUNK folder too.
Chat With
MaRIA