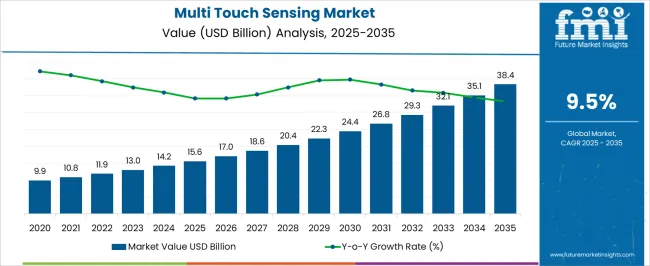
The Multi Touch Sensing Market is estimated to be valued at USD 15.6 billion in 2025 and is projected to reach USD 38.4 billion by 2035, registering a compound annual growth rate (CAGR) of 9.5% over the forecast period.

| Metric | Value |
|---|---|
| Multi Touch Sensing Market Estimated Value in (2025 E) | USD 15.6 billion |
| Multi Touch Sensing Market Forecast Value in (2035 F) | USD 38.4 billion |
| Forecast CAGR (2025 to 2035) | 9.5% |
The multi touch sensing market is witnessing steady expansion, underpinned by the growing integration of interactive interfaces across consumer electronics, automotive systems, and industrial devices. Industry reports and technology journals have emphasized the role of multi touch sensors in enhancing user experience through intuitive control, high responsiveness, and gesture-based navigation.
Advancements in capacitive and infrared touch sensing technologies have improved accuracy and durability, supporting adoption across high-usage devices. Increasing consumer demand for compact, lightweight, and multifunctional electronics has also stimulated sensor innovation, with manufacturers focusing on energy efficiency and seamless integration into flexible displays.
Furthermore, investor presentations and company announcements have highlighted the surge in R&D spending for next-generation interfaces such as foldable screens and augmented reality devices, further boosting market opportunities. With personal and professional devices becoming central to daily digital interactions, the future growth of the multi touch sensing market is expected to be shaped by expanding smartphone penetration, diversified personal applications, and the incorporation of multi touch features into emerging technologies like wearables and smart home devices.

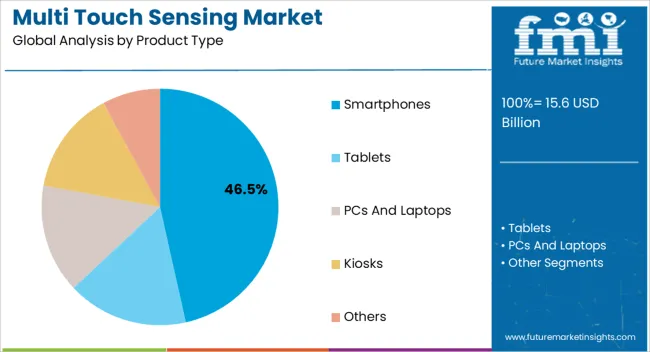
The Smartphones segment is projected to account for 46.50% of the multi touch sensing market revenue in 2025, sustaining its leadership position. This dominance has been reinforced by the ubiquity of smartphones globally and the reliance on touchscreens as the primary mode of interaction.
Continuous improvements in capacitive touch sensors, which enable multi-finger gestures, high-resolution touch accuracy, and long-term durability, have supported their adoption in flagship and mid-range smartphones. Leading consumer electronics brands have invested significantly in advancing display quality, integrating multi touch sensors into OLED and flexible displays.
Market dynamics have further favored smartphones as they represent the highest-volume consumer product requiring multi touch technology. Additionally, the replacement cycle of smartphones, coupled with strong consumer demand for immersive touch-based experiences in gaming, social media, and video streaming, has sustained growth. As foldable devices and 5G-enabled smartphones continue to scale, the Smartphones segment is expected to maintain a substantial share of the multi touch sensing market.

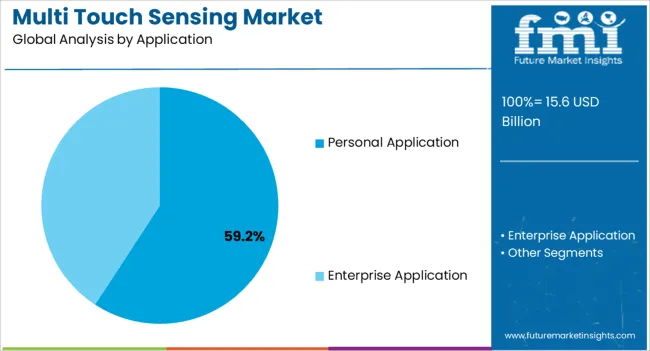
The Personal Application segment is projected to capture 59.20% of the multi touch sensing market revenue in 2025, making it the dominant application category. This segment’s growth has been supported by rising consumer dependence on digital devices for communication, entertainment, and lifestyle management.
Tablets, laptops, and wearable devices incorporating multi touch sensors have increasingly become integral to personal use, driven by demand for enhanced interactivity and seamless navigation. Technology company announcements and product releases have highlighted innovations such as pressure-sensitive touch and gesture recognition, which have enriched the personal user experience.
Furthermore, the surge in remote work, online education, and digital entertainment has reinforced the importance of multi touch functionality in daily life. The scalability of multi touch sensors across a range of personal devices has also widened accessibility for consumers across different income groups. With ongoing advances in touch-enabled interfaces and expanding integration into smart home ecosystems, the Personal Application segment is expected to remain the primary driver of demand in the multi touch sensing market.
As per the multi touch sensing market research by Future Market Insights - a market research and competitive intelligence provider, historically, from 2020 to 2025, the market value of the multi touch sensing market increased at around 7.8% CAGR. With an absolute dollar opportunity of USD 38.40 billion, the market is projected to reach a valuation of USD 33.22 billion by 2035.
In the multi-touch technology market, the increasing use of smart electronic displays, such as smartphones, tablets, and laptops, has created a surge in demand for the multi-touch sensing market. The potential for a flourishing market is heightening with the emphasis on multi-user displays, including vertical screens and touchscreen pads. Multiple users can collaborate and play together by leveraging these displays. The primary original equipment manufacturers are moving into developing countries because of inexpensive labor and inexpensive material sources. On the other hand, the high cost of touchscreen panels is limiting market growth.In the multi-touch technology market, the increasing use of smart electronic displays, such as smartphones, tablets, and laptops, has created a surge in demand for the multi-touch sensing market. The potential for a flourishing market is heightening with the emphasis on multi-user displays including vertical screens and touchscreen pads. Multiple users can collaborate and play together by leveraging these displays. The primary original equipment manufacturers are moving into developing countries because of inexpensive labour and inexpensive material sources. The high cost of touch screen panels, on the other hand, is limiting market growth.
Touchscreens and trackpads now have the technology to recognize the application of two or more contact points on the surface for advanced functions, such as launching applications, zooming in on screens, and rotating displays in laptops, smartphones, and tablets. Such developments and an increase in the number of corporate buyers aid market growth.
The multi-touch sensing market will be influenced by increasing prices and low supplies of indium tin oxide (ITO), a component required to manufacture touchscreen surfaces. The development of camp details, including multi-touch technology and video conferencing, publicity, retail offerings, and media applications, will drive the multi-touch sensing industry.
In developed regions like North America and Europe, the retail sector uses interactive multi-touch displays for customer engagement and branding strategies. In these markets, multi-touch technologies include interactive kiosks and table displays.
In modern touch enabled devices, Multitouch Sensors are considered to be the most important component. With the rise of low-cost smartphone manufacturers, the availability of low-cost smartphones has increased, boosting the growth of touch-enabled devices, which in turn accelerates the growth of the touch sensor market. DMC CO., LTD announced the release of the resistive touch screen series in March 2020. This was created with smartphones in mind.
Multi-Touch sensors are integrated with advanced computing and communication technologies in smart medical devices to monitor, collect, and transmit patient data for better diagnostics and treatment decisions. Smart devices, such as wearables, also share critical medical data in real-time, to physicians from hospital beds, private homes, and other locations. Therapeutic treatments, injury prevention, and rehabilitation are all common uses for smart medical devices. Furthermore, Covid-19 forced manufacturers to develop smart devices to track patient blood pressure, glucose levels, and other vital signs.
In 2024, Medtronic plc launched InPen, the first and only FDA-cleared smart insulin pen. InPen is integrated with real-time Guardian Connect CGM data to give patients real-time glucose readings and insulin dose information daily to help them manage their diabetes. Such developments can have a long-term impact on multi-touch sensing market growth.InPen, the first and only FDA-cleared smart insulin pen. InPen is integrated with real-time Guardian Connect CGM data to provide real-time glucose readings and insulin dose information to patients on a daily basis to help them manage their diabetes. Such developments can have a long-term impact on multi-touch sensing market growth.
The multi-touch sensing market has grown rapidly in Asia Pacific. Rapid urbanization has increased people's disposable income, allowing them to spend on new technologies.
Opportunities are opening up in the region as people become more aware of the Internet of Things and smart technologies become more widely adopted. The region's smartphone market has grown due to its high population and digitalization. Furthermore, this region is home to most key smartphone manufacturers, including Xiaomi, Panasonic, Samsung, Huawei, and One Plus.internet of things and smart technologies become more widely adopted. The region's smartphone market has grown as a result of its high population and digitalization. Furthermore, this region is home to most of the key smartphone manufacturers, including Xiaomi, Panasonic, Samsung, Huawei, and One Plus among others.
The United States is expected to account for the largest market share of USD 38.4 billion by the end of 2035. The demand for multi-touch sensors has increased across various industries in the United States, gaining traction in the USA market, especially in the automotive sector, to reduce the average weight of cars. Lightweight automobiles aid in both fuel efficiency and energy optimization.
Approximately 77% of Americans owned a smartphone until 2024, and 47% of smartphone users in the United States say they could not live without one. Such trends will be extremely beneficial to the multi-touch screen market in this region, as demand is expected to increase. of smartphone users in the United States say they could not live without one. Such trends will be extremely beneficial to the multi-touch screen market in this region, as demand is expected to increase in the future.
Multi Touch sensing applications through enterprise application is forecasted to develop at a CAGR of over 9% from 2025 to 2035. Multi-contact generation dominates the tech enterprise owing to its versatility and ingenuity. Multi-touch screens have drastically increased productiveness and efficiency.is forecasted to develop at a CAGR of over 9% through 2025 to 2035. Multi-contact generation dominates the tech enterprise owing to its versatility and ingenuity. Multi-touch screens have drastically increased productiveness and efficiency.
Multi-Touch touchscreen tables are being used in the institutions like bars and hotels. They are changing real human interplay or placing a person out of a job. Besides, there are several packages along with multi contact sensing video display units in huge enterprises, muti contact frames for assorted use & control panels.Multi-Touch touchscreen tables are being used in the institutions like bars and hotels. They are changing real human interplay or placing a person out of a job. Besides, there are several packages along with multi contact sensing video display units in huge enterprises, muti contact frames for assorted use & control panels.
The smartphone segment is forecasted to grow at the highest CAGR of over 9% from 2025 to 2035. Increased sales of smartphones and personal computers, as well as a surge in digitalization, have created a potential market for multi-touch technology. Consumer electronics markets in various parts of the world are primarily driven by decreasing costs of high-end electronics products and a growing preference for adopting updated technology.9% during 2025 to 2035. Increased sales of smartphones and personal computers, as well as a surge in digitalization, have created a potential market for multi-touch technology. Consumer electronics markets in various parts of the world are primarily driven by decreasing costs of high-end electronics products and a growing preference for adopting updated technology.
Smartphone adoption is more than 70% of the total population in developed economies such as South Korea, Israel, the Netherlands, Sweden, the United States, the United Kingdom, Germany, Spain, Australia, and Japan.
Developing countries like India, China, and Brazil are expected to witness significant potential in the coming years. For instance, the capacitors on the iPhone are organized in a coordinate system. Its circuitry can detect changes at every grid point. In other words, when a point on the grid is touched, it generates its own signal, which is relayed to the iPhone's processor. This enables the phone to track the location and movement of multiple simultaneous touches. The previous touchscreen was removable, but the most recent model consolidated the touchscreen sensing and LCD display layers into one panel. It uses capacitive multi-touch technology.iPhone are organized in a coordinate system. Its circuitry can detect changes at every grid point. In other words, when a point on the grid is touched, it generates its own signal, which is then relayed to the iPhone's processor. This enables the phone to track the location and movement of multiple simultaneous touches. The previous touch screen was removable, but the most recent model consolidated the touch-screen sensing layer and LCD display layer into one single panel. It uses capacitive multi-touch technology.

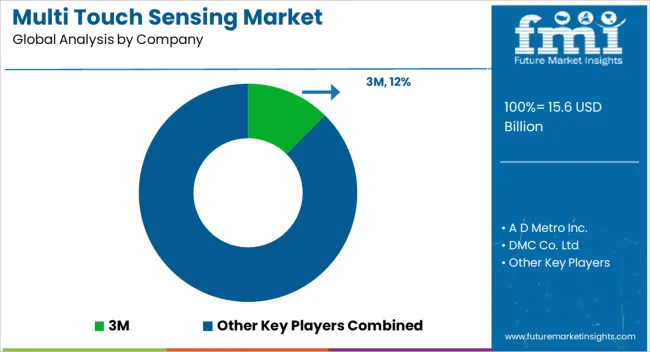
The multi-touch technology market is fragmented, with global and regional players such as 3M, A D Metro Inc., DMC Co. Ltd, Dongguan Cloud Top Electronic Technology Co. Ltd, Fujitsu Limited, and others. To gain a competitive edge in the market studied, a majority of these players are involved in several strategic developments, such as mergers, acquisitions, new product launches, and market expansion., Fujitsu Limited, and others. To gain a competitive edge in the market studied, a majority of these players are involved in several strategic developments, such as mergers, acquisitions, new product launches, and market expansion.
Some of the recent developments in the Global Multi Touch Market include the following:
The global multi touch sensing market is estimated to be valued at USD 15.6 billion in 2025.
The market size for the multi touch sensing market is projected to reach USD 38.4 billion by 2035.
The multi touch sensing market is expected to grow at a 9.5% CAGR between 2025 and 2035.
The key product types in multi touch sensing market are smartphones, tablets, pcs and laptops, kiosks and others.
In terms of application, personal application segment to command 59.2% share in the multi touch sensing market in 2025.


Full Research Suite comprises of:
Market outlook & trends analysis
Interviews & case studies
Strategic recommendations
Vendor profiles & capabilities analysis
5-year forecasts
8 regions and 60+ country-level data splits
Market segment data splits
12 months of continuous data updates
DELIVERED AS:
PDF EXCEL ONLINE
Multichannel Order Management Market Forecast and Outlook 2025 to 2035
Multiexperience Development Platform Market Forecast and Outlook 2025 to 2035
Multi Depth Corrugated Box Market Size and Share Forecast Outlook 2025 to 2035
Multilayer Flexible Packaging Market Size and Share Forecast Outlook 2025 to 2035
Multi Attachment Loaders Market Size and Share Forecast Outlook 2025 to 2035
Multi Pocket Holders Market Size and Share Forecast Outlook 2025 to 2035
Multi-Screen Super Glass Market Size and Share Forecast Outlook 2025 to 2035
Multichannel Reagent Reservoir Market Size and Share Forecast Outlook 2025 to 2035
Multi-Functional Point Of Care Testing Market Size and Share Forecast Outlook 2025 to 2035
Multi-layer Film Recycling Market Size and Share Forecast Outlook 2025 to 2035
Multifunctional Household Robot Market Size and Share Forecast Outlook 2025 to 2035
Multistage Ring Section Pumps Market Size and Share Forecast Outlook 2025 to 2035
Multi-photon Microscopic System Market Size and Share Forecast Outlook 2025 to 2035
Multi-axis Truss Robot Market Size and Share Forecast Outlook 2025 to 2035
Multi-Axis PCB Drilling Machine Market Size and Share Forecast Outlook 2025 to 2035
Multi-Modal Biometric Cabin Sensors Market Analysis - Size, Share, and Forecast Outlook 2025 to 2035
Multivitamin-Infused Skincare Market Analysis - Size, Share, and Forecast Outlook 2025 to 2035
Multiplex PCR Assays Market Size and Share Forecast Outlook 2025 to 2035
Multi-fulcrum Suspension Crane Market Size and Share Forecast Outlook 2025 to 2035
Multiparameter Patient Monitoring Systems Market Size and Share Forecast Outlook 2025 to 2035

Thank you!
You will receive an email from our Business Development Manager. Please be sure to check your SPAM/JUNK folder too.
Chat With
MaRIA