Multi-Parameter Patient Monitoring Market Size and Share Forecast Outlook 2025 to 2035

The global multi-parameter patient monitoring market is estimated to be valued at USD 5.1 billion in 2025 and is projected to reach USD 8.6 billion by 2035, registering a compound annual growth rate of 4.5% over the forecast period.

Quick Stats for Multi-Parameter Patient Monitoring Market

  • Industry Value (2025): USD 5.1 Billion
  • Forecast Value (2035): USD 8.6 Billion
  • Forecast CAGR: 4.5%
  • Leading Segment in 2025 (Acuity Level): High Acuity Level (52.4% share)
  • Key Growth Regions: North America, Asia-Pacific (China, India, Japan)
  • Top Key Players: Philips Healthcare, GE Healthcare, Siemens Healthineers, Medtronic, Abbott Laboratories, Mindray Medical International Limited
Metric Value
Market Size (2025E) USD 5.1 Billion
Market Value (2035F) USD 8.6 Billion
CAGR (2025 to 2035) 4.5%

The multi-parameter patient monitoring market is witnessing steady growth driven by the rising prevalence of chronic conditions, aging populations, and demand for continuous physiological monitoring across care settings.

Hospitals and ambulatory facilities are investing in integrated monitoring platforms that combine parameters such as ECG, SpO2, blood pressure, and respiratory rate to improve clinical decision-making and patient safety.

The expansion of high-acuity and step-down care units, coupled with the shift toward value-based care models, has accelerated adoption of advanced monitors capable of supporting early warning scores and predictive analytics. Manufacturers have prioritized connectivity and interoperability enhancements to integrate monitoring data with electronic health records and clinical information systems.

Analyzing Multi-Parameter Patient Monitoring Market by Top Investment Segments

High Acuity Monitors Dominate the Market Due to Increasing ICU Admissions and the Need for Advanced Parameter Tracking

Product Analysis: High Acuity Level Monitors
Multi Parameter Patient Monitoring Market Analysis By Acuity Level

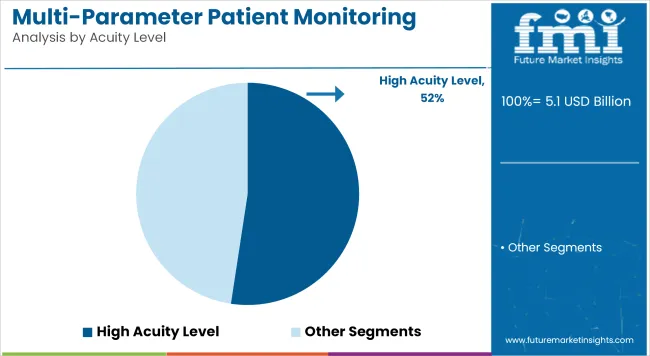
High Acuity Level Monitors dominated this segment with a revenue share of 52.4%. This reflects their key role in intensive and critical care environments. Demand has been driven by the rising incidence of sepsis, respiratory failure, and cardiac events requiring continuous, multi-parameter monitoring.

Hospitals have prioritized high-acuity systems capable of supporting advanced analytics, customizable alarms, and integration with centralized command centers. Regulatory mandates emphasizing patient safety and early deterioration detection have further reinforced investments in this segment.

Table top Monitors Lead Adoption Owing to Their Versatility, High Data Accuracy, and Integration with Central Monitoring Stations

Modality Analysis: Table top Multi-Parameter Monitors
Multi Parameter Patient Monitoring Market Analysis By Modality

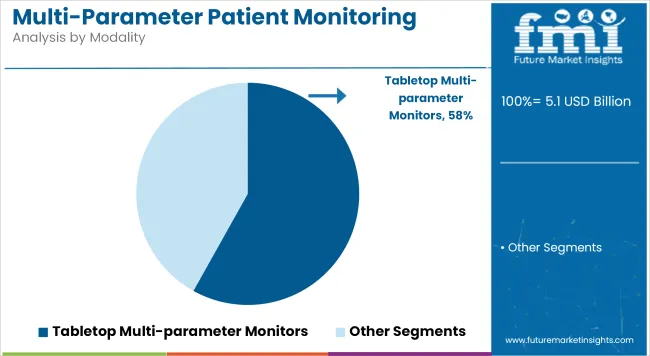
Table top Multi-Parameter Monitors is estimated to hold a revenue share of 58.1% which is attributed to their widespread utilization in both high-acuity and perioperative settings. Their adoption has been driven by the ability to track multiple parameters reliably while offering user-friendly interfaces and compatibility with hospital IT infrastructure.

Clinicians have favored tabletop monitors for their high-resolution displays, battery backup capabilities, and standardized workflows that facilitate timely interventions. The segment has also benefited from technological enhancements supporting data transmission, trend analysis, and integration with tele-ICU platforms.

Hospitals Remain the Primary End Users Due to High Patient Volumes, Critical Care Infrastructure, and Investments in Centralized Monitoring

End User Analysis: Hospitals

Multi Parameter Patient Monitoring Market Analysis By End User

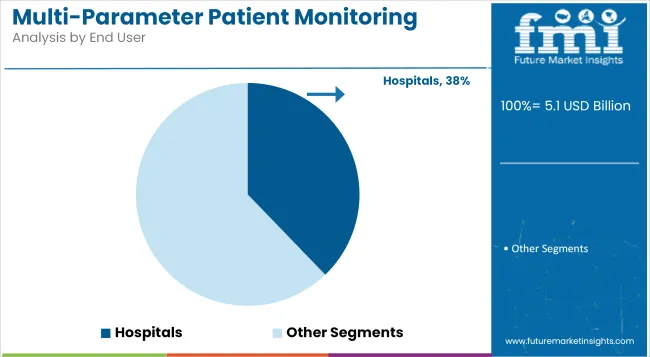
Hospitals accounts for a revenue share of 37.8%, highlighting their pivotal role in driving multi-parameter monitor procurement. This segment is reinforced by high patient throughput, complex case management needs, and the imperative to comply with safety and quality mandates.

Hospitals have consistently invested in centralized monitoring stations and interoperable systems to enable continuous surveillance and early intervention across critical and step-down care units. The increasing adoption of telemetry and remote monitoring capabilities has further strengthened hospital demand.

Challenges and Opportunities

Challenges

Cost and Complexity

The high cost of advanced and multi-parameter monitoring systems is one of the major hurdles facing the multi-parameter patient monitoring market. Smaller facilities may be financially incapable of acquiring such technologies. Integration of multiple monitoring systems and their data analysis introduce operational challenges in clinical settings.

Opportunities

Technological Advancements and Homecare

There are promising opportunities in user-friendlier, cheaper, and portable multi-parameter monitoring solutions, particularly for homecare and remote monitoring. As the health sector switches into home settings, the demand for personal patient monitoring devices that provide real-time data on various health parameters is likely to increase; the growth of cloud-based platforms, AI-based data analytics, and wearable technology is likely to be responsible for market growth through better patient care and improved healthcare outcomes.
Country-wise Insights

Multi Parameter Patient Monitoring Market Cagr Analysis By Country

United States

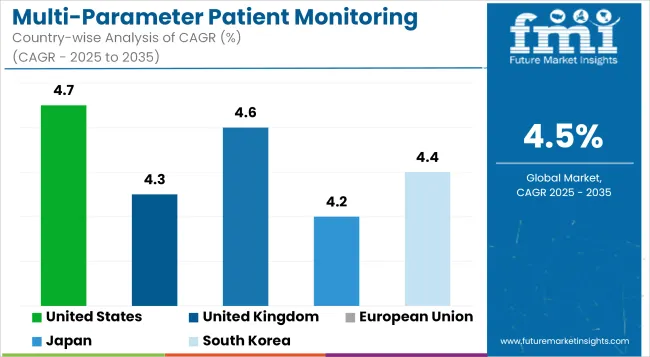
Chronic diseases lie in a key component of the multi-parameter patient monitoring market in the USA along with advancement in medical technology and an increasing aging population. These devices are being taken up by hospitals and healthcare systems for the betterment of patient care and the efficiency of hospital operations in monitoring vital signs at real-time. Rendition could be made for the USA as a leader among countries that offer excellent advancements in terms of patient monitoring set to progress beyond the bounds of wearables and wireless devices.

Country CAGR (2025 to 2035)
United States 4.7%

United Kingdom

United Kingdom’s multi-parameter patient monitoring is one of the countries benefiting from improved government programs in health infrastructure, especially in the NHS. Continuous patient monitoring is always on demand, especially in critical care and intensive care units (ICUs). Home care and telehealth have been emerging markets for the introduction of wearables, which further adds to their expansion.

Country CAGR (2025 to 2035)
United Kingdom 4.3%

European Union

In the European Union market, healthcare quality improvement and cost-cutting have gained increasing importance among the member states. There is an extensive use of Multi-parameter monitoring devices in hospitals and outpatient setups for ensuring patient safety and timely intervention. Wireless technology advances along with EHR integration are likely to increase the acceptance of these technologies within the EU.

Country CAGR (2025 to 2035)
European Union 4.6%

Japan

Multi-parameter patient monitoring devices in Japan can grow with the rapidly increasing number of seniors and growing incidences of lifestyle diseases. The Japan healthcare system has been known for automating healthcare processes and currently adopting innovative monitoring devices to upgrade patient care and lower the readmission rates. Besides, the government policies in Japan targeted to improve elderly care through advanced medical technologies have further enhanced market growth.

Country CAGR (2025 to 2035)
Japan 4.2%

South Korea

Progressively, the healthcare systems have been using advanced monitoring systems in hospitals and healthcare facilities in South Korea. The market for multi-parameter monitoring devices is therefore growing steadily due to the adoption of smart health solutions, such as wearable and remote monitoring systems. High-quality healthcare programs set forth by the government, coupled with an upsurge in demand for home healthcare solutions, spur the market even more.

Country CAGR (2025 to 2035)
South Korea 4.4%

Competition Outlook

Companies are investing in AI-driven algorithms to enable early detection of patient deterioration and reduce adverse events. Partnerships with hospital networks and health IT vendors are expanding interoperability and facilitating the development of comprehensive monitoring ecosystems. Additionally, training programs and service offerings are being scaled to support adoption and optimize clinical workflows.

Key Development

In 2024, Midmark Corp. has launched new Midmark Multiparameter Monitors for animal health. Designed with decades of clinical experience, these monitors offer integrated safety features and user-friendly capabilities to help veterinary teams navigate anesthetic procedures more efficiently, enhancing care delivery and safety.

In 2025, Cardinal Health has launched the Kendall DL™ Multi System in the USA This new multi-parameter, single-patient use monitoring system provides continuous monitoring of cardiac activity, blood oxygen, and temperature via one connection point. Designed for seamless patient transport from admission to discharge, it aims to enhance clinician workflows, ensure reliable monitoring for optimal care, and maximize hospital value.

Companies

  • Koninklijke Philips N.V.
  • Medtronic plc
  • Spacelabs Healthcare (OSI Systems, Inc.)
  • Nihon Kohden Corporation
  • Drägerwerk AG & Co. KGaA (Draeger, Inc.)
  • Masimo
  • Contec Medical Systems Co., Ltd.
  • General Meditech, Inc.
  • Mindray Medical International Limited
  • Schiller AG
  • GE Healthcare
  • Lepu Medical Technology(Beijing)Co.,Ltd
  • BPL Medical Technologies
  • Smith’s Medical (ICU Medical, Inc)
  • BLT Biolight (Guangdong Biolight Meditech Co., Ltd)
  • SternMed GmbH

Key segments

By Acuity Level:

  • High Acuity Level
  • Mid Acuity Level
  • Low Acuity Level

By Modality:

  • Handheld/Portable Multi-parameter Monitors
  • Tabletop Multi-parameter Monitors

By End User:

  • Hospitals
  • Ambulatory Surgical Centers
  • Specialty Clinics
  • Home Care Settings

By Region:

  • North America
  • Latin America
  • Europe
  • East Asia
  • South Asia & Pacific
  • The Middle East & Africa (MEA)

Table of Content

  1. Executive Summary
  2. Industry Introduction, including Taxonomy and Market Definition
  3. Market Trends and Success Factors, including Macro-economic Factors, Market Dynamics, and Recent Industry Developments
  4. Global Market Demand Analysis 2020 to 2024 and Forecast 2025 to 2035, including Historical Analysis and Future Projections
  5. Pricing Analysis
  6. Global Market Analysis 2020 to 2024 and Forecast 2025 to 2035
    • Acuity Level
    • Modality
    • End User
  7. Global Market Analysis 2020 to 2024 and Forecast 2025 to 2035, By Acuity Level
    • High Acuity Level
    • Mid Acuity Level
    • Low Acuity Level
  8. Global Market Analysis 2020 to 2024 and Forecast 2025 to 2035, By Modality
    • Handheld/Portable Multi-parameter Monitors
    • Tabletop Multi-parameter Monitors
  9. Global Market Analysis 2020 to 2024 and Forecast 2025 to 2035, By End User
    • Hospitals
    • Ambulatory Surgical Centers
    • Specialty Clinics
    • Home Care Settings
  10. Global Market Analysis 2020 to 2024 and Forecast 2025 to 2035, By Region
    • North America
    • Latin America
    • Western Europe
    • Eastern Europe
    • East Asia
    • South Asia Pacific
    • Middle East and Africa
  11. North America Sales Analysis 2020 to 2024 and Forecast 2025 to 2035, by Key Segments and Countries
  12. Latin America Sales Analysis 2020 to 2024 and Forecast 2025 to 2035, by Key Segments and Countries
  13. Western Europe Sales Analysis 2020 to 2024 and Forecast 2025 to 2035, by Key Segments and Countries
  14. Eastern Europe Sales Analysis 2020 to 2024 and Forecast 2025 to 2035, by Key Segments and Countries
  15. East Asia Sales Analysis 2020 to 2024 and Forecast 2025 to 2035, by Key Segments and Countries
  16. South Asia Pacific Sales Analysis 2020 to 2024 and Forecast 2025 to 2035, by Key Segments and Countries
  17. Middle East and Africa Sales Analysis 2020 to 2024 and Forecast 2025 to 2035, by Key Segments and Countries
  18. Sales Forecast 2025 to 2035 by Acuity Level, Modality, and End User for 30 Countries
  19. Competition Outlook, including Market Structure Analysis, Company Share Analysis by Key Players, and Competition Dashboard
  20. Company Profile
    • Koninklijke Philips N.V.
    • GE Healthcare
    • Drägerwerk AG & Co. KGaA
    • Medtronic plc
    • OSI Systems Inc.
    • Nihon Kohden Corporation
    • MASIMO
    • Contec Medical Systems Co. Ltd.
    • General Meditech Inc.
    • Mindray Medical International Limited

List of Tables

  • Table 1: Global Market Value (USD million) Forecast by Region, 2020 to 2035
  • Table 2: Global Market Volume (Units) Forecast by Region, 2020 to 2035
  • Table 3: Global Market Value (USD million) Forecast by Acuity Level, 2020 to 2035
  • Table 4: Global Market Volume (Units) Forecast by Acuity Level, 2020 to 2035
  • Table 5: Global Market Value (USD million) Forecast by Modality, 2020 to 2035
  • Table 6: Global Market Volume (Units) Forecast by Modality, 2020 to 2035
  • Table 7: Global Market Value (USD million) Forecast by End User, 2020 to 2035
  • Table 8: Global Market Volume (Units) Forecast by End User, 2020 to 2035
  • Table 9: North America Market Value (USD million) Forecast by Country, 2020 to 2035
  • Table 10: North America Market Volume (Units) Forecast by Country, 2020 to 2035
  • Table 11: North America Market Value (USD million) Forecast by Acuity Level, 2020 to 2035
  • Table 12: North America Market Volume (Units) Forecast by Acuity Level, 2020 to 2035
  • Table 13: North America Market Value (USD million) Forecast by Modality, 2020 to 2035
  • Table 14: North America Market Volume (Units) Forecast by Modality, 2020 to 2035
  • Table 15: North America Market Value (USD million) Forecast by End User, 2020 to 2035
  • Table 16: North America Market Volume (Units) Forecast by End User, 2020 to 2035
  • Table 17: Latin America Market Value (USD million) Forecast by Country, 2020 to 2035
  • Table 18: Latin America Market Volume (Units) Forecast by Country, 2020 to 2035
  • Table 19: Latin America Market Value (USD million) Forecast by Acuity Level, 2020 to 2035
  • Table 20: Latin America Market Volume (Units) Forecast by Acuity Level, 2020 to 2035
  • Table 21: Latin America Market Value (USD million) Forecast by Modality, 2020 to 2035
  • Table 22: Latin America Market Volume (Units) Forecast by Modality, 2020 to 2035
  • Table 23: Latin America Market Value (USD million) Forecast by End User, 2020 to 2035
  • Table 24: Latin America Market Volume (Units) Forecast by End User, 2020 to 2035
  • Table 25: Europe Market Value (USD million) Forecast by Country, 2020 to 2035
  • Table 26: Europe Market Volume (Units) Forecast by Country, 2020 to 2035
  • Table 27: Europe Market Value (USD million) Forecast by Acuity Level, 2020 to 2035
  • Table 28: Europe Market Volume (Units) Forecast by Acuity Level, 2020 to 2035
  • Table 29: Europe Market Value (USD million) Forecast by Modality, 2020 to 2035
  • Table 30: Europe Market Volume (Units) Forecast by Modality, 2020 to 2035
  • Table 31: Europe Market Value (USD million) Forecast by End User, 2020 to 2035
  • Table 32: Europe Market Volume (Units) Forecast by End User, 2020 to 2035
  • Table 33: East Asia Market Value (USD million) Forecast by Country, 2020 to 2035
  • Table 34: East Asia Market Volume (Units) Forecast by Country, 2020 to 2035
  • Table 35: East Asia Market Value (USD million) Forecast by Acuity Level, 2020 to 2035
  • Table 36: East Asia Market Volume (Units) Forecast by Acuity Level, 2020 to 2035
  • Table 37: East Asia Market Value (USD million) Forecast by Modality, 2020 to 2035
  • Table 38: East Asia Market Volume (Units) Forecast by Modality, 2020 to 2035
  • Table 39: East Asia Market Value (USD million) Forecast by End User, 2020 to 2035
  • Table 40: East Asia Market Volume (Units) Forecast by End User, 2020 to 2035
  • Table 41: South Asia Market Value (USD million) Forecast by Country, 2020 to 2035
  • Table 42: South Asia Market Volume (Units) Forecast by Country, 2020 to 2035
  • Table 43: South Asia Market Value (USD million) Forecast by Acuity Level, 2020 to 2035
  • Table 44: South Asia Market Volume (Units) Forecast by Acuity Level, 2020 to 2035
  • Table 45: South Asia Market Value (USD million) Forecast by Modality, 2020 to 2035
  • Table 46: South Asia Market Volume (Units) Forecast by Modality, 2020 to 2035
  • Table 47: South Asia Market Value (USD million) Forecast by End User, 2020 to 2035
  • Table 48: South Asia Market Volume (Units) Forecast by End User, 2020 to 2035
  • Table 49: Oceania Market Value (USD million) Forecast by Country, 2020 to 2035
  • Table 50: Oceania Market Volume (Units) Forecast by Country, 2020 to 2035
  • Table 51: Oceania Market Value (USD million) Forecast by Acuity Level, 2020 to 2035
  • Table 52: Oceania Market Volume (Units) Forecast by Acuity Level, 2020 to 2035
  • Table 53: Oceania Market Value (USD million) Forecast by Modality, 2020 to 2035
  • Table 54: Oceania Market Volume (Units) Forecast by Modality, 2020 to 2035
  • Table 55: Oceania Market Value (USD million) Forecast by End User, 2020 to 2035
  • Table 56: Oceania Market Volume (Units) Forecast by End User, 2020 to 2035
  • Table 57: MEA Market Value (USD million) Forecast by Country, 2020 to 2035
  • Table 58: MEA Market Volume (Units) Forecast by Country, 2020 to 2035
  • Table 59: MEA Market Value (USD million) Forecast by Acuity Level, 2020 to 2035
  • Table 60: MEA Market Volume (Units) Forecast by Acuity Level, 2020 to 2035
  • Table 61: MEA Market Value (USD million) Forecast by Modality, 2020 to 2035
  • Table 62: MEA Market Volume (Units) Forecast by Modality, 2020 to 2035
  • Table 63: MEA Market Value (USD million) Forecast by End User, 2020 to 2035
  • Table 64: MEA Market Volume (Units) Forecast by End User, 2020 to 2035

List of Figures

  • Figure 1: Global Market Value (USD million) by Acuity Level, 2025 to 2035
  • Figure 2: Global Market Value (USD million) by Modality, 2025 to 2035
  • Figure 3: Global Market Value (USD million) by End User, 2025 to 2035
  • Figure 4: Global Market Value (USD million) by Region, 2025 to 2035
  • Figure 5: Global Market Value (USD million) Analysis by Region, 2020 to 2035
  • Figure 6: Global Market Volume (Units) Analysis by Region, 2020 to 2035
  • Figure 7: Global Market Value Share (%) and BPS Analysis by Region, 2025 to 2035
  • Figure 8: Global Market Y-o-Y Growth (%) Projections by Region, 2025 to 2035
  • Figure 9: Global Market Value (USD million) Analysis by Acuity Level, 2020 to 2035
  • Figure 10: Global Market Volume (Units) Analysis by Acuity Level, 2020 to 2035
  • Figure 11: Global Market Value Share (%) and BPS Analysis by Acuity Level, 2025 to 2035
  • Figure 12: Global Market Y-o-Y Growth (%) Projections by Acuity Level, 2025 to 2035
  • Figure 13: Global Market Value (USD million) Analysis by Modality, 2020 to 2035
  • Figure 14: Global Market Volume (Units) Analysis by Modality, 2020 to 2035
  • Figure 15: Global Market Value Share (%) and BPS Analysis by Modality, 2025 to 2035
  • Figure 16: Global Market Y-o-Y Growth (%) Projections by Modality, 2025 to 2035
  • Figure 17: Global Market Value (USD million) Analysis by End User, 2020 to 2035
  • Figure 18: Global Market Volume (Units) Analysis by End User, 2020 to 2035
  • Figure 19: Global Market Value Share (%) and BPS Analysis by End User, 2025 to 2035
  • Figure 20: Global Market Y-o-Y Growth (%) Projections by End User, 2025 to 2035
  • Figure 21: Global Market Attractiveness by Acuity Level, 2025 to 2035
  • Figure 22: Global Market Attractiveness by Modality, 2025 to 2035
  • Figure 23: Global Market Attractiveness by End User, 2025 to 2035
  • Figure 24: Global Market Attractiveness by Region, 2025 to 2035
  • Figure 25: North America Market Value (USD million) by Acuity Level, 2025 to 2035
  • Figure 26: North America Market Value (USD million) by Modality, 2025 to 2035
  • Figure 27: North America Market Value (USD million) by End User, 2025 to 2035
  • Figure 28: North America Market Value (USD million) by Country, 2025 to 2035
  • Figure 29: North America Market Value (USD million) Analysis by Country, 2020 to 2035
  • Figure 30: North America Market Volume (Units) Analysis by Country, 2020 to 2035
  • Figure 31: North America Market Value Share (%) and BPS Analysis by Country, 2025 to 2035
  • Figure 32: North America Market Y-o-Y Growth (%) Projections by Country, 2025 to 2035
  • Figure 33: North America Market Value (USD million) Analysis by Acuity Level, 2020 to 2035
  • Figure 34: North America Market Volume (Units) Analysis by Acuity Level, 2020 to 2035
  • Figure 35: North America Market Value Share (%) and BPS Analysis by Acuity Level, 2025 to 2035
  • Figure 36: North America Market Y-o-Y Growth (%) Projections by Acuity Level, 2025 to 2035
  • Figure 37: North America Market Value (USD million) Analysis by Modality, 2020 to 2035
  • Figure 38: North America Market Volume (Units) Analysis by Modality, 2020 to 2035
  • Figure 39: North America Market Value Share (%) and BPS Analysis by Modality, 2025 to 2035
  • Figure 40: North America Market Y-o-Y Growth (%) Projections by Modality, 2025 to 2035
  • Figure 41: North America Market Value (USD million) Analysis by End User, 2020 to 2035
  • Figure 42: North America Market Volume (Units) Analysis by End User, 2020 to 2035
  • Figure 43: North America Market Value Share (%) and BPS Analysis by End User, 2025 to 2035
  • Figure 44: North America Market Y-o-Y Growth (%) Projections by End User, 2025 to 2035
  • Figure 45: North America Market Attractiveness by Acuity Level, 2025 to 2035
  • Figure 46: North America Market Attractiveness by Modality, 2025 to 2035
  • Figure 47: North America Market Attractiveness by End User, 2025 to 2035
  • Figure 48: North America Market Attractiveness by Country, 2025 to 2035
  • Figure 49: Latin America Market Value (USD million) by Acuity Level, 2025 to 2035
  • Figure 50: Latin America Market Value (USD million) by Modality, 2025 to 2035
  • Figure 51: Latin America Market Value (USD million) by End User, 2025 to 2035
  • Figure 52: Latin America Market Value (USD million) by Country, 2025 to 2035
  • Figure 53: Latin America Market Value (USD million) Analysis by Country, 2020 to 2035
  • Figure 54: Latin America Market Volume (Units) Analysis by Country, 2020 to 2035
  • Figure 55: Latin America Market Value Share (%) and BPS Analysis by Country, 2025 to 2035
  • Figure 56: Latin America Market Y-o-Y Growth (%) Projections by Country, 2025 to 2035
  • Figure 57: Latin America Market Value (USD million) Analysis by Acuity Level, 2020 to 2035
  • Figure 58: Latin America Market Volume (Units) Analysis by Acuity Level, 2020 to 2035
  • Figure 59: Latin America Market Value Share (%) and BPS Analysis by Acuity Level, 2025 to 2035
  • Figure 60: Latin America Market Y-o-Y Growth (%) Projections by Acuity Level, 2025 to 2035
  • Figure 61: Latin America Market Value (USD million) Analysis by Modality, 2020 to 2035
  • Figure 62: Latin America Market Volume (Units) Analysis by Modality, 2020 to 2035
  • Figure 63: Latin America Market Value Share (%) and BPS Analysis by Modality, 2025 to 2035
  • Figure 64: Latin America Market Y-o-Y Growth (%) Projections by Modality, 2025 to 2035
  • Figure 65: Latin America Market Value (USD million) Analysis by End User, 2020 to 2035
  • Figure 66: Latin America Market Volume (Units) Analysis by End User, 2020 to 2035
  • Figure 67: Latin America Market Value Share (%) and BPS Analysis by End User, 2025 to 2035
  • Figure 68: Latin America Market Y-o-Y Growth (%) Projections by End User, 2025 to 2035
  • Figure 69: Latin America Market Attractiveness by Acuity Level, 2025 to 2035
  • Figure 70: Latin America Market Attractiveness by Modality, 2025 to 2035
  • Figure 71: Latin America Market Attractiveness by End User, 2025 to 2035
  • Figure 72: Latin America Market Attractiveness by Country, 2025 to 2035
  • Figure 73: Europe Market Value (USD million) by Acuity Level, 2025 to 2035
  • Figure 74: Europe Market Value (USD million) by Modality, 2025 to 2035
  • Figure 75: Europe Market Value (USD million) by End User, 2025 to 2035
  • Figure 76: Europe Market Value (USD million) by Country, 2025 to 2035
  • Figure 77: Europe Market Value (USD million) Analysis by Country, 2020 to 2035
  • Figure 78: Europe Market Volume (Units) Analysis by Country, 2020 to 2035
  • Figure 79: Europe Market Value Share (%) and BPS Analysis by Country, 2025 to 2035
  • Figure 80: Europe Market Y-o-Y Growth (%) Projections by Country, 2025 to 2035
  • Figure 81: Europe Market Value (USD million) Analysis by Acuity Level, 2020 to 2035
  • Figure 82: Europe Market Volume (Units) Analysis by Acuity Level, 2020 to 2035
  • Figure 83: Europe Market Value Share (%) and BPS Analysis by Acuity Level, 2025 to 2035
  • Figure 84: Europe Market Y-o-Y Growth (%) Projections by Acuity Level, 2025 to 2035
  • Figure 85: Europe Market Value (USD million) Analysis by Modality, 2020 to 2035
  • Figure 86: Europe Market Volume (Units) Analysis by Modality, 2020 to 2035
  • Figure 87: Europe Market Value Share (%) and BPS Analysis by Modality, 2025 to 2035
  • Figure 88: Europe Market Y-o-Y Growth (%) Projections by Modality, 2025 to 2035
  • Figure 89: Europe Market Value (USD million) Analysis by End User, 2020 to 2035
  • Figure 90: Europe Market Volume (Units) Analysis by End User, 2020 to 2035
  • Figure 91: Europe Market Value Share (%) and BPS Analysis by End User, 2025 to 2035
  • Figure 92: Europe Market Y-o-Y Growth (%) Projections by End User, 2025 to 2035
  • Figure 93: Europe Market Attractiveness by Acuity Level, 2025 to 2035
  • Figure 94: Europe Market Attractiveness by Modality, 2025 to 2035
  • Figure 95: Europe Market Attractiveness by End User, 2025 to 2035
  • Figure 96: Europe Market Attractiveness by Country, 2025 to 2035
  • Figure 97: East Asia Market Value (USD million) by Acuity Level, 2025 to 2035
  • Figure 98: East Asia Market Value (USD million) by Modality, 2025 to 2035
  • Figure 99: East Asia Market Value (USD million) by End User, 2025 to 2035
  • Figure 100: East Asia Market Value (USD million) by Country, 2025 to 2035
  • Figure 101: East Asia Market Value (USD million) Analysis by Country, 2020 to 2035
  • Figure 102: East Asia Market Volume (Units) Analysis by Country, 2020 to 2035
  • Figure 103: East Asia Market Value Share (%) and BPS Analysis by Country, 2025 to 2035
  • Figure 104: East Asia Market Y-o-Y Growth (%) Projections by Country, 2025 to 2035
  • Figure 105: East Asia Market Value (USD million) Analysis by Acuity Level, 2020 to 2035
  • Figure 106: East Asia Market Volume (Units) Analysis by Acuity Level, 2020 to 2035
  • Figure 107: East Asia Market Value Share (%) and BPS Analysis by Acuity Level, 2025 to 2035
  • Figure 108: East Asia Market Y-o-Y Growth (%) Projections by Acuity Level, 2025 to 2035
  • Figure 109: East Asia Market Value (USD million) Analysis by Modality, 2020 to 2035
  • Figure 110: East Asia Market Volume (Units) Analysis by Modality, 2020 to 2035
  • Figure 111: East Asia Market Value Share (%) and BPS Analysis by Modality, 2025 to 2035
  • Figure 112: East Asia Market Y-o-Y Growth (%) Projections by Modality, 2025 to 2035
  • Figure 113: East Asia Market Value (USD million) Analysis by End User, 2020 to 2035
  • Figure 114: East Asia Market Volume (Units) Analysis by End User, 2020 to 2035
  • Figure 115: East Asia Market Value Share (%) and BPS Analysis by End User, 2025 to 2035
  • Figure 116: East Asia Market Y-o-Y Growth (%) Projections by End User, 2025 to 2035
  • Figure 117: East Asia Market Attractiveness by Acuity Level, 2025 to 2035
  • Figure 118: East Asia Market Attractiveness by Modality, 2025 to 2035
  • Figure 119: East Asia Market Attractiveness by End User, 2025 to 2035
  • Figure 120: East Asia Market Attractiveness by Country, 2025 to 2035
  • Figure 121: South Asia Market Value (USD million) by Acuity Level, 2025 to 2035
  • Figure 122: South Asia Market Value (USD million) by Modality, 2025 to 2035
  • Figure 123: South Asia Market Value (USD million) by End User, 2025 to 2035
  • Figure 124: South Asia Market Value (USD million) by Country, 2025 to 2035
  • Figure 125: South Asia Market Value (USD million) Analysis by Country, 2020 to 2035
  • Figure 126: South Asia Market Volume (Units) Analysis by Country, 2020 to 2035
  • Figure 127: South Asia Market Value Share (%) and BPS Analysis by Country, 2025 to 2035
  • Figure 128: South Asia Market Y-o-Y Growth (%) Projections by Country, 2025 to 2035
  • Figure 129: South Asia Market Value (USD million) Analysis by Acuity Level, 2020 to 2035
  • Figure 130: South Asia Market Volume (Units) Analysis by Acuity Level, 2020 to 2035
  • Figure 131: South Asia Market Value Share (%) and BPS Analysis by Acuity Level, 2025 to 2035
  • Figure 132: South Asia Market Y-o-Y Growth (%) Projections by Acuity Level, 2025 to 2035
  • Figure 133: South Asia Market Value (USD million) Analysis by Modality, 2020 to 2035
  • Figure 134: South Asia Market Volume (Units) Analysis by Modality, 2020 to 2035
  • Figure 135: South Asia Market Value Share (%) and BPS Analysis by Modality, 2025 to 2035
  • Figure 136: South Asia Market Y-o-Y Growth (%) Projections by Modality, 2025 to 2035
  • Figure 137: South Asia Market Value (USD million) Analysis by End User, 2020 to 2035
  • Figure 138: South Asia Market Volume (Units) Analysis by End User, 2020 to 2035
  • Figure 139: South Asia Market Value Share (%) and BPS Analysis by End User, 2025 to 2035
  • Figure 140: South Asia Market Y-o-Y Growth (%) Projections by End User, 2025 to 2035
  • Figure 141: South Asia Market Attractiveness by Acuity Level, 2025 to 2035
  • Figure 142: South Asia Market Attractiveness by Modality, 2025 to 2035
  • Figure 143: South Asia Market Attractiveness by End User, 2025 to 2035
  • Figure 144: South Asia Market Attractiveness by Country, 2025 to 2035
  • Figure 145: Oceania Market Value (USD million) by Acuity Level, 2025 to 2035
  • Figure 146: Oceania Market Value (USD million) by Modality, 2025 to 2035
  • Figure 147: Oceania Market Value (USD million) by End User, 2025 to 2035
  • Figure 148: Oceania Market Value (USD million) by Country, 2025 to 2035
  • Figure 149: Oceania Market Value (USD million) Analysis by Country, 2020 to 2035
  • Figure 150: Oceania Market Volume (Units) Analysis by Country, 2020 to 2035
  • Figure 151: Oceania Market Value Share (%) and BPS Analysis by Country, 2025 to 2035
  • Figure 152: Oceania Market Y-o-Y Growth (%) Projections by Country, 2025 to 2035
  • Figure 153: Oceania Market Value (USD million) Analysis by Acuity Level, 2020 to 2035
  • Figure 154: Oceania Market Volume (Units) Analysis by Acuity Level, 2020 to 2035
  • Figure 155: Oceania Market Value Share (%) and BPS Analysis by Acuity Level, 2025 to 2035
  • Figure 156: Oceania Market Y-o-Y Growth (%) Projections by Acuity Level, 2025 to 2035
  • Figure 157: Oceania Market Value (USD million) Analysis by Modality, 2020 to 2035
  • Figure 158: Oceania Market Volume (Units) Analysis by Modality, 2020 to 2035
  • Figure 159: Oceania Market Value Share (%) and BPS Analysis by Modality, 2025 to 2035
  • Figure 160: Oceania Market Y-o-Y Growth (%) Projections by Modality, 2025 to 2035
  • Figure 161: Oceania Market Value (USD million) Analysis by End User, 2020 to 2035
  • Figure 162: Oceania Market Volume (Units) Analysis by End User, 2020 to 2035
  • Figure 163: Oceania Market Value Share (%) and BPS Analysis by End User, 2025 to 2035
  • Figure 164: Oceania Market Y-o-Y Growth (%) Projections by End User, 2025 to 2035
  • Figure 165: Oceania Market Attractiveness by Acuity Level, 2025 to 2035
  • Figure 166: Oceania Market Attractiveness by Modality, 2025 to 2035
  • Figure 167: Oceania Market Attractiveness by End User, 2025 to 2035
  • Figure 168: Oceania Market Attractiveness by Country, 2025 to 2035
  • Figure 169: MEA Market Value (USD million) by Acuity Level, 2025 to 2035
  • Figure 170: MEA Market Value (USD million) by Modality, 2025 to 2035
  • Figure 171: MEA Market Value (USD million) by End User, 2025 to 2035
  • Figure 172: MEA Market Value (USD million) by Country, 2025 to 2035
  • Figure 173: MEA Market Value (USD million) Analysis by Country, 2020 to 2035
  • Figure 174: MEA Market Volume (Units) Analysis by Country, 2020 to 2035
  • Figure 175: MEA Market Value Share (%) and BPS Analysis by Country, 2025 to 2035
  • Figure 176: MEA Market Y-o-Y Growth (%) Projections by Country, 2025 to 2035
  • Figure 177: MEA Market Value (USD million) Analysis by Acuity Level, 2020 to 2035
  • Figure 178: MEA Market Volume (Units) Analysis by Acuity Level, 2020 to 2035
  • Figure 179: MEA Market Value Share (%) and BPS Analysis by Acuity Level, 2025 to 2035
  • Figure 180: MEA Market Y-o-Y Growth (%) Projections by Acuity Level, 2025 to 2035
  • Figure 181: MEA Market Value (USD million) Analysis by Modality, 2020 to 2035
  • Figure 182: MEA Market Volume (Units) Analysis by Modality, 2020 to 2035
  • Figure 183: MEA Market Value Share (%) and BPS Analysis by Modality, 2025 to 2035
  • Figure 184: MEA Market Y-o-Y Growth (%) Projections by Modality, 2025 to 2035
  • Figure 185: MEA Market Value (USD million) Analysis by End User, 2020 to 2035
  • Figure 186: MEA Market Volume (Units) Analysis by End User, 2020 to 2035
  • Figure 187: MEA Market Value Share (%) and BPS Analysis by End User, 2025 to 2035
  • Figure 188: MEA Market Y-o-Y Growth (%) Projections by End User, 2025 to 2035
  • Figure 189: MEA Market Attractiveness by Acuity Level, 2025 to 2035
  • Figure 190: MEA Market Attractiveness by Modality, 2025 to 2035
  • Figure 191: MEA Market Attractiveness by End User, 2025 to 2035
  • Figure 192: MEA Market Attractiveness by Country, 2025 to 2035

Frequently Asked Questions

What was the overall size of the multi-parameter patient monitoring market in 2025?

The overall market size for the multi-parameter patient monitoring market was USD 5.1 billion in 2025.

How big is the multi-parameter patient monitoring market expected to be in 2035?

The market is expected to reach USD 8.6 billion in 2035.

What will drive the demand for the multi-parameter patient monitoring market during the forecast period?

The demand will be driven by the increasing aging population, rising chronic disease prevalence, the need for continuous patient monitoring, and technological advancements in healthcare monitoring systems.

List the top 5 countries contributing to the multi-parameter patient monitoring market.

The top 5 contributing countries are the United States, Germany, Japan, the United Kingdom, and France.

Which segment in type is expected to lead the multi-parameter patient monitoring market?

The vital sign monitoring segment is expected to lead, driven by its wide applications in critical care settings and the demand for continuous monitoring.

Explore Similar Insights

Future Market Insights

Multi-Parameter Patient Monitoring Market