Multi-Head Filling Machines Market Size and Share Forecast Outlook 2025 to 2035

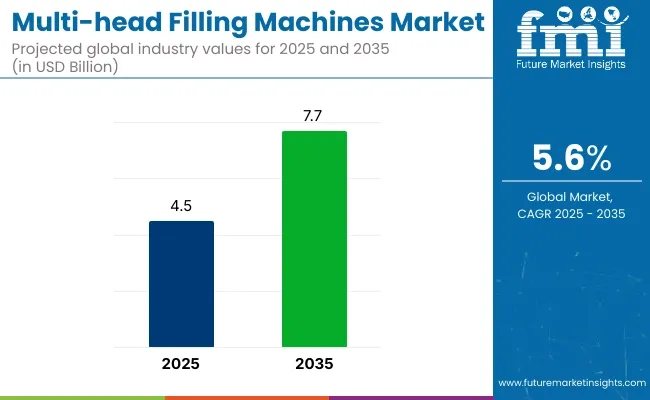
The multi-head filling machines market is projected to expand from USD 4.5 billion in 2025 to USD 7.7 billion by 2035, registering a CAGR of 5.6% over the forecast period. Sales in 2024 reached USD 4.2 billion, underscoring the sector's resilience and growing demand across food and beverage, pharmaceutical, and cosmetics industries. This growth is attributed to the increasing need for high-speed, precision-driven, and automated filling solutions that enhance production efficiency and meet stringent quality standards.
Multi Head Filling Machines Market

Metric Value
Market Size in 2025 USD 4.5 Billion
Projected Market Size in 2035 USD 7.7 Billion
CAGR (2025 to 2035) 5.6%

Multi-head filling machines are predominantly utilized for their ability to handle a diverse range of products, including liquids, pastes, powders, and granular materials. KHS expands its service portfolio in November 2024 with reliable filling of lightweight cans. In order to meet the growing demands of the beverage industry, KHS is continuously further modernizing its service solutions.

The latest option addresses the challenges of filling thin-walled cans and maintains a high level of efficiency in line and machine operation. Since the spring KHS has been successfully testing its new conversion kits for lightweight cans with various customers - and the feedback is extremely positive. “Our tests confirm the efficiency and durability generated by this conversion,” Andreas Krieg says KHS’ wet section technical support department says. Based on these results, KHS’ new retrofit is officially available with immediate effect.

The shift towards sustainable and efficient manufacturing practices is influencing the multi-head filling machines market. Manufacturers are focusing on developing machines that are energy-efficient, reduce material wastage, and are compatible with recyclable packaging materials. Innovations include the integration of IoT-enabled monitoring, smart dispensing controls, and predictive maintenance solutions to enhance production efficiency and operational reliability. These advancements align with global sustainability goals and regulatory requirements, making multi-head filling machines an attractive option for environmentally conscious businesses.

The multi-head filling machines market is poised for significant growth, driven by increasing demand in food & beverage, pharmaceutical, and personal care industries. Companies investing in automation, sustainable materials, and innovative designs are expected to gain a competitive edge. As global supply chains expand and environmental regulations become more stringent, the adoption of multi-head filling machines is anticipated to rise, offering cost-effective and eco-friendly packaging solutions.

Analyzing Multi-Head Filling Machines Market by Top Investment Segments

Liquid Filling Machines Dominate with Broad Industry Adoption and Versatile Application

Liquid filling machines are projected to lead the product type segment of the multi-head filling machines market with an estimated 36.7% market share by 2025, supported by their widespread use in food & beverage, pharmaceuticals, cosmetics, and chemical industries. These machines are engineered to handle a range of viscosities from water-thin liquids to thicker syrups offering precise and hygienic dispensing for mass production.

Multi-head configurations enhance speed and throughput by simultaneously filling multiple containers, significantly reducing cycle times for high-volume lines. Liquid filling machines also support various dosing mechanisms, including gravity, piston, and servo-controlled fillers, which accommodate both free-flowing and semi-viscous products.

Advancements in clean-in-place (CIP) systems, anti-drip nozzles, and tool-less changeovers are increasing demand in regulated sectors where hygiene and efficiency are critical. Additionally, automation and IoT integration are enabling real-time monitoring of fill levels, accuracy, and machine health-boosting productivity and compliance.

With e-commerce and private-label manufacturing driving demand for smaller SKUs and quick-change production lines, liquid multi-head fillers offer unmatched flexibility and performance. Their dominance is further reinforced by their compatibility with PET, glass, and pouch formats, making them a cornerstone of modern liquid packaging operations.

Food & Beverage Sector Leads Liquid Filling Machine Demand as Automation and Hygiene Standards Drive Equipment Uptake

By end-use industry, the food & beverage sector is projected to account for nearly 46.3% of the total demand for liquid filling machines by 2025, making it the dominant segment. This is due to the rising global consumption of bottled water, juices, dairy products, sauces, edible oils, and alcoholic beverages-all of which require efficient, contamination-free, and high-speed filling solutions.

The growing emphasis on hygiene, product consistency, and extended shelf life has encouraged food and beverage manufacturers to adopt multi-head liquid filling machines that offer precision dosing, high throughput, and compliance with global food safety standards. Machines equipped with clean-in-place (CIP) systems and stainless-steel contact parts have become standard in dairy, soft drinks, and ready-to-eat liquid food packaging facilities.
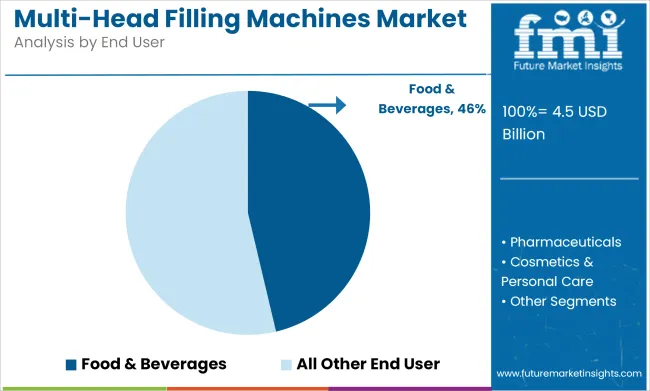
Multi Head Filling Machines Market Analysis By End User

Also the industry is witnessing a shift toward flexible packaging formats such as pouches, cartons, and PET bottles, requiring adaptable filling machines capable of handling a variety of container types and sizes. To meet fluctuating demand and reduce operational downtime, leading producers are investing in machines with quick changeover capabilities and automated control systems, including vision-based quality inspection and servo-driven filler heads.

The surge in demand for sustainable and functional beverages-such as plant-based drinks, nutritional shakes, and reduced-sugar formulations is also contributing to the increasing adoption of advanced filling lines that ensure consistent quality and efficient production. Consequently, the food & beverage industry will continue to remain the largest and fastest-evolving user of liquid filling machines throughout the forecast period.

Challenges and Opportunities in the Multi-Head Filling Machines Market

Challenges

  • Regulatory compliance and hygiene requirements: Meeting stringent global standards for food and pharmaceutical packaging safety requires continuous innovation in filling technologies.
  • High initial investment costs: The integration of AI, robotics, and smart sensors in multi-head filling machines leads to increased capital expenditure, impacting small and mid-sized manufacturers.

Opportunities

  • Expansion in automated, AI-driven filling machines: Growing demand for high-speed, precision-driven filling lines presents significant opportunities for manufacturers.
  • Advancements in IoT-enabled predictive maintenance and clean filling technologies: Increasing research in self-adjusting filling systems, automated defect detection, and remote monitoring is expected to drive market growth.

Country-wise Outlook

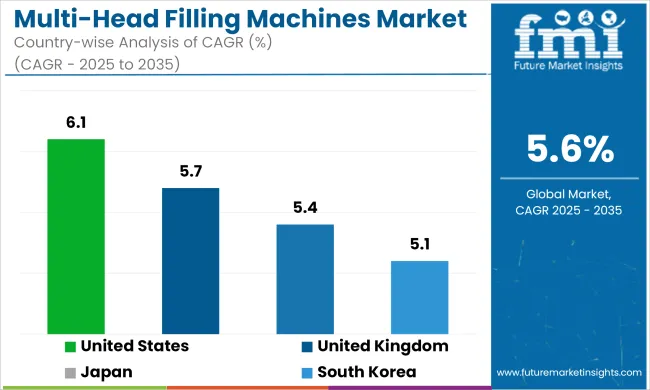
Multi Head Filling Machines Market Cagr Analysis By Country

United States

The USA dominates the multi-head filling machines market due to increasing demand for high-speed, accurate, and automated filling solutions across industries such as food & beverages, pharmaceuticals, and cosmetics. The shift toward production efficiency, coupled with stringent FDA regulations on packaging hygiene and accuracy, is driving innovation in multi-head filling machines with advanced sensors, servo-driven technology, and real-time monitoring capabilities.

Companies are investing in AI-powered filling automation, IoT-integrated monitoring systems, and high-precision dosing mechanisms to enhance productivity, reduce material waste, and ensure regulatory compliance. Additionally, sustainability initiatives promoting reduced packaging waste and energy-efficient machinery are encouraging manufacturers to develop eco-friendly multi-head filling solutions with intelligent control systems.

Country CAGR (2025 to 2035)
United States 6.1%

United Kingdom

The UK multi-head filling machines market is expanding steadily as businesses prioritize automation, sustainability, and compliance with strict regulatory frameworks such as the UK Food Standards Agency and GMP (Good Manufacturing Practices). The increasing need for precise dosing, minimal waste, and quick-changeover functionalities is driving demand for intelligent, servo-controlled multi-head fillers.

Companies are adopting AI-driven weight-based filling technology, volumetric dosing, and digital twin simulations to optimize production efficiency. Additionally, innovations in clean-in-place (CIP) and hygienic filling technologies are enhancing machine reliability and reducing downtime. The rise of flexible and modular filling systems that cater to small and large-scale production is further strengthening the UK market for multi-head filling machines.

Country CAGR (2025 to 2035)
United Kingdom 5.7%

Japan

Japan’s multi-head filling machines market is witnessing steady growth, driven by the country’s high standards in automation, precision engineering, and technological advancements in robotics. The demand for compact, efficient, and energy-saving filling machines in the pharmaceutical, personal care, and beverage industries is fostering innovation. Companies are developing high-speed multi-head fillers with AI-powered defect detection, ultra-precise flow control, and intelligent dosing algorithms to improve product consistency and reduce wastage.

Additionally, Japan’s emphasis on hygiene and sustainability is pushing manufacturers to integrate advanced sterilization techniques, automated weight-checking systems, and non-contact filling technologies into multi-head filling machines. The transition towards smart factories and digitalized production lines is further accelerating the adoption of intelligent filling solutions.

Country CAGR (2025 to 2035)
Japan 5.4%

South Korea

South Korea’s multi-head filling machines market is growing rapidly due to the increasing demand for fast, accurate, and automated filling systems in the food processing, pharmaceutical, and industrial chemicals sectors. Government policies supporting advanced manufacturing, Industry 4.0, and sustainability initiatives are driving investments in next-generation multi-head filling equipment.

Companies are focusing on hybrid servo-driven fillers, automated viscosity control, and real-time production analytics to enhance operational efficiency. Additionally, advancements in intelligent control systems, smart sensors, and blockchain-based quality tracking are optimizing machine performance and regulatory compliance. The growing shift toward high-speed, low-maintenance, and multi-format filling machines is further strengthening the South Korean market.

Country CAGR (2025 to 2035)
South Korea 5.1%

Competitive Outlook

The multi-head filling machines market is influenced by rising demand in food & beverage, pharmaceuticals, cosmetics, and industrial packaging. The market is witnessing innovation through new smart filling technologies, such as real-time volume adjustment, IoT-enabled performance monitoring, and AI-powered defect detection, addressing concerns about efficiency, waste reduction, and compliance with stringent regulatory standards.

Additionally, advancements in servo-driven filling nozzles and automated weight calibration systems are further shaping industry trends. The rising preference for energy-efficient, high-speed, and precision-based multi-head filling solutions is also contributing to market growth. Furthermore, increased investments in automated quality control, lean manufacturing practices, and AI-integrated process optimization are improving product efficiency and expanding market opportunities.

Companies are also exploring hybrid filling solutions that integrate volumetric and gravimetric dosing technologies for enhanced usability. Additionally, collaborations between filling machine manufacturers and industry-specific solution providers are driving the development of customized multi-head filling solutions tailored to diverse industry needs.
Key Company Insights

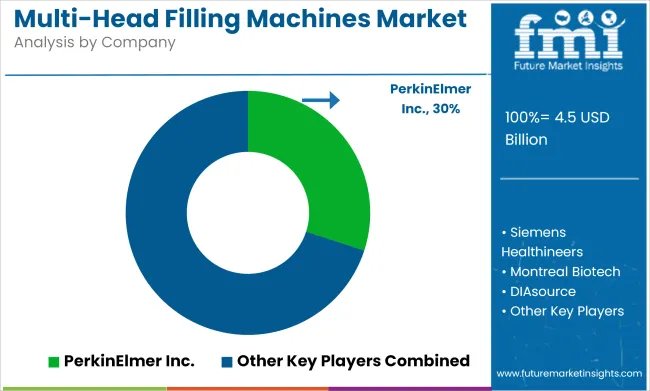
Multi Head Filling Machines Market Analysis By Company

Krones AG (12-16%)

Krones leads in high-performance multi-head filling machines, emphasizing sustainability and innovation in automated filling solutions.

Tetra Pak (8-12%)

Tetra Pak is a dominant player, offering aseptic, precision-based multi-head filling solutions for food, beverage, and dairy industries.

Syntegon Technology GmbH (6-10%)

Syntegon enhances its portfolio with AI-driven, high-speed multi-head filling systems optimized for pharmaceutical and personal care products.

Ronchi Mario S.p.A. (4-8%)

Ronchi strengthens its market presence with sustainable, energy-efficient multi-head filling machines tailored for cosmetics and household products.

Accutek Packaging Equipment Companies (3-7%)

Accutek focuses on innovative, cost-effective multi-head filling machines with IoT-enabled remote diagnostics and smart automation.

Other Key Players (45-55% Combined)

Several specialty multi-head filling machine manufacturers contribute to the expanding market. These include:

  • Serac Group: Develops high-speed, AI-powered multi-head filling solutions with enhanced quality control for food and pharmaceutical packaging.
  • Coesia S.p.A.: Specializes in precision-based volumetric filling systems with automated cleaning and predictive maintenance capabilities.
  • GEA Group: Produces hygienic, high-performance multi-head filling machines optimized for dairy, beverages, and pharmaceutical products.
  • KHS GmbH: Focuses on energy-efficient, AI-integrated multi-head filling systems designed for high-speed beverage and liquid filling applications.
  • AMS Filling Systems: Innovates with multi-head powder filling solutions, integrating precision-based volumetric and gravimetric dosing technologies.

Multi-Head Filling Machines Market Segmentation

By Product Type:

  • Liquid Filling Machines
  • Paste Filling Machines
  • Powder Filling Machines
  • Granular Filling Machines

By Filler Type:

  • Volumetric Filler
  • Weigh Filler
  • Vacuum Filler
  • Piston Filler
  • Spray Filler
  • Others

By Automation Type:

  • Fully Automatic
  • Semi-Automatic

By End-Use Industry:

  • Food & Beverages
  • Pharmaceuticals
  • Cosmetics & Personal Care
  • Chemicals &Lubricants
  • Others

By Region:

  • North America
  • Latin America
  • East Asia
  • South Asia & Pacific
  • Eastern Europe
  • Western Europe
  • Middle East & Africa

Table of Content

  1. Executive Summary
  2. Industry Introduction, including Taxonomy and Market Definition
  3. Market Trends and Success Factors, including Macro-economic Factors, Market Dynamics, and Recent Industry Developments
  4. Global Market Demand Analysis 2020 to 2024 and Forecast 2025 to 2035, including Historical Analysis and Future Projections
  5. Global Market Analysis 2020 to 2024 and Forecast 2025 to 2035
    • By Product
    • By Filler
    • By Automation
    • By End Use
  6. Global Market Analysis 2020 to 2024 and Forecast 2025 to 2035, By Product
    • Liquid Filling Machines
    • Paste Filling Machines
    • Powder Filling Machines
    • Granular Filling Machines
  7. Global Market Analysis 2020 to 2024 and Forecast 2025 to 2035, By Filler Type
    • Volumetric Filler
    • Weigh Filler
    • Vacuum Filler
    • Piston Filler
    • Spray Filler
    • Others
  8. Global Market Analysis 2020 to 2024 and Forecast 2025 to 2035, By Automation Type
    • Fully Automatic
    • Semi-Automatic
  9. Global Market Analysis 2020 to 2024 and Forecast 2025 to 2035, By End Use Industry
    • Food & Beverages
    • Pharmaceuticals
    • Cosmetics & Personal Care
    • Chemicals &Lubricants
    • Others
  10. Global Market Analysis 2020 to 2024 and Forecast 2025 to 2035, By Region
    • North America
    • Latin America
    • East Asia
    • South Asia & Pacific
    • Eastern Europe
    • Western Europe
    • Middle East & Africa
  11. North America Sales Analysis 2020 to 2024 and Forecast 2025 to 2035, by Key Segments and Countries
  12. Latin America Sales Analysis 2020 to 2024 and Forecast 2025 to 2035, by Key Segments and Countries
  13. East Asia Sales Analysis 2020 to 2024 and Forecast 2025 to 2035, by Key Segments and Countries
  14. South Asia & Pacific Sales Analysis 2020 to 2024 and Forecast 2025 to 2035, by Key Segments and Countries
  15. Eastern Europe Sales Analysis 2020 to 2024 and Forecast 2025 to 2035, by Key Segments and Countries
  16. Western Europe Sales Analysis 2020 to 2024 and Forecast 2025 to 2035, by Key Segments and Countries
  17. Middle East & Africa Sales Analysis 2020 to 2024 and Forecast 2025 to 2035, by Key Segments and Countries
  18. Sales Forecast 2025 to 2035 by Product, Filler, and End Use for 30 Countries
  19. Competition Outlook, including Market Structure Analysis, Company Share Analysis by Key Players, and Competition Dashboard
  20. Company Profile
    • Krones AG
    • Tetra Pak
    • Syntegon Technology GmbH
    • Ronchi Mario S.p.A.
    • Accutek Packaging Equipment Companies
    • Serac Group
    • Coesia S.p.A.
    • GEA Group
    • KHS GmbH
    • AMS Filling Systems

List of Tables

  • Table 1: Global Market Value (US$ Million) Forecast by Region, 2020 to 2035
  • Table 2: Global Market Volume (Units) Forecast by Region, 2020 to 2035
  • Table 3: Global Market Value (US$ Million) Forecast by Product Type, 2020 to 2035
  • Table 4: Global Market Volume (Units) Forecast by Product Type, 2020 to 2035
  • Table 5: Global Market Value (US$ Million) Forecast by Filler Type, 2020 to 2035
  • Table 6: Global Market Volume (Units) Forecast by Filler Type, 2020 to 2035
  • Table 7: Global Market Value (US$ Million) Forecast by Automation Type, 2020 to 2035
  • Table 8: Global Market Volume (Units) Forecast by Automation Type, 2020 to 2035
  • Table 9: Global Market Value (US$ Million) Forecast by End Use, 2020 to 2035
  • Table 10: Global Market Volume (Units) Forecast by End Use, 2020 to 2035
  • Table 11: North America Market Value (US$ Million) Forecast by Country, 2020 to 2035
  • Table 12: North America Market Volume (Units) Forecast by Country, 2020 to 2035
  • Table 13: North America Market Value (US$ Million) Forecast by Product Type, 2020 to 2035
  • Table 14: North America Market Volume (Units) Forecast by Product Type, 2020 to 2035
  • Table 15: North America Market Value (US$ Million) Forecast by Filler Type, 2020 to 2035
  • Table 16: North America Market Volume (Units) Forecast by Filler Type, 2020 to 2035
  • Table 17: North America Market Value (US$ Million) Forecast by Automation Type, 2020 to 2035
  • Table 18: North America Market Volume (Units) Forecast by Automation Type, 2020 to 2035
  • Table 19: North America Market Value (US$ Million) Forecast by End Use, 2020 to 2035
  • Table 20: North America Market Volume (Units) Forecast by End Use, 2020 to 2035
  • Table 21: Latin America Market Value (US$ Million) Forecast by Country, 2020 to 2035
  • Table 22: Latin America Market Volume (Units) Forecast by Country, 2020 to 2035
  • Table 23: Latin America Market Value (US$ Million) Forecast by Product Type, 2020 to 2035
  • Table 24: Latin America Market Volume (Units) Forecast by Product Type, 2020 to 2035
  • Table 25: Latin America Market Value (US$ Million) Forecast by Filler Type, 2020 to 2035
  • Table 26: Latin America Market Volume (Units) Forecast by Filler Type, 2020 to 2035
  • Table 27: Latin America Market Value (US$ Million) Forecast by Automation Type, 2020 to 2035
  • Table 28: Latin America Market Volume (Units) Forecast by Automation Type, 2020 to 2035
  • Table 29: Latin America Market Value (US$ Million) Forecast by End Use, 2020 to 2035
  • Table 30: Latin America Market Volume (Units) Forecast by End Use, 2020 to 2035
  • Table 31: Western Europe Market Value (US$ Million) Forecast by Country, 2020 to 2035
  • Table 32: Western Europe Market Volume (Units) Forecast by Country, 2020 to 2035
  • Table 33: Western Europe Market Value (US$ Million) Forecast by Product Type, 2020 to 2035
  • Table 34: Western Europe Market Volume (Units) Forecast by Product Type, 2020 to 2035
  • Table 35: Western Europe Market Value (US$ Million) Forecast by Filler Type, 2020 to 2035
  • Table 36: Western Europe Market Volume (Units) Forecast by Filler Type, 2020 to 2035
  • Table 37: Western Europe Market Value (US$ Million) Forecast by Automation Type, 2020 to 2035
  • Table 38: Western Europe Market Volume (Units) Forecast by Automation Type, 2020 to 2035
  • Table 39: Western Europe Market Value (US$ Million) Forecast by End Use, 2020 to 2035
  • Table 40: Western Europe Market Volume (Units) Forecast by End Use, 2020 to 2035
  • Table 41: Eastern Europe Market Value (US$ Million) Forecast by Country, 2020 to 2035
  • Table 42: Eastern Europe Market Volume (Units) Forecast by Country, 2020 to 2035
  • Table 43: Eastern Europe Market Value (US$ Million) Forecast by Product Type, 2020 to 2035
  • Table 44: Eastern Europe Market Volume (Units) Forecast by Product Type, 2020 to 2035
  • Table 45: Eastern Europe Market Value (US$ Million) Forecast by Filler Type, 2020 to 2035
  • Table 46: Eastern Europe Market Volume (Units) Forecast by Filler Type, 2020 to 2035
  • Table 47: Eastern Europe Market Value (US$ Million) Forecast by Automation Type, 2020 to 2035
  • Table 48: Eastern Europe Market Volume (Units) Forecast by Automation Type, 2020 to 2035
  • Table 49: Eastern Europe Market Value (US$ Million) Forecast by End Use, 2020 to 2035
  • Table 50: Eastern Europe Market Volume (Units) Forecast by End Use, 2020 to 2035
  • Table 51: South Asia and Pacific Market Value (US$ Million) Forecast by Country, 2020 to 2035
  • Table 52: South Asia and Pacific Market Volume (Units) Forecast by Country, 2020 to 2035
  • Table 53: South Asia and Pacific Market Value (US$ Million) Forecast by Product Type, 2020 to 2035
  • Table 54: South Asia and Pacific Market Volume (Units) Forecast by Product Type, 2020 to 2035
  • Table 55: South Asia and Pacific Market Value (US$ Million) Forecast by Filler Type, 2020 to 2035
  • Table 56: South Asia and Pacific Market Volume (Units) Forecast by Filler Type, 2020 to 2035
  • Table 57: South Asia and Pacific Market Value (US$ Million) Forecast by Automation Type, 2020 to 2035
  • Table 58: South Asia and Pacific Market Volume (Units) Forecast by Automation Type, 2020 to 2035
  • Table 59: South Asia and Pacific Market Value (US$ Million) Forecast by End Use, 2020 to 2035
  • Table 60: South Asia and Pacific Market Volume (Units) Forecast by End Use, 2020 to 2035
  • Table 61: East Asia Market Value (US$ Million) Forecast by Country, 2020 to 2035
  • Table 62: East Asia Market Volume (Units) Forecast by Country, 2020 to 2035
  • Table 63: East Asia Market Value (US$ Million) Forecast by Product Type, 2020 to 2035
  • Table 64: East Asia Market Volume (Units) Forecast by Product Type, 2020 to 2035
  • Table 65: East Asia Market Value (US$ Million) Forecast by Filler Type, 2020 to 2035
  • Table 66: East Asia Market Volume (Units) Forecast by Filler Type, 2020 to 2035
  • Table 67: East Asia Market Value (US$ Million) Forecast by Automation Type, 2020 to 2035
  • Table 68: East Asia Market Volume (Units) Forecast by Automation Type, 2020 to 2035
  • Table 69: East Asia Market Value (US$ Million) Forecast by End Use, 2020 to 2035
  • Table 70: East Asia Market Volume (Units) Forecast by End Use, 2020 to 2035
  • Table 71: Middle East and Africa Market Value (US$ Million) Forecast by Country, 2020 to 2035
  • Table 72: Middle East and Africa Market Volume (Units) Forecast by Country, 2020 to 2035
  • Table 73: Middle East and Africa Market Value (US$ Million) Forecast by Product Type, 2020 to 2035
  • Table 74: Middle East and Africa Market Volume (Units) Forecast by Product Type, 2020 to 2035
  • Table 75: Middle East and Africa Market Value (US$ Million) Forecast by Filler Type, 2020 to 2035
  • Table 76: Middle East and Africa Market Volume (Units) Forecast by Filler Type, 2020 to 2035
  • Table 77: Middle East and Africa Market Value (US$ Million) Forecast by Automation Type, 2020 to 2035
  • Table 78: Middle East and Africa Market Volume (Units) Forecast by Automation Type, 2020 to 2035
  • Table 79: Middle East and Africa Market Value (US$ Million) Forecast by End Use, 2020 to 2035
  • Table 80: Middle East and Africa Market Volume (Units) Forecast by End Use, 2020 to 2035

List of Figures

  • Figure 1: Global Market Value (US$ Million) by Product Type, 2025 to 2035
  • Figure 2: Global Market Value (US$ Million) by Filler Type, 2025 to 2035
  • Figure 3: Global Market Value (US$ Million) by Automation Type, 2025 to 2035
  • Figure 4: Global Market Value (US$ Million) by End Use, 2025 to 2035
  • Figure 5: Global Market Value (US$ Million) by Region, 2025 to 2035
  • Figure 6: Global Market Value (US$ Million) Analysis by Region, 2020 to 2035
  • Figure 7: Global Market Volume (Units) Analysis by Region, 2020 to 2035
  • Figure 8: Global Market Value Share (%) and BPS Analysis by Region, 2025 to 2035
  • Figure 9: Global Market Y-o-Y Growth (%) Projections by Region, 2025 to 2035
  • Figure 10: Global Market Value (US$ Million) Analysis by Product Type, 2020 to 2035
  • Figure 11: Global Market Volume (Units) Analysis by Product Type, 2020 to 2035
  • Figure 12: Global Market Value Share (%) and BPS Analysis by Product Type, 2025 to 2035
  • Figure 13: Global Market Y-o-Y Growth (%) Projections by Product Type, 2025 to 2035
  • Figure 14: Global Market Value (US$ Million) Analysis by Filler Type, 2020 to 2035
  • Figure 15: Global Market Volume (Units) Analysis by Filler Type, 2020 to 2035
  • Figure 16: Global Market Value Share (%) and BPS Analysis by Filler Type, 2025 to 2035
  • Figure 17: Global Market Y-o-Y Growth (%) Projections by Filler Type, 2025 to 2035
  • Figure 18: Global Market Value (US$ Million) Analysis by Automation Type, 2020 to 2035
  • Figure 19: Global Market Volume (Units) Analysis by Automation Type, 2020 to 2035
  • Figure 20: Global Market Value Share (%) and BPS Analysis by Automation Type, 2025 to 2035
  • Figure 21: Global Market Y-o-Y Growth (%) Projections by Automation Type, 2025 to 2035
  • Figure 22: Global Market Value (US$ Million) Analysis by End Use, 2020 to 2035
  • Figure 23: Global Market Volume (Units) Analysis by End Use, 2020 to 2035
  • Figure 24: Global Market Value Share (%) and BPS Analysis by End Use, 2025 to 2035
  • Figure 25: Global Market Y-o-Y Growth (%) Projections by End Use, 2025 to 2035
  • Figure 26: Global Market Attractiveness by Product Type, 2025 to 2035
  • Figure 27: Global Market Attractiveness by Filler Type, 2025 to 2035
  • Figure 28: Global Market Attractiveness by Automation Type, 2025 to 2035
  • Figure 29: Global Market Attractiveness by End Use, 2025 to 2035
  • Figure 30: Global Market Attractiveness by Region, 2025 to 2035
  • Figure 31: North America Market Value (US$ Million) by Product Type, 2025 to 2035
  • Figure 32: North America Market Value (US$ Million) by Filler Type, 2025 to 2035
  • Figure 33: North America Market Value (US$ Million) by Automation Type, 2025 to 2035
  • Figure 34: North America Market Value (US$ Million) by End Use, 2025 to 2035
  • Figure 35: North America Market Value (US$ Million) by Country, 2025 to 2035
  • Figure 36: North America Market Value (US$ Million) Analysis by Country, 2020 to 2035
  • Figure 37: North America Market Volume (Units) Analysis by Country, 2020 to 2035
  • Figure 38: North America Market Value Share (%) and BPS Analysis by Country, 2025 to 2035
  • Figure 39: North America Market Y-o-Y Growth (%) Projections by Country, 2025 to 2035
  • Figure 40: North America Market Value (US$ Million) Analysis by Product Type, 2020 to 2035
  • Figure 41: North America Market Volume (Units) Analysis by Product Type, 2020 to 2035
  • Figure 42: North America Market Value Share (%) and BPS Analysis by Product Type, 2025 to 2035
  • Figure 43: North America Market Y-o-Y Growth (%) Projections by Product Type, 2025 to 2035
  • Figure 44: North America Market Value (US$ Million) Analysis by Filler Type, 2020 to 2035
  • Figure 45: North America Market Volume (Units) Analysis by Filler Type, 2020 to 2035
  • Figure 46: North America Market Value Share (%) and BPS Analysis by Filler Type, 2025 to 2035
  • Figure 47: North America Market Y-o-Y Growth (%) Projections by Filler Type, 2025 to 2035
  • Figure 48: North America Market Value (US$ Million) Analysis by Automation Type, 2020 to 2035
  • Figure 49: North America Market Volume (Units) Analysis by Automation Type, 2020 to 2035
  • Figure 50: North America Market Value Share (%) and BPS Analysis by Automation Type, 2025 to 2035
  • Figure 51: North America Market Y-o-Y Growth (%) Projections by Automation Type, 2025 to 2035
  • Figure 52: North America Market Value (US$ Million) Analysis by End Use, 2020 to 2035
  • Figure 53: North America Market Volume (Units) Analysis by End Use, 2020 to 2035
  • Figure 54: North America Market Value Share (%) and BPS Analysis by End Use, 2025 to 2035
  • Figure 55: North America Market Y-o-Y Growth (%) Projections by End Use, 2025 to 2035
  • Figure 56: North America Market Attractiveness by Product Type, 2025 to 2035
  • Figure 57: North America Market Attractiveness by Filler Type, 2025 to 2035
  • Figure 58: North America Market Attractiveness by Automation Type, 2025 to 2035
  • Figure 59: North America Market Attractiveness by End Use, 2025 to 2035
  • Figure 60: North America Market Attractiveness by Country, 2025 to 2035
  • Figure 61: Latin America Market Value (US$ Million) by Product Type, 2025 to 2035
  • Figure 62: Latin America Market Value (US$ Million) by Filler Type, 2025 to 2035
  • Figure 63: Latin America Market Value (US$ Million) by Automation Type, 2025 to 2035
  • Figure 64: Latin America Market Value (US$ Million) by End Use, 2025 to 2035
  • Figure 65: Latin America Market Value (US$ Million) by Country, 2025 to 2035
  • Figure 66: Latin America Market Value (US$ Million) Analysis by Country, 2020 to 2035
  • Figure 67: Latin America Market Volume (Units) Analysis by Country, 2020 to 2035
  • Figure 68: Latin America Market Value Share (%) and BPS Analysis by Country, 2025 to 2035
  • Figure 69: Latin America Market Y-o-Y Growth (%) Projections by Country, 2025 to 2035
  • Figure 70: Latin America Market Value (US$ Million) Analysis by Product Type, 2020 to 2035
  • Figure 71: Latin America Market Volume (Units) Analysis by Product Type, 2020 to 2035
  • Figure 72: Latin America Market Value Share (%) and BPS Analysis by Product Type, 2025 to 2035
  • Figure 73: Latin America Market Y-o-Y Growth (%) Projections by Product Type, 2025 to 2035
  • Figure 74: Latin America Market Value (US$ Million) Analysis by Filler Type, 2020 to 2035
  • Figure 75: Latin America Market Volume (Units) Analysis by Filler Type, 2020 to 2035
  • Figure 76: Latin America Market Value Share (%) and BPS Analysis by Filler Type, 2025 to 2035
  • Figure 77: Latin America Market Y-o-Y Growth (%) Projections by Filler Type, 2025 to 2035
  • Figure 78: Latin America Market Value (US$ Million) Analysis by Automation Type, 2020 to 2035
  • Figure 79: Latin America Market Volume (Units) Analysis by Automation Type, 2020 to 2035
  • Figure 80: Latin America Market Value Share (%) and BPS Analysis by Automation Type, 2025 to 2035
  • Figure 81: Latin America Market Y-o-Y Growth (%) Projections by Automation Type, 2025 to 2035
  • Figure 82: Latin America Market Value (US$ Million) Analysis by End Use, 2020 to 2035
  • Figure 83: Latin America Market Volume (Units) Analysis by End Use, 2020 to 2035
  • Figure 84: Latin America Market Value Share (%) and BPS Analysis by End Use, 2025 to 2035
  • Figure 85: Latin America Market Y-o-Y Growth (%) Projections by End Use, 2025 to 2035
  • Figure 86: Latin America Market Attractiveness by Product Type, 2025 to 2035
  • Figure 87: Latin America Market Attractiveness by Filler Type, 2025 to 2035
  • Figure 88: Latin America Market Attractiveness by Automation Type, 2025 to 2035
  • Figure 89: Latin America Market Attractiveness by End Use, 2025 to 2035
  • Figure 90: Latin America Market Attractiveness by Country, 2025 to 2035
  • Figure 91: Western Europe Market Value (US$ Million) by Product Type, 2025 to 2035
  • Figure 92: Western Europe Market Value (US$ Million) by Filler Type, 2025 to 2035
  • Figure 93: Western Europe Market Value (US$ Million) by Automation Type, 2025 to 2035
  • Figure 94: Western Europe Market Value (US$ Million) by End Use, 2025 to 2035
  • Figure 95: Western Europe Market Value (US$ Million) by Country, 2025 to 2035
  • Figure 96: Western Europe Market Value (US$ Million) Analysis by Country, 2020 to 2035
  • Figure 97: Western Europe Market Volume (Units) Analysis by Country, 2020 to 2035
  • Figure 98: Western Europe Market Value Share (%) and BPS Analysis by Country, 2025 to 2035
  • Figure 99: Western Europe Market Y-o-Y Growth (%) Projections by Country, 2025 to 2035
  • Figure 100: Western Europe Market Value (US$ Million) Analysis by Product Type, 2020 to 2035
  • Figure 101: Western Europe Market Volume (Units) Analysis by Product Type, 2020 to 2035
  • Figure 102: Western Europe Market Value Share (%) and BPS Analysis by Product Type, 2025 to 2035
  • Figure 103: Western Europe Market Y-o-Y Growth (%) Projections by Product Type, 2025 to 2035
  • Figure 104: Western Europe Market Value (US$ Million) Analysis by Filler Type, 2020 to 2035
  • Figure 105: Western Europe Market Volume (Units) Analysis by Filler Type, 2020 to 2035
  • Figure 106: Western Europe Market Value Share (%) and BPS Analysis by Filler Type, 2025 to 2035
  • Figure 107: Western Europe Market Y-o-Y Growth (%) Projections by Filler Type, 2025 to 2035
  • Figure 108: Western Europe Market Value (US$ Million) Analysis by Automation Type, 2020 to 2035
  • Figure 109: Western Europe Market Volume (Units) Analysis by Automation Type, 2020 to 2035
  • Figure 110: Western Europe Market Value Share (%) and BPS Analysis by Automation Type, 2025 to 2035
  • Figure 111: Western Europe Market Y-o-Y Growth (%) Projections by Automation Type, 2025 to 2035
  • Figure 112: Western Europe Market Value (US$ Million) Analysis by End Use, 2020 to 2035
  • Figure 113: Western Europe Market Volume (Units) Analysis by End Use, 2020 to 2035
  • Figure 114: Western Europe Market Value Share (%) and BPS Analysis by End Use, 2025 to 2035
  • Figure 115: Western Europe Market Y-o-Y Growth (%) Projections by End Use, 2025 to 2035
  • Figure 116: Western Europe Market Attractiveness by Product Type, 2025 to 2035
  • Figure 117: Western Europe Market Attractiveness by Filler Type, 2025 to 2035
  • Figure 118: Western Europe Market Attractiveness by Automation Type, 2025 to 2035
  • Figure 119: Western Europe Market Attractiveness by End Use, 2025 to 2035
  • Figure 120: Western Europe Market Attractiveness by Country, 2025 to 2035
  • Figure 121: Eastern Europe Market Value (US$ Million) by Product Type, 2025 to 2035
  • Figure 122: Eastern Europe Market Value (US$ Million) by Filler Type, 2025 to 2035
  • Figure 123: Eastern Europe Market Value (US$ Million) by Automation Type, 2025 to 2035
  • Figure 124: Eastern Europe Market Value (US$ Million) by End Use, 2025 to 2035
  • Figure 125: Eastern Europe Market Value (US$ Million) by Country, 2025 to 2035
  • Figure 126: Eastern Europe Market Value (US$ Million) Analysis by Country, 2020 to 2035
  • Figure 127: Eastern Europe Market Volume (Units) Analysis by Country, 2020 to 2035
  • Figure 128: Eastern Europe Market Value Share (%) and BPS Analysis by Country, 2025 to 2035
  • Figure 129: Eastern Europe Market Y-o-Y Growth (%) Projections by Country, 2025 to 2035
  • Figure 130: Eastern Europe Market Value (US$ Million) Analysis by Product Type, 2020 to 2035
  • Figure 131: Eastern Europe Market Volume (Units) Analysis by Product Type, 2020 to 2035
  • Figure 132: Eastern Europe Market Value Share (%) and BPS Analysis by Product Type, 2025 to 2035
  • Figure 133: Eastern Europe Market Y-o-Y Growth (%) Projections by Product Type, 2025 to 2035
  • Figure 134: Eastern Europe Market Value (US$ Million) Analysis by Filler Type, 2020 to 2035
  • Figure 135: Eastern Europe Market Volume (Units) Analysis by Filler Type, 2020 to 2035
  • Figure 136: Eastern Europe Market Value Share (%) and BPS Analysis by Filler Type, 2025 to 2035
  • Figure 137: Eastern Europe Market Y-o-Y Growth (%) Projections by Filler Type, 2025 to 2035
  • Figure 138: Eastern Europe Market Value (US$ Million) Analysis by Automation Type, 2020 to 2035
  • Figure 139: Eastern Europe Market Volume (Units) Analysis by Automation Type, 2020 to 2035
  • Figure 140: Eastern Europe Market Value Share (%) and BPS Analysis by Automation Type, 2025 to 2035
  • Figure 141: Eastern Europe Market Y-o-Y Growth (%) Projections by Automation Type, 2025 to 2035
  • Figure 142: Eastern Europe Market Value (US$ Million) Analysis by End Use, 2020 to 2035
  • Figure 143: Eastern Europe Market Volume (Units) Analysis by End Use, 2020 to 2035
  • Figure 144: Eastern Europe Market Value Share (%) and BPS Analysis by End Use, 2025 to 2035
  • Figure 145: Eastern Europe Market Y-o-Y Growth (%) Projections by End Use, 2025 to 2035
  • Figure 146: Eastern Europe Market Attractiveness by Product Type, 2025 to 2035
  • Figure 147: Eastern Europe Market Attractiveness by Filler Type, 2025 to 2035
  • Figure 148: Eastern Europe Market Attractiveness by Automation Type, 2025 to 2035
  • Figure 149: Eastern Europe Market Attractiveness by End Use, 2025 to 2035
  • Figure 150: Eastern Europe Market Attractiveness by Country, 2025 to 2035
  • Figure 151: South Asia and Pacific Market Value (US$ Million) by Product Type, 2025 to 2035
  • Figure 152: South Asia and Pacific Market Value (US$ Million) by Filler Type, 2025 to 2035
  • Figure 153: South Asia and Pacific Market Value (US$ Million) by Automation Type, 2025 to 2035
  • Figure 154: South Asia and Pacific Market Value (US$ Million) by End Use, 2025 to 2035
  • Figure 155: South Asia and Pacific Market Value (US$ Million) by Country, 2025 to 2035
  • Figure 156: South Asia and Pacific Market Value (US$ Million) Analysis by Country, 2020 to 2035
  • Figure 157: South Asia and Pacific Market Volume (Units) Analysis by Country, 2020 to 2035
  • Figure 158: South Asia and Pacific Market Value Share (%) and BPS Analysis by Country, 2025 to 2035
  • Figure 159: South Asia and Pacific Market Y-o-Y Growth (%) Projections by Country, 2025 to 2035
  • Figure 160: South Asia and Pacific Market Value (US$ Million) Analysis by Product Type, 2020 to 2035
  • Figure 161: South Asia and Pacific Market Volume (Units) Analysis by Product Type, 2020 to 2035
  • Figure 162: South Asia and Pacific Market Value Share (%) and BPS Analysis by Product Type, 2025 to 2035
  • Figure 163: South Asia and Pacific Market Y-o-Y Growth (%) Projections by Product Type, 2025 to 2035
  • Figure 164: South Asia and Pacific Market Value (US$ Million) Analysis by Filler Type, 2020 to 2035
  • Figure 165: South Asia and Pacific Market Volume (Units) Analysis by Filler Type, 2020 to 2035
  • Figure 166: South Asia and Pacific Market Value Share (%) and BPS Analysis by Filler Type, 2025 to 2035
  • Figure 167: South Asia and Pacific Market Y-o-Y Growth (%) Projections by Filler Type, 2025 to 2035
  • Figure 168: South Asia and Pacific Market Value (US$ Million) Analysis by Automation Type, 2020 to 2035
  • Figure 169: South Asia and Pacific Market Volume (Units) Analysis by Automation Type, 2020 to 2035
  • Figure 170: South Asia and Pacific Market Value Share (%) and BPS Analysis by Automation Type, 2025 to 2035
  • Figure 171: South Asia and Pacific Market Y-o-Y Growth (%) Projections by Automation Type, 2025 to 2035
  • Figure 172: South Asia and Pacific Market Value (US$ Million) Analysis by End Use, 2020 to 2035
  • Figure 173: South Asia and Pacific Market Volume (Units) Analysis by End Use, 2020 to 2035
  • Figure 174: South Asia and Pacific Market Value Share (%) and BPS Analysis by End Use, 2025 to 2035
  • Figure 175: South Asia and Pacific Market Y-o-Y Growth (%) Projections by End Use, 2025 to 2035
  • Figure 176: South Asia and Pacific Market Attractiveness by Product Type, 2025 to 2035
  • Figure 177: South Asia and Pacific Market Attractiveness by Filler Type, 2025 to 2035
  • Figure 178: South Asia and Pacific Market Attractiveness by Automation Type, 2025 to 2035
  • Figure 179: South Asia and Pacific Market Attractiveness by End Use, 2025 to 2035
  • Figure 180: South Asia and Pacific Market Attractiveness by Country, 2025 to 2035
  • Figure 181: East Asia Market Value (US$ Million) by Product Type, 2025 to 2035
  • Figure 182: East Asia Market Value (US$ Million) by Filler Type, 2025 to 2035
  • Figure 183: East Asia Market Value (US$ Million) by Automation Type, 2025 to 2035
  • Figure 184: East Asia Market Value (US$ Million) by End Use, 2025 to 2035
  • Figure 185: East Asia Market Value (US$ Million) by Country, 2025 to 2035
  • Figure 186: East Asia Market Value (US$ Million) Analysis by Country, 2020 to 2035
  • Figure 187: East Asia Market Volume (Units) Analysis by Country, 2020 to 2035
  • Figure 188: East Asia Market Value Share (%) and BPS Analysis by Country, 2025 to 2035
  • Figure 189: East Asia Market Y-o-Y Growth (%) Projections by Country, 2025 to 2035
  • Figure 190: East Asia Market Value (US$ Million) Analysis by Product Type, 2020 to 2035
  • Figure 191: East Asia Market Volume (Units) Analysis by Product Type, 2020 to 2035
  • Figure 192: East Asia Market Value Share (%) and BPS Analysis by Product Type, 2025 to 2035
  • Figure 193: East Asia Market Y-o-Y Growth (%) Projections by Product Type, 2025 to 2035
  • Figure 194: East Asia Market Value (US$ Million) Analysis by Filler Type, 2020 to 2035
  • Figure 195: East Asia Market Volume (Units) Analysis by Filler Type, 2020 to 2035
  • Figure 196: East Asia Market Value Share (%) and BPS Analysis by Filler Type, 2025 to 2035
  • Figure 197: East Asia Market Y-o-Y Growth (%) Projections by Filler Type, 2025 to 2035
  • Figure 198: East Asia Market Value (US$ Million) Analysis by Automation Type, 2020 to 2035
  • Figure 199: East Asia Market Volume (Units) Analysis by Automation Type, 2020 to 2035
  • Figure 200: East Asia Market Value Share (%) and BPS Analysis by Automation Type, 2025 to 2035
  • Figure 201: East Asia Market Y-o-Y Growth (%) Projections by Automation Type, 2025 to 2035
  • Figure 202: East Asia Market Value (US$ Million) Analysis by End Use, 2020 to 2035
  • Figure 203: East Asia Market Volume (Units) Analysis by End Use, 2020 to 2035
  • Figure 204: East Asia Market Value Share (%) and BPS Analysis by End Use, 2025 to 2035
  • Figure 205: East Asia Market Y-o-Y Growth (%) Projections by End Use, 2025 to 2035
  • Figure 206: East Asia Market Attractiveness by Product Type, 2025 to 2035
  • Figure 207: East Asia Market Attractiveness by Filler Type, 2025 to 2035
  • Figure 208: East Asia Market Attractiveness by Automation Type, 2025 to 2035
  • Figure 209: East Asia Market Attractiveness by End Use, 2025 to 2035
  • Figure 210: East Asia Market Attractiveness by Country, 2025 to 2035
  • Figure 211: Middle East and Africa Market Value (US$ Million) by Product Type, 2025 to 2035
  • Figure 212: Middle East and Africa Market Value (US$ Million) by Filler Type, 2025 to 2035
  • Figure 213: Middle East and Africa Market Value (US$ Million) by Automation Type, 2025 to 2035
  • Figure 214: Middle East and Africa Market Value (US$ Million) by End Use, 2025 to 2035
  • Figure 215: Middle East and Africa Market Value (US$ Million) by Country, 2025 to 2035
  • Figure 216: Middle East and Africa Market Value (US$ Million) Analysis by Country, 2020 to 2035
  • Figure 217: Middle East and Africa Market Volume (Units) Analysis by Country, 2020 to 2035
  • Figure 218: Middle East and Africa Market Value Share (%) and BPS Analysis by Country, 2025 to 2035
  • Figure 219: Middle East and Africa Market Y-o-Y Growth (%) Projections by Country, 2025 to 2035
  • Figure 220: Middle East and Africa Market Value (US$ Million) Analysis by Product Type, 2020 to 2035
  • Figure 221: Middle East and Africa Market Volume (Units) Analysis by Product Type, 2020 to 2035
  • Figure 222: Middle East and Africa Market Value Share (%) and BPS Analysis by Product Type, 2025 to 2035
  • Figure 223: Middle East and Africa Market Y-o-Y Growth (%) Projections by Product Type, 2025 to 2035
  • Figure 224: Middle East and Africa Market Value (US$ Million) Analysis by Filler Type, 2020 to 2035
  • Figure 225: Middle East and Africa Market Volume (Units) Analysis by Filler Type, 2020 to 2035
  • Figure 226: Middle East and Africa Market Value Share (%) and BPS Analysis by Filler Type, 2025 to 2035
  • Figure 227: Middle East and Africa Market Y-o-Y Growth (%) Projections by Filler Type, 2025 to 2035
  • Figure 228: Middle East and Africa Market Value (US$ Million) Analysis by Automation Type, 2020 to 2035
  • Figure 229: Middle East and Africa Market Volume (Units) Analysis by Automation Type, 2020 to 2035
  • Figure 230: Middle East and Africa Market Value Share (%) and BPS Analysis by Automation Type, 2025 to 2035
  • Figure 231: Middle East and Africa Market Y-o-Y Growth (%) Projections by Automation Type, 2025 to 2035
  • Figure 232: Middle East and Africa Market Value (US$ Million) Analysis by End Use, 2020 to 2035
  • Figure 233: Middle East and Africa Market Volume (Units) Analysis by End Use, 2020 to 2035
  • Figure 234: Middle East and Africa Market Value Share (%) and BPS Analysis by End Use, 2025 to 2035
  • Figure 235: Middle East and Africa Market Y-o-Y Growth (%) Projections by End Use, 2025 to 2035
  • Figure 236: Middle East and Africa Market Attractiveness by Product Type, 2025 to 2035
  • Figure 237: Middle East and Africa Market Attractiveness by Filler Type, 2025 to 2035
  • Figure 238: Middle East and Africa Market Attractiveness by Automation Type, 2025 to 2035
  • Figure 239: Middle East and Africa Market Attractiveness by End Use, 2025 to 2035
  • Figure 240: Middle East and Africa Market Attractiveness by Country, 2025 to 2035

Frequently Asked Questions

What was the overall size of the Multi-Head Filling Machines Market in 2025?

The overall market size for the Multi-Head Filling Machines Market was USD 4.5 Billion in 2025.

How big is the Multi-Head Filling Machines Market expected to be in 2035?

The Multi-Head Filling Machines Market is expected to reach USD 7.7 Billion in 2035.

What are the key factors driving the growth of the filling machines market?

The market will be driven by increasing demand from food & beverage, pharmaceutical, and cosmetics industries. Innovations in AI-powered filling systems, IoT-integrated performance monitoring, and improvements in precision-based dosing mechanisms will further propel market expansion.

What are the key challenges in the Multi-Head Filling Machines Market?

Key challenges include high initial investment costs, maintenance complexities, and integration with existing production lines. However, advancements in automated cleaning systems, self-adjusting filling mechanisms, and predictive maintenance solutions are addressing these concerns and supporting market growth.

Which regions are expected to dominate the Multi-Head Filling Machines Market?

North America and Europe are expected to dominate due to strong investments in manufacturing automation, regulatory compliance requirements, and high adoption of smart filling technologies. Meanwhile, Asia-Pacific is experiencing rapid growth driven by industrialization, increasing food processing facilities, and rising demand for high-speed packaging solutions.

Explore Similar Insights

Future Market Insights

Multi-Head Filling Machines Market