The molybdenum market worldwide is expected to grow steadily, with an estimated value of USD 346.3 billion in 2025, which is expected to reach around USD 548 billion by 2035, increasing at a CAGR of approximately 4.7%.
The growth is stimulated by increasing demand in steel, energy, aerospace, and electronics industries. One of the major drivers of the industry is the automotive and construction industry, where the metal is used very widely as an alloying component in steel. It adds strength, weldability, and corrosion- and wear-resistance-traits needed for infrastructure, tools, pipelines, and structural elements.
In the energy industry, the metal use is increasing rapidly. It is utilized in drilling tools, refining catalysts, and nuclear components because it can resist extremely high temperatures and chemical exposure. With the oil, gas, and nuclear infrastructure becoming increasingly modern, the need for molybdenum-bearing materials continues to rise.
The metal is widely used by the electronics industry in thin films, semiconductors, and LCD displays based on the metal's thermal and conductive properties. With continuous research in microelectronics and displays, metal's importance is increasing within the digital economy.
Environmental concerns of mining processes are instigating exploration of the metal extraction and processing processes. However, studies persist to open up recyclable paths for the metal from used catalysts and steel scrap, yielding way to sustainable pathways and decreasing virgin ore dependence.
China, the USA, and Chile are at the forefront of the production and consumption industry. End-use consumption is led by Asia-Pacific due to vigorous industrialization, and North America and Europe have high-value applications in aerospace and high-performance manufacturing.
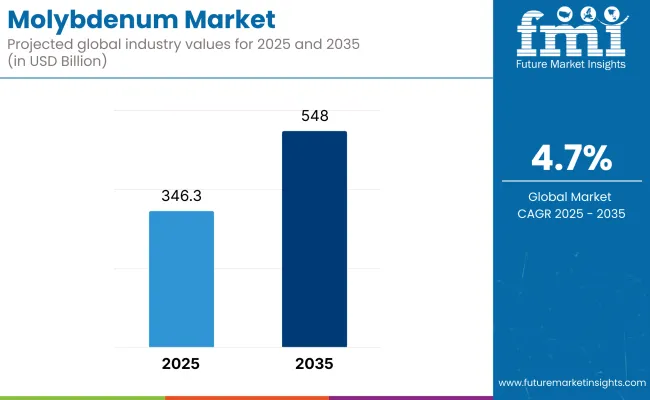
Market Metrics
| Metrics | Values |
|---|---|
| Industry Size (2025E) | USD 346.3 billion |
| Industry Value (2035F) | USD 548 billion |
| CAGR (2025 to 2035) | 4.7% |
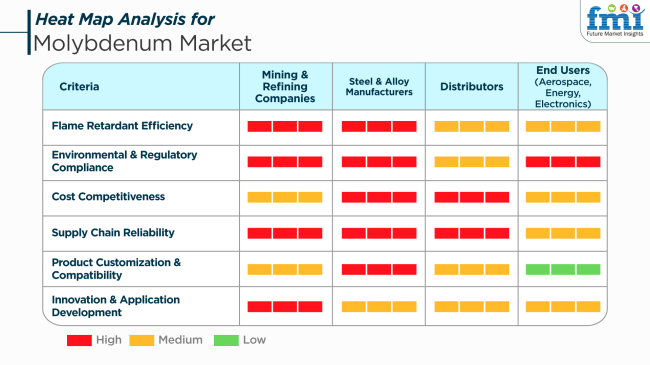
The industry is witnessing steady growth, fueled by growing demand across industries like steel manufacturing, aerospace, electronics, and energy. The metal's high melting point, strength, and corrosion resistance make it a critical element in high-performance alloys and other uses.
Distributors focus on cost competitiveness and assured supply chains to cater to the varied requirements of their customers. They serve as an intermediary in bridging the gap between producers and final users, providing timely availability and delivery of products.
End Users in all aerospace, energy, and electronics applications value innovation in application and sustainability. In aerospace, molybdenum alloys are used in aircraft parts because they have a high strength-to-weight ratio.
In the energy sector, the metal is utilized in power plant$$s and nuclear reactors because it retains thermal stability at high temperatures. Molybdenum is used in semiconductors and other equipment by the electronics industry, valuing its high electrical conductivity. The industry overall is characterized by collaborative efforts by actors to design and utilize products that meet performance requirements, are eco-friendly, and align with evolving consumer demands.
Stakeholder Priorities
From 2020 to 2024, there was a moderate growth in the industry, mainly due to consistent steel industry demand as the metal acts as an alloying agent responsible for hardening steel. Secondarily, the chemical and electronics industries also required molybdenum and thereby kept the industry steady during this period.
The global supply chain did face some disruption in 2020 due to the pandemic, and this caused price and availability volatility, which settled later on as production activities gained momentum in 2021. There was higher demand for the application of the metal in clean energy technologies, specifically solar cells, batteries, and hydrogen production, although penetration remained quite low due to their expensive nature as well as integration difficulty.
Over the next decade, till 2025 to 2035, the industry can be expected to undergo dramatic shifts. The metal demand will be increasingly influenced by green technologies, particularly as industries will continue to pursue energy-saving and more environmentally friendly solutions.
The use and production function of the metal in electric vehicles (EVs), renewable energy infrastructure like solar panels, and hydrogen fuel cells is observed to grow, thus triggering a shift in production and application patterns.
Apart from this, there will be augmented urbanization and infrastructure growth within emerging economies alongside advancements in aeronautic and defense companies, which further will drive the demand. Parallel to worldwide goals of sustainability, the industry shall see innovations designed to maximize efficiency in production coupled with minimizing negative impacts on the environment.
Comparative Analysis (2020 to 2024 vs. 2025 to 2035)
| 2020 to 2024 | 2025 to 2035 |
|---|---|
| Slow growth driven by demand by the steel industry and applications in electronics and chemical sectors. | Large-scale growth triggered by the application in green energy, electric cars, and clean power systems. |
| Steady demand for high-strength steel, with increasing use in clean energy applications. | Diversification of sustainable technologies such as EVs, solar photovoltaics, and hydrogen fuel production is influencing the use. |
| Steady, with consistent advances in steel manufacturing and small boosts in energy applications. | Emphasis on energy-saving technology, with it playing its part in front-runner sustainable applications. |
| Growth focus in steel-producing regions of significant size like China and the United States, along with additional demand for clean technology. | Increasing demand in new industrie s due to urbanization, infrastructure growth, and need for sustainable technologies. |
| Environmental issues started affecting production strategies, although influence was modest. | Increased regulatory emphasis on sustainability and clean technologies of energy, compelling more efficient and environmentally friendly production standards. |
| Slow advancement of molybdenum-based products in niche industrie s. | Evolution of molybdenum-based technologies for clean energy, electric vehicles, and other clean technologies will be a key priority. |
The industry is highly volatile to price fluctuations in raw materials. 2024 global production was 319.7 thousand metric tons, and prices varied based on supply-demand imbalances. These kinds of fluctuations impact cost of production and profit margins for producers and end-users significantly.
Geopolitical considerations present significant threats to the industry. In February 2025, China, which produces around 40% of the world's molybdenum, restricted the export of specific molybdenum powders applied to missile components. Such restrictions can destabilize international supply chains and cause prices to rise.
Environmental issues and decreasing ore grades are also concerns. North American production fell in 2023 as copper-molybdenum mine ore grades deteriorated. Stricter environmental regulations, particularly in China, have raised the challenge of securing mining approvals and could limit future supply.
Demand volatility among the large industries controls the industry. The North American industry experienced a challenging situation with changing price patterns and unstable demand in Q4 2024, when prices fell by 7% in November. Demand volatility can lead to price volatility and control the industry confidence.
Supply chain disruptions can cripple the delivery of products. These are transportation delays, geopolitical tensions, and logistics problems that can lead to production shutdowns and lost customer demand to the disadvantages of sales and long-term business relationships.
By Application In the year 2025, the largest part of the industry will be taken by the stainless steel segment, which is projected to account for 15.75% of the industry share. The second part is represented by the super alloy segment, which is expected to occupy 9.45% of the industry.
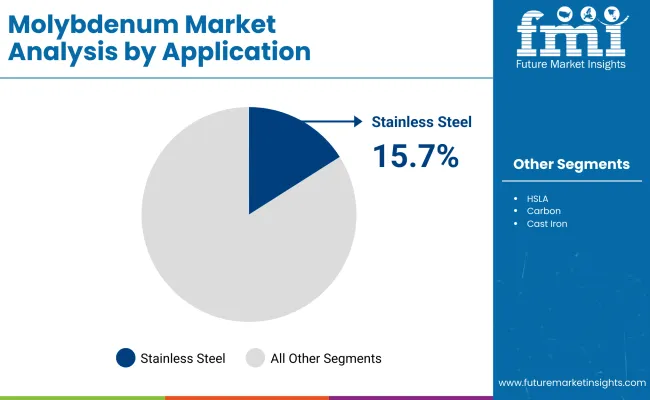
he stainless steel segment will become the major contributor to the industry in 2025, achieving anindustry share of about 15.75% by this time. This is due to the realization of the metal as a vital alloying element in the manufacture of stainless steel, which improves its strength, durability, and corrosion resistance. The use of the metal in stainless steel is manifold and covers most sectors, such as construction, automotive, aerospace, and manufacturing.
The consistent demand for high-performance stainless steel, especially for the construction and automotive sectors, upholds the consumption. Also, grades of stainless steel like 316 and 317, which usually contain higher amounts, are critical in the fabrication of high-performance corrosion-resistant products for chemical or extreme environments.
ArcelorMittal, POSCO, and ThyssenKrupp are some of the major producers of stainless steel in large quantities and, therefore, have a significant impact on the demand.Next comes the super alloy section, which is anticipated to have 9.45% of the industry figures in 2025.
Super alloys, commonly applied for high-temperature applications, such as turbines, jet engines, and gas turbines, take up to a level of molybdenum in order to allow superior maintenance of strength and stability under extreme conditions. Industries such as aerospace, energy, and defense will find super alloys to be a necessity in their operations. With the expansion of aerospace companies such as Boeing, Rolls-Royce, and General Electric, the requirement for super alloys and, further, it will rise.
These super alloys shall find their application in turbine blades, exhaust systems, and other vital components of a system that usually must perform under highly stressed and elevated temperature environments.
The anticipated future promise for both stainless steel and super alloy segments will keep on rising due to the ongoing need for stronger and more durable materials in various industrial applications, which may include construction, energy, aerospace, and automotive.
By End Use Industry It is expected that in the year 2025, the largest industry share in the industry will belong to chemicals and petrochemicals. It is estimated that this industry will account for a industry share of about 15.75%. The following major industry is automotive, which is expected to generate a 10.50% percentage.
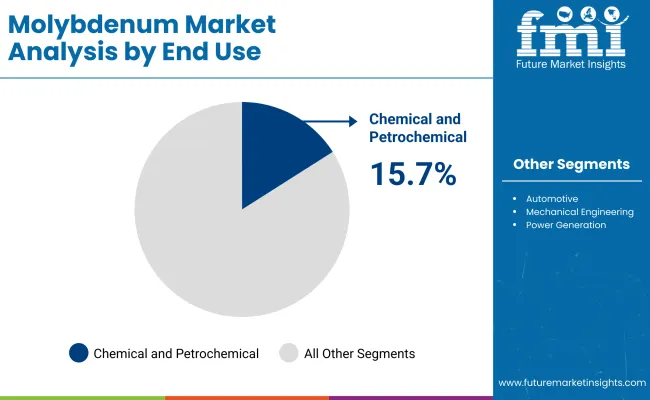
In 2025, chemicals and petrochemicals industries will be the top end-users of the metal, owning the lion's share of 15.75%. Tests show that the metal catalysts are vital in making sure that high-quality fuels and chemicals are obtained from them due to their increased selectivity and effectiveness on different reactions in place.
Increased demand for various refined fuels and chemicals, as well as petrochemicals, is growing worldwide due to industrial evolution and environmentally friendly energy sources. Major players in this sector are ExxonMobil, Shell, and Chevron, all of which rely heavily on the metal catalysts for pollution solutions and optimal refining performance. Such trends indicate that the trend for cleaner fuels will continue to entrench in operations.
The metal proves strong in high-strength, lightweight alloys, plus lightweight materials used in engine components, transmission parts, and chassis. It is anticipated to account for 10.50% of the share in 2025. Builders of automobiles are designing lighter vehicles that use less fuel.
Thus, automakers now must use advanced materials, of which the metal's unique properties make it ideal for this purpose. It helps reduce the weight of automotive parts while keeping strength and durability. It is mainly those companies that work in this segment, like Ford, General Motors, and Toyota, since most of them invest in new technologies and materials to develop automobile engines that consume less fuel and last longer. The growth of this sector in automotive industries, especially electric vehicles (EVs) and hybrid vehicles-will also likely serve as a boost to the demand in this industry.
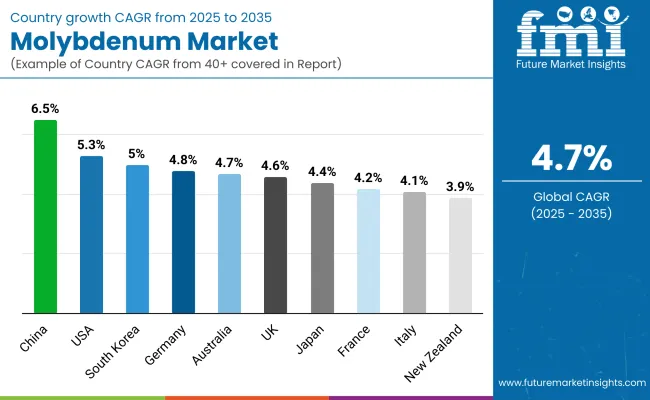
| Countries | CAGR (2025 - 2035 ) |
|---|---|
| USA | 5.3% |
| Uk | 4.6% |
| France | 4.2% |
| Germany | 4.8% |
| Italy | 4.1% |
| South Korea | 5 % |
| Japan | 4.4% |
| China | 6.5% |
| Australia | 4.7% |
| New Zealand | 3.9% |
The USA industry will grow at a CAGR of 5.3% between 2025 and 2035 on the strength of its strategic uses in steel production, energy equipment, and aerospace production. Metal is used in corrosion-resistant alloys and super alloys to make it the backbone for equipment in nuclear power plants, turbines, and pipes. Localized processing and mining capacity, mainly in Idaho and Colorado, remain an assured supply chain.
Major players such as Freeport-McMoRan and Climax Molybdenum are investing in capacity expansion and green extraction techniques. Continuous improvement in energy transmission, defense applications, and automobile manufacturing supports steady demand growth for the metal products in the USA industrial market.
The Ukindustry will develop at a CAGR of 4.6% from 2025 to 2035. Despite poor domestic production, demand is underpinned by the fact that the metal has an important role to play in sustaining the steel and petrochemical sectors. Adding the metal to stainless steel improves mechanical properties as well as anti-corrosion properties, which is essential for the nation's energy, transportation, and infrastructure initiatives.
British industries involving high-tech engineering and energy applications are using the metal in high-technology products like catalysts, heat exchangers, and power systems. Relying on import supply is balanced by high standards of quality control and recycling of material into the production process.
The French industry is also expected to grow at a CAGR of 4.2% throughout 2025 to 2035. The major demand is created by the automotive, defense, and industrial machinery industries, where high-performance alloys are used extensively. The metal is preferred due to its power to improve heat resistance and tensile strength in steel and cast iron parts.
Developed French metallurgical companies are capitalizing on their expertise in alloy design and exact component manufacture. Even being an import nation, France has developed trade links and sophisticated processing facilities, keeping it as an available item to be employed in technology-exigent applications, including aerospace propulsion equipment and nuclear reactors.
The German industry is likely to register a CAGR of 4.8% over the forecast period on the back of its dominance in engineering, automobile, and machinery manufacturing. The application in high-strength steel and metal parts contributes to sophisticated production techniques where performance under extreme temperatures and corrosive conditions is essential.
Large-scale German industrial companies, such as Thyssenkrupp and Salzgitter, are large consumers of alloys within their steel mills. Constant innovation in green energy infrastructure, wind, and hydrogen is increasing the application of the material. Material efficiency and recycling effectiveness make Germany competitive and sustainable in the value chain.
Italy's industry will expand at a CAGR of 4.1% from 2025 to 2035. Italy's manufacturing industry, which includes precision engineering, mechanical equipment, and automotive components, provides steady demand for molybdenum-containing products. The metal's surface hardness and wear resistance characteristics are of special importance in production processes with extended component life cycles.
Italian alloy producers and metallurgy firms are investing in new casting and forging technologies to minimize the use. While the domestic industry is still reliant on imports, Italy also has a solid base for integrating specialty metals into South European value-added industrial products.
South Korea's industry will grow at a CAGR of 5% from 2025 to 2035 due to the fast-paced growth of South Korea's electronics, shipbuilding, and heavy machinery industries. The metal finds extensive application in semiconductors, chemical catalysts, and stainless steel alloys, which further solidifies its position as a strategically critical metal in South Korea's export-driven economy.
Domestic industries are using it more and more in high-efficiency heat sinks, reactor vessels, and specialty coatings. POSCO and Korea Zinc are incorporating recycled molybdenum into their manufacturing lines, making supply more resilient and less dependent on external sources. Government-sponsored innovation centers promote ongoing material science innovations.
Japan's industry is expected to record a CAGR of 4.4% over the forecast period. Metal is an essential part of Japan's high-tech production industries, such as electronics, automotive, aerospace, and nuclear energy. The metal possesses high melting point and heat conductivity, making it an essential metal in the manufacture of electrical contacts, heat-resistant alloys, and specialty glass.
Japanese firms like Mitsubishi Materials and JX Nippon Mining are focusing on effective alloying processes and recycling to maintain supplies in the face of global fluctuations. A focus on precision engineering and technological capabilities guarantees the continued use of across high-performance industrial and electronic applications.
China's industry is projected to spearhead the globe with a 6.5% CAGR during 2025 to 2035. As the world's biggest molybdenum producer and consumer, China applies metal to a broad portfolio of applications ranging from construction steel to energy infrastructure and even electronics. Local mining within the provinces of Shaanxi and Henan provides a stable raw material supply.
Chinese companies like China Molybdenum Co., Ltd. are investing in overseas mining assets and downstream processing to secure supply chains and boost export capacity. The nation's rapid industrialization and infrastructure upgrade keep fueling strong demand for the products in a diverse range of high-growth industries.
The Australian industry is expected to advance at a CAGR of 4.7% from 2025 to 2035. Though the production is comparatively lower than that of other mineral commodities, the metal demand is increasing since it is used in high-tech mining equipment, oil and gas facilities, and metallurgical uses. Its application in corrosion-resistant alloys is especially significant because of Australia's extreme climate.
The metal development and exploration programs are forming greater reserves of the metal, especially as a secondary by-product to copper production activity. Australian businesses want to take full advantage of growing foreign demand through the development of the metal as a co-product and engaging downstream partners to maximize local value-added opportunities.
The New Zealand industry is anticipated to grow between 2025 and 2035 at a CAGR of 3.9%. New Zealand does not produce the metal in bulk. Still, there are specialty areas such as machinery manufacturing, agriculture equipment, and road repair where the metal is being requested for its durability and strength properties.
Importation and strategic buying are key to maintaining a consistent supply for domestic manufacturers. Coordination with local supply chains and compliance with quality control measures enable New Zealand's manufacturing industry to utilize the products in specialist engineering and maintenance services, sustaining small but consistent industry growth.
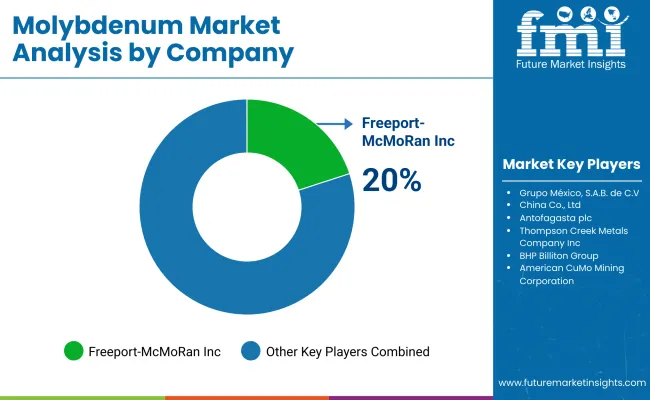
The industry is ruled by the larger mining and metallurgical companies, where Freeport-McMoRan, Grupo Mexico, and Antofagasta plc enjoy strengths in industry positions owing to their well-established mining operations, strategic stockpiles, and worldwide distribution. These industries practice vertical integration and refining capabilities to keep a competitive edge against each other in the production, which is used in steel, aerospace, and industrial catalysts.
Chinese companies, including China Co. Ltd. and Jinduicheng Co. Ltd., are crucial players in the global supply, reflecting China's significant position as a leading producer of this metal. These firms are strong competitors in the international industry due to their government support, cost-effective mining methods, and high domestic consumption.
Thompson Creek Metals and Compañía Minera Antamina are both increasing their industry share through joint ventures, new reserve exploration and better processing techniques. In an ever-changing regulatory environment, their competitive position stems from a growing emphasis on production efficiency and the mitigation of environmental impact.
Another approach to the mining is being adopted by BHP Billiton and Compania Minera Dona Ines De Collahuasi, which are advancing the extraction of the metal alongside copper mining and, therefore, maximizing profit through multi-metal mining operations. High-yield knowledge in molybdenum recovery and international trading partnerships provide added credence to their competitive advantage vis-a-vis their peers.
Market Share Analysis by Company
| Company Name | Market Share (%) |
|---|---|
| Freeport-McMoRan Inc. | 20-24% |
| Grupo México, S.A.B. de C.V. | 16-20% |
| China Co., Ltd. | 12-16% |
| Antofagasta plc | 10-14% |
| Thompson Creek Metals Company Inc. | 8-12% |
| Others (combined) | 30-40% |
| Company Name | Key Offerings and Activities |
|---|---|
| Freeport-McMoRan Inc. | Leads in mining and refining, supplying aerospace, construction, and steel industries. |
| Grupo México, S.A.B. de C.V. | Integrates extraction with copper production, expanding its mining footprint. |
| China Co., Ltd. | Dominates Asia’s supply chain with government-backed mining expansions. |
| Antofagasta plc | Invests in sustainable mining operations alongside copper production. |
| Thompson Creek Metals Company Inc. | Specializes in low-cost, high-yield extraction and processing. |
Key Company Insights
Freeport-McMoRan Inc. (20-24%)
World leader in the production based on integrated mining operations and cutting-edge refining technology.
Grupo México, S.A.B. de C.V. (16 to 20%)
Consolidates its position by means of strategic recovery in combination with copper mining.
China Co., Ltd. (12-16%)
It resides in a leading supply position in Asia, with cost-effective mining and government-supported growth.
Antofagasta plc (10-14%)
It is particularly focused on sustainable mining efforts, maximizing the metal recovery out of copper mining operations.
Thompson Creek Metals Company Inc. (8-12%)
Diversifies its low-cost extraction methods to increase the metal supply and processing effectiveness.
Other Key Players
By application, the industry is segmented into full alloy, stainless steel, HSLA, tools, carbon, cast iron, catalysts, MO metal alloy, super alloy, and other applications.
By end use, the industry is segmented into oil and gas, chemicals and petrochemicals, automotive, mechanical engineering, building and construction, power generation, aerospace and defense, electronics and medical, process industry, and other industries.
By region, the industry is segmented into North America, Latin America, Europe, Asia-Pacific excluding Japan (APEJ), Japan, and the Middle East and Africa (MEA).
Table 1: Global Value (US$ Million) Forecast by Region, 2017 to 2033
Table 2: Global Volume (Tons) Forecast by Region, 2017 to 2033
Table 3: Global Value (US$ Million) Forecast by Application, 2017 to 2033
Table 4: Global Volume (Tons) Forecast by Application, 2017 to 2033
Table 5: Global Value (US$ Million) Forecast by End Use Industry, 2017 to 2033
Table 6: Global Volume (Tons) Forecast by End Use Industry, 2017 to 2033
Table 7: North America Value (US$ Million) Forecast by Country, 2017 to 2033
Table 8: North America Volume (Tons) Forecast by Country, 2017 to 2033
Table 9: North America Value (US$ Million) Forecast by Application, 2017 to 2033
Table 10: North America Volume (Tons) Forecast by Application, 2017 to 2033
Table 11: North America Value (US$ Million) Forecast by End Use Industry, 2017 to 2033
Table 12: North America Volume (Tons) Forecast by End Use Industry, 2017 to 2033
Table 13: Latin America Value (US$ Million) Forecast by Country, 2017 to 2033
Table 14: Latin America Volume (Tons) Forecast by Country, 2017 to 2033
Table 15: Latin America Value (US$ Million) Forecast by Application, 2017 to 2033
Table 16: Latin America Volume (Tons) Forecast by Application, 2017 to 2033
Table 17: Latin America Value (US$ Million) Forecast by End Use Industry, 2017 to 2033
Table 18: Latin America Volume (Tons) Forecast by End Use Industry, 2017 to 2033
Table 19: Europe Value (US$ Million) Forecast by Country, 2017 to 2033
Table 20: Europe Volume (Tons) Forecast by Country, 2017 to 2033
Table 21: Europe Value (US$ Million) Forecast by Application, 2017 to 2033
Table 22: Europe Volume (Tons) Forecast by Application, 2017 to 2033
Table 23: Europe Value (US$ Million) Forecast by End Use Industry, 2017 to 2033
Table 24: Europe Volume (Tons) Forecast by End Use Industry, 2017 to 2033
Table 25: APEJ Value (US$ Million) Forecast by Country, 2017 to 2033
Table 26: APEJ Volume (Tons) Forecast by Country, 2017 to 2033
Table 27: APEJ Value (US$ Million) Forecast by Application, 2017 to 2033
Table 28: APEJ Volume (Tons) Forecast by Application, 2017 to 2033
Table 29: APEJ Value (US$ Million) Forecast by End Use Industry, 2017 to 2033
Table 30: APEJ Volume (Tons) Forecast by End Use Industry, 2017 to 2033
Table 31: Japan Value (US$ Million) Forecast by Country, 2017 to 2033
Table 32: Japan Volume (Tons) Forecast by Country, 2017 to 2033
Table 33: Japan Value (US$ Million) Forecast by Application, 2017 to 2033
Table 34: Japan Volume (Tons) Forecast by Application, 2017 to 2033
Table 35: Japan Value (US$ Million) Forecast by End Use Industry, 2017 to 2033
Table 36: Japan Volume (Tons) Forecast by End Use Industry, 2017 to 2033
Table 37: MEA Value (US$ Million) Forecast by Country, 2017 to 2033
Table 38: MEA Volume (Tons) Forecast by Country, 2017 to 2033
Table 39: MEA Value (US$ Million) Forecast by Application, 2017 to 2033
Table 40: MEA Volume (Tons) Forecast by Application, 2017 to 2033
Table 41: MEA Value (US$ Million) Forecast by End Use Industry, 2017 to 2033
Table 42: MEA Volume (Tons) Forecast by End Use Industry, 2017 to 2033
Figure 1: Global Value (US$ Million) by Application, 2023 to 2033
Figure 2: Global Value (US$ Million) by End Use Industry, 2023 to 2033
Figure 3: Global Value (US$ Million) by Region, 2023 to 2033
Figure 4: Global Value (US$ Million) Analysis by Region, 2017 to 2033
Figure 5: Global Volume (Tons) Analysis by Region, 2017 to 2033
Figure 6: Global Value Share (%) and BPS Analysis by Region, 2023 to 2033
Figure 7: Global Y-o-Y Growth (%) Projections by Region, 2023 to 2033
Figure 8: Global Value (US$ Million) Analysis by Application, 2017 to 2033
Figure 9: Global Volume (Tons) Analysis by Application, 2017 to 2033
Figure 10: Global Value Share (%) and BPS Analysis by Application, 2023 to 2033
Figure 11: Global Y-o-Y Growth (%) Projections by Application, 2023 to 2033
Figure 12: Global Value (US$ Million) Analysis by End Use Industry, 2017 to 2033
Figure 13: Global Volume (Tons) Analysis by End Use Industry, 2017 to 2033
Figure 14: Global Value Share (%) and BPS Analysis by End Use Industry, 2023 to 2033
Figure 15: Global Y-o-Y Growth (%) Projections by End Use Industry, 2023 to 2033
Figure 16: Global Attractiveness by Application, 2023 to 2033
Figure 17: Global Attractiveness by End Use Industry, 2023 to 2033
Figure 18: Global Attractiveness by Region, 2023 to 2033
Figure 19: North America Value (US$ Million) by Application, 2023 to 2033
Figure 20: North America Value (US$ Million) by End Use Industry, 2023 to 2033
Figure 21: North America Value (US$ Million) by Country, 2023 to 2033
Figure 22: North America Value (US$ Million) Analysis by Country, 2017 to 2033
Figure 23: North America Volume (Tons) Analysis by Country, 2017 to 2033
Figure 24: North America Value Share (%) and BPS Analysis by Country, 2023 to 2033
Figure 25: North America Y-o-Y Growth (%) Projections by Country, 2023 to 2033
Figure 26: North America Value (US$ Million) Analysis by Application, 2017 to 2033
Figure 27: North America Volume (Tons) Analysis by Application, 2017 to 2033
Figure 28: North America Value Share (%) and BPS Analysis by Application, 2023 to 2033
Figure 29: North America Y-o-Y Growth (%) Projections by Application, 2023 to 2033
Figure 30: North America Value (US$ Million) Analysis by End Use Industry, 2017 to 2033
Figure 31: North America Volume (Tons) Analysis by End Use Industry, 2017 to 2033
Figure 32: North America Value Share (%) and BPS Analysis by End Use Industry, 2023 to 2033
Figure 33: North America Y-o-Y Growth (%) Projections by End Use Industry, 2023 to 2033
Figure 34: North America Attractiveness by Application, 2023 to 2033
Figure 35: North America Attractiveness by End Use Industry, 2023 to 2033
Figure 36: North America Attractiveness by Country, 2023 to 2033
Figure 37: Latin America Value (US$ Million) by Application, 2023 to 2033
Figure 38: Latin America Value (US$ Million) by End Use Industry, 2023 to 2033
Figure 39: Latin America Value (US$ Million) by Country, 2023 to 2033
Figure 40: Latin America Value (US$ Million) Analysis by Country, 2017 to 2033
Figure 41: Latin America Volume (Tons) Analysis by Country, 2017 to 2033
Figure 42: Latin America Value Share (%) and BPS Analysis by Country, 2023 to 2033
Figure 43: Latin America Y-o-Y Growth (%) Projections by Country, 2023 to 2033
Figure 44: Latin America Value (US$ Million) Analysis by Application, 2017 to 2033
Figure 45: Latin America Volume (Tons) Analysis by Application, 2017 to 2033
Figure 46: Latin America Value Share (%) and BPS Analysis by Application, 2023 to 2033
Figure 47: Latin America Y-o-Y Growth (%) Projections by Application, 2023 to 2033
Figure 48: Latin America Value (US$ Million) Analysis by End Use Industry, 2017 to 2033
Figure 49: Latin America Volume (Tons) Analysis by End Use Industry, 2017 to 2033
Figure 50: Latin America Value Share (%) and BPS Analysis by End Use Industry, 2023 to 2033
Figure 51: Latin America Y-o-Y Growth (%) Projections by End Use Industry, 2023 to 2033
Figure 52: Latin America Attractiveness by Application, 2023 to 2033
Figure 53: Latin America Attractiveness by End Use Industry, 2023 to 2033
Figure 54: Latin America Attractiveness by Country, 2023 to 2033
Figure 55: Europe Value (US$ Million) by Application, 2023 to 2033
Figure 56: Europe Value (US$ Million) by End Use Industry, 2023 to 2033
Figure 57: Europe Value (US$ Million) by Country, 2023 to 2033
Figure 58: Europe Value (US$ Million) Analysis by Country, 2017 to 2033
Figure 59: Europe Volume (Tons) Analysis by Country, 2017 to 2033
Figure 60: Europe Value Share (%) and BPS Analysis by Country, 2023 to 2033
Figure 61: Europe Y-o-Y Growth (%) Projections by Country, 2023 to 2033
Figure 62: Europe Value (US$ Million) Analysis by Application, 2017 to 2033
Figure 63: Europe Volume (Tons) Analysis by Application, 2017 to 2033
Figure 64: Europe Value Share (%) and BPS Analysis by Application, 2023 to 2033
Figure 65: Europe Y-o-Y Growth (%) Projections by Application, 2023 to 2033
Figure 66: Europe Value (US$ Million) Analysis by End Use Industry, 2017 to 2033
Figure 67: Europe Volume (Tons) Analysis by End Use Industry, 2017 to 2033
Figure 68: Europe Value Share (%) and BPS Analysis by End Use Industry, 2023 to 2033
Figure 69: Europe Y-o-Y Growth (%) Projections by End Use Industry, 2023 to 2033
Figure 70: Europe Attractiveness by Application, 2023 to 2033
Figure 71: Europe Attractiveness by End Use Industry, 2023 to 2033
Figure 72: Europe Attractiveness by Country, 2023 to 2033
Figure 73: APEJ Value (US$ Million) by Application, 2023 to 2033
Figure 74: APEJ Value (US$ Million) by End Use Industry, 2023 to 2033
Figure 75: APEJ Value (US$ Million) by Country, 2023 to 2033
Figure 76: APEJ Value (US$ Million) Analysis by Country, 2017 to 2033
Figure 77: APEJ Volume (Tons) Analysis by Country, 2017 to 2033
Figure 78: APEJ Value Share (%) and BPS Analysis by Country, 2023 to 2033
Figure 79: APEJ Y-o-Y Growth (%) Projections by Country, 2023 to 2033
Figure 80: APEJ Value (US$ Million) Analysis by Application, 2017 to 2033
Figure 81: APEJ Volume (Tons) Analysis by Application, 2017 to 2033
Figure 82: APEJ Value Share (%) and BPS Analysis by Application, 2023 to 2033
Figure 83: APEJ Y-o-Y Growth (%) Projections by Application, 2023 to 2033
Figure 84: APEJ Value (US$ Million) Analysis by End Use Industry, 2017 to 2033
Figure 85: APEJ Volume (Tons) Analysis by End Use Industry, 2017 to 2033
Figure 86: APEJ Value Share (%) and BPS Analysis by End Use Industry, 2023 to 2033
Figure 87: APEJ Y-o-Y Growth (%) Projections by End Use Industry, 2023 to 2033
Figure 88: APEJ Attractiveness by Application, 2023 to 2033
Figure 89: APEJ Attractiveness by End Use Industry, 2023 to 2033
Figure 90: APEJ Attractiveness by Country, 2023 to 2033
Figure 91: Japan Value (US$ Million) by Application, 2023 to 2033
Figure 92: Japan Value (US$ Million) by End Use Industry, 2023 to 2033
Figure 93: Japan Value (US$ Million) by Country, 2023 to 2033
Figure 94: Japan Value (US$ Million) Analysis by Country, 2017 to 2033
Figure 95: Japan Volume (Tons) Analysis by Country, 2017 to 2033
Figure 96: Japan Value Share (%) and BPS Analysis by Country, 2023 to 2033
Figure 97: Japan Y-o-Y Growth (%) Projections by Country, 2023 to 2033
Figure 98: Japan Value (US$ Million) Analysis by Application, 2017 to 2033
Figure 99: Japan Volume (Tons) Analysis by Application, 2017 to 2033
Figure 100: Japan Value Share (%) and BPS Analysis by Application, 2023 to 2033
Figure 101: Japan Y-o-Y Growth (%) Projections by Application, 2023 to 2033
Figure 102: Japan Value (US$ Million) Analysis by End Use Industry, 2017 to 2033
Figure 103: Japan Volume (Tons) Analysis by End Use Industry, 2017 to 2033
Figure 104: Japan Value Share (%) and BPS Analysis by End Use Industry, 2023 to 2033
Figure 105: Japan Y-o-Y Growth (%) Projections by End Use Industry, 2023 to 2033
Figure 106: Japan Attractiveness by Application, 2023 to 2033
Figure 107: Japan Attractiveness by End Use Industry, 2023 to 2033
Figure 108: Japan Attractiveness by Country, 2023 to 2033
Figure 109: MEA Value (US$ Million) by Application, 2023 to 2033
Figure 110: MEA Value (US$ Million) by End Use Industry, 2023 to 2033
Figure 111: MEA Value (US$ Million) by Country, 2023 to 2033
Figure 112: MEA Value (US$ Million) Analysis by Country, 2017 to 2033
Figure 113: MEA Volume (Tons) Analysis by Country, 2017 to 2033
Figure 114: MEA Value Share (%) and BPS Analysis by Country, 2023 to 2033
Figure 115: MEA Y-o-Y Growth (%) Projections by Country, 2023 to 2033
Figure 116: MEA Value (US$ Million) Analysis by Application, 2017 to 2033
Figure 117: MEA Volume (Tons) Analysis by Application, 2017 to 2033
Figure 118: MEA Value Share (%) and BPS Analysis by Application, 2023 to 2033
Figure 119: MEA Y-o-Y Growth (%) Projections by Application, 2023 to 2033
Figure 120: MEA Value (US$ Million) Analysis by End Use Industry, 2017 to 2033
Figure 121: MEA Volume (Tons) Analysis by End Use Industry, 2017 to 2033
Figure 122: MEA Value Share (%) and BPS Analysis by End Use Industry, 2023 to 2033
Figure 123: MEA Y-o-Y Growth (%) Projections by End Use Industry, 2023 to 2033
Figure 124: MEA Attractiveness by Application, 2023 to 2033
Figure 125: MEA Attractiveness by End Use Industry, 2023 to 2033
Figure 126: MEA Attractiveness by Country, 2023 to 2033
The industry is estimated to reach USD 346.3 billion by 2025.
Sales are expected to grow to USD 545 billion by 2035.
China is expected to experience a 6.5% CAGR.
The stainless steel segment is the largest and fastest-growing in the industry, driven by its demand in the production of high-strength alloys and tools.
Key players include Freeport-McMoRan Inc., Grupo México, S.A.B. de C.V., China Co., Ltd., Antofagasta plc, Thompson Creek Metals Company Inc., Compañía Minera Antamina S.A., Compania Minera Dona Ines De Collahuasi S.C.M., BHP Billiton Group, Jinduicheng Co., Ltd., and American CuMo Mining Corporation.

Thank you!
You will receive an email from our Business Development Manager. Please be sure to check your SPAM/JUNK folder too.
Chat With
MaRIA