The modular instruments market holds a significant prospect for growth over the projected timeline of 2025 to 2035 owing to the increasing demand for high-performance testing and measurement solutions, rising adoption across technology verticals to enable automated testing, and the growth of the 5G, IoT, and semiconductor industries. The modular instrument offers scalability, flexibility and cost-effectiveness are essential in sectors like electronics testing, aerospace & defence, automotive and telecommunications.
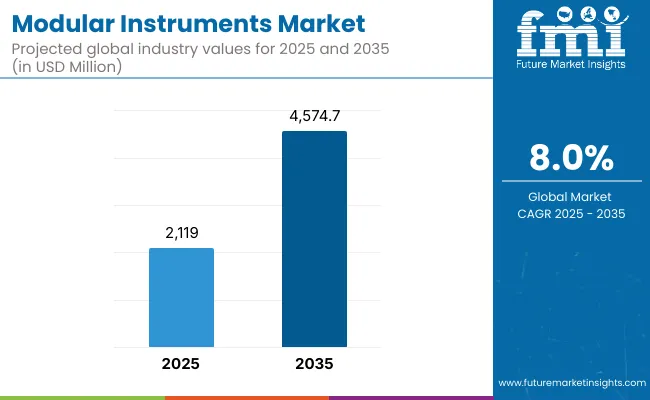
The market is estimated to rise from USD 2,119.0 Million in 2025 to USD 4,574.7 Million by 2035, growing with a CAGR of 8.0 % during the forecast period. Market growth is being driven by developments in wireless technology, increased complexity of electronic gadgets, and the requirement for real-time data acquisition.
The Northern America region has the largest share of market, and the United States leads the way for modular instruments adoption. Factors responsible for the growth of this segment are the major regional presence of major technology firms, increasing R&D investments by industry players in the region, and high-speed testing demand from aerospace & defence, telecommunications, and semiconductor industries. The rapid growth of 5G networks, autonomous vehicles and AI-based electronics testing also creates market opportunities.
Europe accounts for a major market share, owing to high investments in industrial automation, aerospace, and automotive testing. Modular instruments are increasingly being used in countries like Germany, the UK, and France for applications such as electronic component testing, RF testing, and real-time monitoring in industrial applications. The increasing trend towards Industry 4.0 and digitalization is also spurring on growth in the area.
Asia-Pacific will most likely be the fastest growing region, driven by booming semiconductor manufacturing, rising telecom infrastructure, and growing investments in industrial automation. We expect demand for our advanced, high-speed and modular testing instruments to be driven by emerging biopharma development in markets to include IoT adoption and 5G deployment in China, Japan and South Korea and consumer electronics production with rapid change out of India.
Additionally, the regional market opportunities are growing due to the rise in contract manufacturing and research labs.
Challenge:
High Initial Investment and Complex Integration
Modular instruments adoption is an upfront endeavour for modular instruments adoption also requires extensive up-front investment in hardware, software, and trained personnel, which may be a challenge for small and medium enterprises (SMEs). Moreover, modular instrumentation must be integrated with the current test environments and legacy systems, which can be a complex undertaking that requires specialized knowledge in systems pre-calibration, data synchronization, and compatibility testing.
Opportunity:
Rising Demand for AI-Driven and Cloud-Connected Test Solutions
Modular instrument manufacturers have new opportunities as AI, machine learning, and cloud-based testing become more widely adopted. The era of AI-powered predictive analytics and remote monitoring along with established cloud-enabled channels is transforming how the industry is deploying real-time data capturing and system verification. Software-defined testing solutions, modular automation platforms, and high-speed data acquisition systems are expected to generate competitive advantages in the changing landscape.
The modular instruments market experienced substantial growth, as demand for flexible, high-performance test and measurement solutions continued to rise in the electronics, telecommunications, and automotive sectors and in of 5G deployment and the explosion of IoT connectivity, PXI (PCI eXtensions for Instrumentation), AXIe (AdvancedTCA eXtensions for Instrumentation), and VXI (VME eXtensions for Instrumentation) modular platforms have all surged for RF and wireless testing. What is also in addition, semiconductor manufacturers have also made use of modular instruments in the areas of chip development, validation, and failure analysis.
For instance, the automotive industry embraced modular testing solutions for real-time diagnostics and validation, with many sectors focused on the electrifying vehicle (EV) testing and autonomous driving technologies. High cost, complex system integration, and standardization challenges reduced market penetration.
The modular instruments market would transform between 2025 and 2035 with automated tests using AI, cloud-based testing and application areas like quantum computing and aerospace. By implementing AI-driven test automation, the human involvement will be decreased which will boost efficiency in research labs and manufacturing facilities. Leveraging cloud-based modular instruments will facilitate remote access and real-time data analysis, enhancing collaboration across sectors.
As we enter the era of quantum computing, next-generation semiconductors, and 6G networks, modular instruments will be crucial to accurate measurement, simulation, and debugging. Furthermore, energy-efficient, and software-defined modular instruments will meet changing industry needs while reducing operating costs.
Modular instruments are gaining traction in spacecraft communication testing, flight control validation, and radar system calibration in the defence and aerospace industries. With the growing adoption of modular instruments for testing in the loads of innovation sectors, the modular instruments market is set to boom in the next few years.
Market Shifts: A Comparative Analysis 2020 to 2024 vs. 2025 to 2035
| Market Shift | 2020 to 2024 |
|---|---|
| Technology Adoption | PXI, AXIe, and VXI for RF and semiconductor testing. |
| Wireless & Communication | 5G deployment and IoT network testing. |
| Automotive & EV Testing | Adoption in electric vehicle and autonomous driving validation. |
| Semiconductor Industry | Modular testing for chip validation and failure analysis. |
| Defence & Aerospace | Radar and avionics system calibration. |
| Cost & Scalability | High costs and complex integration challenges. |
| Market Growth Drivers | Demand driven by electronics, telecom, and automotive industries. |
| Market Shift | 2025 to 2035 |
|---|---|
| Technology Adoption | AI-driven automation, cloud-integrated instruments, and quantum computing applications. |
| Wireless & Communication | Expansion into 6G and satellite communication validation. |
| Automotive & EV Testing | Integration with AI-based predictive maintenance and real-time analytics. |
| Semiconductor Industry | Advanced testing for next-gen semiconductors and nanotechnology devices. |
| Defence & Aerospace | AI-assisted satellite, missile, and advanced communication system testing. |
| Cost & Scalability | Software-defined, scalable, and cost-efficient modular systems. |
| Market Growth Drivers | Growth fuelled by AI automation, cloud-based platforms, and quantum computing advancements. |
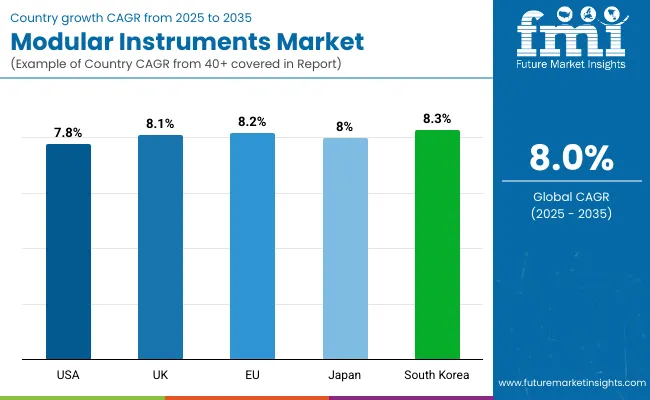
In the USA, the modular instruments market is experiencing significant growth, fuelled by the growing acceptance of automated test equipment, as well as demand for flexible and scalable testing options, 5G, IoT and semiconductor industry advancements.
The high presence of technological giants, growing R&D in aerospace, defence, and telecommunications sectors have contributed to the explosion of the market. In response to the growing demand for a more flexible, cost-effective testing solution, modular instruments are becoming more and more prominent in the marketplace. The growth of the market in the following years is expected to be speared by increasing focus on software-defined instrumentation and a rise in adoption of AI driven analytics.
| Country | CAGR (2025 to 2035) |
|---|---|
| United States | 7.8% |
Growth is being witnessed in the modular instruments market in the United Kingdom due to steady progression of wireless communication results, across the aerospace and defence sectors and automotive testing. As electronic systems become more complex and the need for real-time monitoring and high-precision measurement solutions grows, modular instruments are being adopted in multiple industries automate tests, and save time.
Market growth has been further bolstered by the UK’s high focus on research and development, most notably in the semiconductor and telecommunications industries. In addition, government actions promoting innovation in automation and testing technologies are also anticipated to drive continuous growth in the market.
| Country | CAGR (2025 to 2035) |
|---|---|
| United Kingdom | 8.1% |
The share of modular instruments-market is also increasing at a significant rate in European Union due to durable investments in industrial automation, progression in electronic testing and rising need for better measurement equipment performance. The leaders include Germany, France and Italy who deploy modular instruments for use in both aerospace, automotive and semiconductor testing.
Flexibility as just one example of a software driven test and measurement solution has become a driving force behind smart manufacturing and Industry 4.0. The region has also witnessed the focus on sustainability and energy efficiency, which has driven the adoption of modular instruments in renewable energy and power electronics testing.
| Country | CAGR (2025 to 2035) |
|---|---|
| European Union (EU) | 8.2% |
Japan's modular instrument sector is expanding, primarily due to the nation's prowess in the field of semiconductor fabrication, consumer electronics, and automotive technology. As firms work to improve the efficiency of their production and R&D efforts, the demand for extremely accurate, modular and software-configurable testing instruments has grown.
Furthermore, the growing demand for modular test solutions has mainly been attributed to Japan's investment in technologies such as 5G, AI-driven automation, and next-gen wireless technologies. The emphasis on compact and portable testing solutions for medical devices and smart electronics in the country is also contributing toward the growth of market.
| Country | CAGR (2025 to 2035) |
|---|---|
| Japan | 8.0% |
Rapid growth of the modular instruments market in South Korea is being propelled by the country's strong foothold in the electronics, telecommunications and semiconductor sectors. This trajectory of demand for high-speed, automated, and modular test solutions has pushed the consumption of software-defined instrumentation in several applications.
Intense growth in the demand for precision testing equipment in the country, coming out of significant investments in 5G as well as semiconductor research and development (R&D). Moreover, the use of AI and machine learning in test and measurement solutions are making modular instruments even more efficient and precise in South Korea.
| Country | CAGR (2025 to 2035) |
|---|---|
| South Korea | 8.3% |
| By Platform Type | Market Share (2025) |
|---|---|
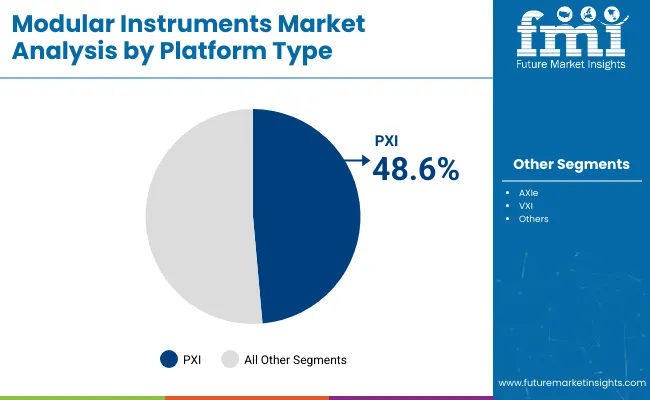
| PXI | 48.6% |
PXI (PCI eXtensions for Instrumentation) is the current market leader in modular instruments thanks to its high-speed performance, flexibility, and scalability. PXI-based modular instruments designed for automated test and measurement applications PXI-based modular instruments combine with industry-standard computing platforms that provide rapid data acquisition, analysis and signal processing capabilities.
PXI's small-form factor while housing several instruments is well-suited for multi-channel applications that need to be tested at the same time. PXI modular instruments are real-time measurement with low latency is possible High-performance testing in domains like aerospace, automotive electronics, and semiconductor manufacturing demands deterministic performance, something that engineers and researchers have come to expect from PXI systems.
The platform facilitates complex synchronization across multiple test instrument modules, allowing for accurate timing and phase matching across measurements. Moreover, increasing Industry 4.0 and IoT-connected smart manufacturing implementations’ adoption speeds up the requirement for PXI centralized modular instruments.
They can be analysed with machine learning algorithms and AI-based analytics to provide predictive maintenance, process optimization and defect detection in automated production lines. The growing adoption of PXI platforms for high-speed, software-defined test systems is a clear indicator that industries will continue their move toward digital transformation and small form factor electronic components.
| By Application | Market Share (2025) |
|---|---|
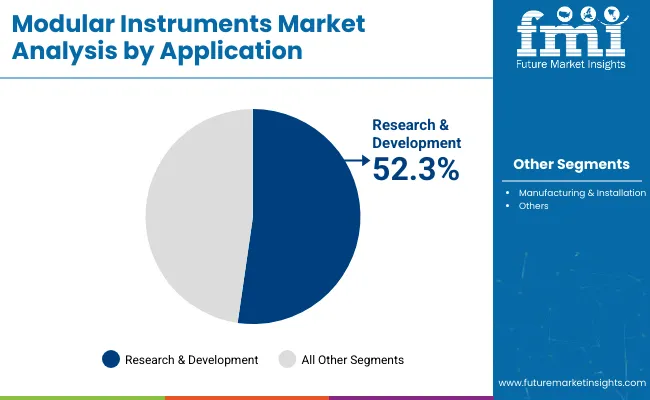
| Research & Development | 52.3% |
The larger application segment is found to be that of research and development (R&D) with rising innovation, prototyping, and experimental testing driving the growth of this segment. For the R&D teams in various industries, such as telecommunications, electronics, biotechnology, and material sciences, modular instrumentation allows for accurate, repeatable, and scalable testing environments.
In Research and Development (R&D) environments, modular instrumentation provides flexible testing setups, enabling engineers to respond to changing test needs without major hardware adjustments. Seamless integration and multi-test support the seamless integration or bundling of several test modules (RF, video, audio, etc.) into a single system can help enable higher test efficiency and lower operational costs.
The modular test platforms with their enhanced data acquisition, real-time analysis and software-defined measurement functions offer researchers significant advantages which speed up the product development cycle. Modular instruments designed primarily for R&D applications are still in high demand as different industries work to build next-generation technologies like 5G, quantum computing, and advanced driver-assistance systems (ADAS). Testing requirements are becoming more and more complex as semiconductor device and wireless communication protocol evolution continues at a rapid speed.
Modular Instruments ensure this is a future-proof solution, which provides all test standards around modular instruments, and an easy way to integrate new technologies on the market. In addition, even more modular instruments are used in a variety of academic and government research institutions engaged in scientific discovery and technology development. These systems are used by universities and national laboratories for fundamental physics experiments, material characterization, and biomedical research. Taking into account the rising R&D in various sectors, the penetration of modular instrumentation for precision testing and data harvesting is witnessing growth, marking its imprint in the global landscape.
The Modular Instruments Market will continue to grow as industries embrace flexible, scalable, and cost-effective testing solutions. Focusing on technological advancements, modularity and multi-functionality, a battery of companies strive to enhance the capabilities of testing across electronics, aerospace and automotive segments. Therefore, key players are investing in next-generation modular platforms, high-speed data acquisition, and improved connectivity to adapt to changing industry trends.
Market Share Analysis by Company
| Company Name | Estimated Market Share (%) |
|---|---|
| Keysight Technologies | 20-25% |
| National Instruments | 18-22% |
| Fortive Corporation | 12-16% |
| Viavi Solutions | 10-14% |
| Other Companies (combined) | 28-40% |
| Company Name | Key Offerings/Activities |
|---|---|
| Keysight Technologies | In 2024, introduced an advanced PXI-based RF test module for 5G and aerospace applications. |
| National Instruments | In 2025, launched AI-powered modular testing solutions to improve automation in electronics testing. |
| Fortive Corporation | In 2024, expanded its modular test equipment portfolio with enhanced data acquisition modules. |
| Viavi Solutions | In 2025, partnered with telecom providers to offer modular testing solutions for 6G research. |
Key Company Insights
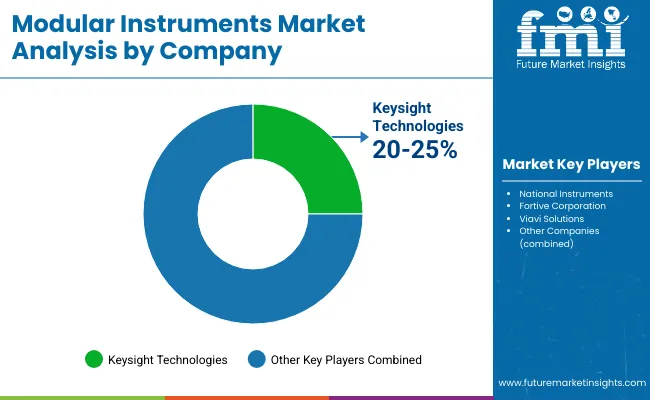
Keysight Technologies (20-25%)
Keysight leads the market with high-performance modular instruments for wireless communications, aerospace, and defence applications.
National Instruments (18-22%)
National Instruments drives innovation in AI-driven modular test solutions, focusing on semiconductor and industrial automation industries.
Fortive Corporation (12-16%)
Fortive strengthens its position by expanding its modular testing portfolio for automotive and medical device applications.
Viavi Solutions (10-14%)
Viavi Solutions specializes in telecom and network modular testing, investing in next-generation solutions for 5G and fibre optic networks.
Other Key Players (28-40% Combined)
Several companies contribute to market growth with specialized modular instruments:
The overall market size for the Modular Instruments Market was USD 2,119.0 Million in 2025.
The Modular Instruments Market is expected to reach USD 4,574.7 Million in 2035.
The demand is driven by increasing adoption of automated testing solutions, rising demand for high-speed and flexible testing in telecommunications and electronics, advancements in wireless communication technologies, and growing R&D investments in aerospace and defence sectors.
The top 5 countries driving market growth are the USA, UK, Europe, Japan and South Korea.
The PXI (PCI eXtensions for Instrumentation) segment is expected to command a significant share over the assessment period.


Full Research Suite comprises of:
Market outlook & trends analysis
Interviews & case studies
Strategic recommendations
Vendor profiles & capabilities analysis
5-year forecasts
8 regions and 60+ country-level data splits
Market segment data splits
12 months of continuous data updates
DELIVERED AS:
PDF EXCEL ONLINE
Modular Fiber Optical Spectrometers Market Size and Share Forecast Outlook 2025 to 2035
Modular Process Skid Packages Market Forecast and Outlook 2025 to 2035
Modular Robotic Market Size and Share Forecast Outlook 2025 to 2035
Modular Trailer Market Forecast and Outlook 2025 to 2035
Modular Substation Market Size and Share Forecast Outlook 2025 to 2035
Modular Rotary Table Market Size and Share Forecast Outlook 2025 to 2035
Modularised Emulsion Plant Market Size and Share Forecast Outlook 2025 to 2035
Modular Palletizer Cells Market Analysis - Size and Share Forecast Outlook 2025 to 2035
Modular Self-Contained Aisle and Racking Systems Market Size and Share Forecast Outlook 2025 to 2035
Modular Flooring Market Size and Share Forecast Outlook 2025 to 2035
Modular Furniture Market Size and Share Forecast Outlook 2025 to 2035
Modular Fitness Furniture Market Size and Share Forecast Outlook 2025 to 2035
Modular Chillers Market Size and Share Forecast Outlook 2025 to 2035
Modular & Prefabricated Construction Market Size and Share Forecast Outlook 2025 to 2035
Modular Kitchen Baskets Market Size and Share Forecast Outlook 2025 to 2035
Modular Data Center Market Analysis - Size, Share, and Forecast 2025 to 2035
Modular Instrumentation Platform Market Analysis - Size, Share, and Forecast Outlook 2025 to 2035
Modular UPS Market Growth - Trends & Forecast 2025 to 2035
Modular Energy Control System Market Growth – Trends & Forecast 2025 to 2035
Modular Construction Market Growth – Trends & Forecast 2025 to 2035

Thank you!
You will receive an email from our Business Development Manager. Please be sure to check your SPAM/JUNK folder too.
Chat With
MaRIA