Modified Flour Market Size and Share Forecast Outlook 2025 to 2035

The modified flour market is estimated to be worth USD 102.1 billion in 2025, increasing to USD 177.7 billion by 2035, at an approximate CAGR of 5.7%. Growth is being shaped by rising demand for functional, gluten-free, and enzyme-treated flours that offer improved texture, shelf life, and nutritional benefits.
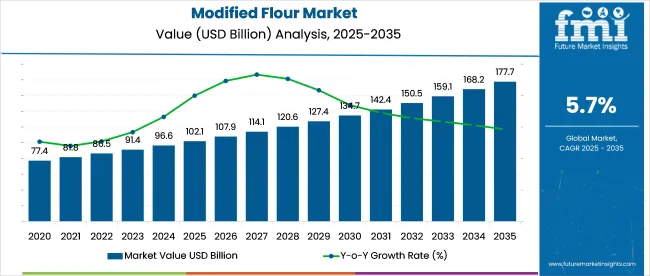
Quick Stats of the Modified Flour Market

  • Market Size (2025): USD 102.1 billion
  • Market Value (2035): USD 177.7 billion
  • Forecast CAGR (2025 to 2035): 5.7%
  • Leading Segment: Bakery and Confectionery (32.5%)
  • Key Growth Region: Asia Pacific (India)
  • Key Players: Cargill, Incorporated, Archer Daniels Midland Company (ADM), Ingredion Incorporated, Tate & Lyle PLC, and Roquette Frères

Modified Flour Market

Metric Value
Industry Value (2025) USD 102.1 billion
Forecast Value (2035) USD 177.7 billion
Global CAGR (2025 to 2035) 5.7%

Powdered and physical-modification formats are being favored due to their processing flexibility, while chemical and enzymatic variants are being adopted for clean-label and performance-driven applications. It is argued that manufacturers investing in microencapsulation, precision fermentation, and AI-enabled formulation will outperform generic millers.

In 2025, Cargill introduced its latest portfolio of modified starches and functional flour blends at the AAHAR trade event in India, highlighting its commitment to delivering ingredient solutions tailored to modern food processing needs. These innovations, including dent corn-based modified starches, are designed to enhance texture, improve stability, and optimize production costs across bakery, snack, and convenience food applications.

The modified flour marketholds a specialized share within its parent markets. In the flour market, it accounts for about 5-7%, as it is a niche segment. Within the food ingredients market, the share is approximately 2-3%, due to its functional use in various food products.

In the baking ingredients market, modified flour represents 6-8%, essential for specific applications like gluten-free and low-carb baking. In the processed food market, its share is around 3-5%, used in convenience foods. In the health and wellness food market, the share is about 2-3%, supporting healthier food options.

Analyzing Modified Flour Market by Top Investment Segments

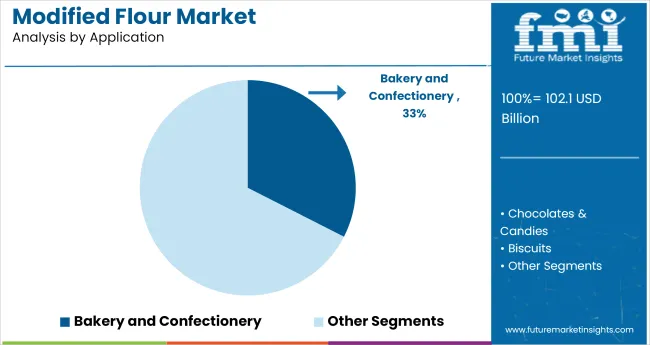
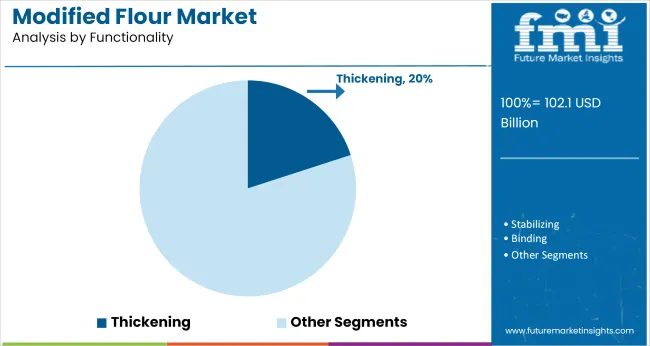
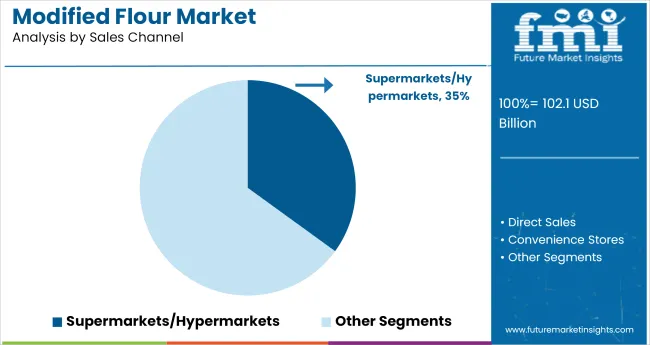
The modified flour market in 2025 will be driven by wheat flour with a 21.1% market share, bakery and confectionery applications capturing 32.5%, thickening functionality at 20%, and supermarkets/hypermarkets leading the sales channel with 35% market share.
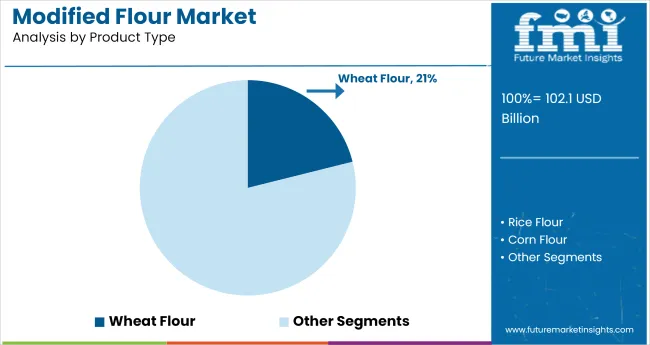
Wheat flour leads product type segment with 21.1% market share

Modified Flour Market Analysis By Product Type

Wheat flour is expected to account for 21.1% of the market share in the modified flour segment by 2025. As a versatile and widely used flour, wheat flour remains the cornerstone for various food applications, especially in bakery products.

Its adaptability in formulations, ease of modification for specific functionality, and widespread availability make it the most popular choice in the modified flour market. The growing demand for customized flour with enhanced properties in food processing applications is also driving the continued dominance of wheat flour.
  • Versatile and widely used in various food applications, particularly bakery products
  • Customizable to meet specific functionality requirements, driving its market dominance
  • Widespread availability and ease of modification support its continued popularity

Bakery and Confectionery applications dominate with 32.5% market share

Modified Flour Market Analysis By Application

The bakery and confectionery sector is projected to capture 32.5% of the market share in 2025. Modified flour plays a critical role in the production of various baked goods and confectionery products, where texture, taste, and shelf life are crucial.

With the rising consumer demand for high-quality baked goods, the demand for specialized flours, such as those modified for improved texture, moisture retention, and dough stability, is growing. Bakery applications, including bread, cakes, and pastries, account for the majority of modified flour usage in the food industry, further strengthening this segment’s leading position.
  • Vital for improving texture, moisture retention, and dough stability in baked goods
  • Rising demand for high-quality baked goods and confectionery fuels segment growth
  • Flour modification enhances shelf life and quality, driving demand in bakery and confectionery

Thickening functionality segment captures 20% market share

Modified Flour Market Analysis By Functionality

Thickening functionality is expected to capture 20% of the market share in 2025, driven by the need for modified flours that enhance the texture and consistency of sauces, gravies, soups, and other culinary products. The ability to provide smooth and consistent viscosity makes thickening agents critical in both food and industrial applications.

As consumers demand more convenience, processed food products utilizing modified flour for thickening purposes continue to rise. This trend, combined with the growing focus on clean-label ingredients, is driving the demand for flours that can deliver high-performance thickening properties without compromising on quality.
  • Used widely in sauces, soups, gravies, and other processed food applications
  • Provides smooth and consistent viscosity, essential for food quality and texture
  • Growing demand for clean-label ingredients boosts the use of modified flour in thickening

Supermarkets/hypermarkets lead sales channel with 35% market share

Modified Flour Market Analysis By Sales Channel

Supermarkets and hypermarkets are projected to capture 35% of the modified flour market share in 2025, making them the leading sales channel. These retail giants offer easy access to a wide range of modified flour products for both consumer use and industrial applications.

The growing trend of home baking and increasing consumer awareness of functional food ingredients further supports the dominance of supermarkets and hypermarkets. Their ability to offer large quantities, product variety, and convenience continues to make them the preferred point of sale for modified flour.

  • Supermarkets and hypermarkets provide easy access to modified flour products
  • Product variety and convenience continue to drive consumer demand in retail outlets
  • The rise in home baking and demand for functional ingredients boosts retail sales

Top Modified Flour Market Dynamics

The modified flour market is expanding due to rising demand for health-conscious and gluten-free food products. However, challenges such as fluctuating raw material prices and production barriers, including limited access to consistent quality ingredients, are limiting broader market growth, particularly for smaller manufacturers.

Rising Demand for Health-Conscious and Gluten-Free Products

The modified flour market is driven by the increasing preference for health-conscious and gluten-free food options. As consumers become more aware of their dietary needs, demand for modified flours, such as those made from legumes, rice, and sorghum, has risen.

These flours offer enhanced nutritional value and better texture for gluten-free products like bread, snacks, and bakery items. The shift towards healthier eating, combined with dietary restrictions, continues to propel the market forward, making modified flour a preferred choice for many consumers.

  • The demand for health-conscious food options is driving modified flour adoption.
  • Gluten-free and allergen-free diets are fueling growth in modified flour usage.
  • Modified flours enhance texture and nutritional value in gluten-free products.

Raw Material Price Instability and Production Barriers

Despite market growth, the modified flour market faces challenges due to fluctuating raw material costs and production barriers. Prices for key ingredients like legumes, grains, and specialty crops can fluctuate based on weather conditions, agricultural output, and global market trends.

These price changes can affect production costs, leading to price volatility for modified flour products. Additionally, complex production processes and limited access to consistent quality raw materials further restrict large-scale production and availability, especially for smaller manufacturers and emerging market players.
  • Fluctuating raw material prices create production cost instability.
  • Limited access to high-quality ingredients hinders large-scale production.
  • Smaller manufacturers face difficulty scaling due to inconsistent raw material availability.

Top Countries Diversifying, Processing, and Scaling Modified Flour Applications

Country Wise Analysis Of Modified Flour Market

Countries CAGR (2025 to 2035)
United States 3.1%
India 6.3%
China 5.9%
Germany 3.9%
Japan 5.5%

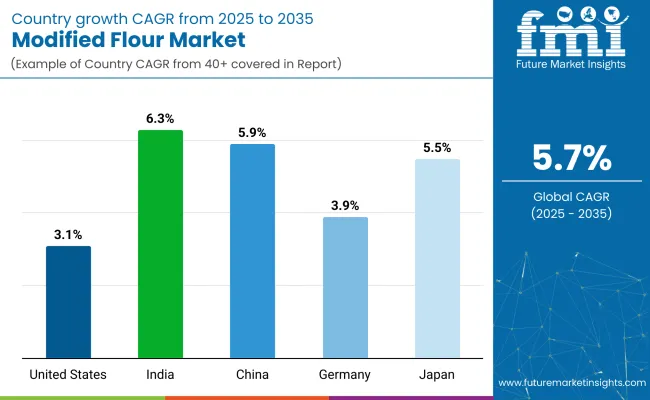
Global modified flour market demand is projected to rise at a 5.7% CAGR from 2025 to 2035. Of the five profiled markets out of 40 covered, India leads at 6.3%, followed by China at 5.9%, and Japan at 5.5%, while the United States posts 3.1% and Germany records 3.9%.

These rates translate to a growth premium of +10% for India, +3% for China, and -32% for the United States versus the baseline, while Germany and Japan show more moderate growth. Divergence reflects local catalysts: increasing demand for functional, health-oriented food ingredients in India and China, while slower growth in the United States and Germany is driven by market maturity and established usage in the food processing industry.

United States Modified Flour Market Outlook

The modified flour market in the United States is forecasted to grow at a 3.1% CAGR from 2025 to 2035. Growth remains tied to demand from foodservice and processed snack categories, with particular focus on thickening agents and gluten-replacement functions.

Manufacturers are targeting clean-label applications, including ready meals, gravies, and bakery mixes, using pregelatinized and enzyme-modified variants. While large-scale adoption persists across institutional and industrial kitchens, consumer-facing growth remains tempered by labeling skepticism and shifting flour substitution trends. Applications in frozen meal stabilization and low-carb bakery formulations are seeing incremental growth due to private label innovation and ingredient consolidation strategies.

  • Corn- and potato-derived modified flours dominate in frozen ready meals and batters
  • FDA labeling rules encourage reformulation with recognized starch bases
  • Local mills supply hydrocolloid-enhanced flour blends to institutional buyers

India Modified Flour Market Growth Analysis

India’s modified flour market is projected to expand at a 6.3% CAGR from 2025 to 2035. The food manufacturing sector continues to adopt modified flour for improving texture, water retention, and shelf life in products such as instant mixes, snacks, and frozen parathas. Domestic processors are incorporating heat-treated and acid-modified flours to improve frying properties and reduce oil uptake.

Packaged food growth across Tier 2 cities is strengthening commercial demand, with multinational food brands localizing product lines to suit Indian taste profiles. Export demand for ready-to-cook products is also contributing to flour modification innovation using native grains.

  • Modified wheat and rice flours are used in dosa mixes, snacks, and sauces
  • Indian FSSAI regulations permit limited use under starch modification norms
  • Contract food processors supply bulk quantities to QSRs and FMCG brands

China Modified Flour Market Overview

China’s modified flour market is expected to grow at a CAGR of 5.9% between 2025 and 2035. Food ingredient manufacturers use modified flour as stabilizers and viscosity enhancers across sauces, desserts, and noodle-based frozen meals. Multinational firms and regional players continue to expand coating and binding applications within snack coatings and processed meats.

Regulatory clarity around food-grade modifiers has allowed broader usage across packaged and convenience food categories. With online grocery formats rising, demand has shifted toward ambient-stable, rehydratable foods that rely heavily on modified flour properties. Export-oriented food factories have also upgraded quality protocols to meet international compliance for flour additives.

  • Potato- and tapioca-based modified flours dominate bakery and instant noodle categories
  • Research parks in Shanghai and Guangdong explore enzymatic modifications for niche foods
  • Chinese CFDA mandates usage caps across categories, driving process standardization

Germany Modified Flour Market Demand Forecast

Germany’s modified flour market is projected to grow at a CAGR of 3.9% from 2025 to 2035. Growth is underpinned by industrial bakery demand, with controlled starch modifications used to enhance dough stability and extend shelf life in frozen and gluten-free breads. Modified flours are incorporated into convenience products such as sauces, ready-to-eat soups, and dairy-alternative beverages.

German ingredient companies are investing in enzymatic and physical flour treatment methods, avoiding chemical modifications due to EU labeling restrictions. Bio-based starch modifiers using native grains like rye and spelt are being integrated to meet formulation flexibility and processing resilience.

  • EU food safety frameworks limit chemical modification pathways in flour applications
  • Modified rice and corn flours support dairy-alternative formulations and shelf-stable soups
  • Ingredient suppliers focus on thermal and enzymatic treatment for clean-label positioning

Japan Modified Flour Market Sales Outlook

Japan’s modified flour market is forecast to grow at a 5.5% CAGR through 2035. Consumer-facing segments rely on modified flour for thickening, binding, and freeze-thaw stability across frozen desserts, instant soups, and ready meals. Japanese processors favor high-performance flour alternatives derived from sweet potatoes and rice, responding to texture-focused consumer preferences.

Modified flour is integrated in smaller batch formulations such as convenience store bento items and cold-prep noodle kits. Due to stringent consumer expectations on mouthfeel and visual consistency, refinements in cross-linked and oxidized flour usage are central to innovation.
  • Japanese F&B companies develop proprietary blends for thermal stability in cold-chain logistics
  • Modified flour-based pancake and ramen mixes see high sales in retail multipacks
  • High-moisture meal kits leverage modified flour to manage separation and viscosity

Leading Modified Flour Market Suppliers

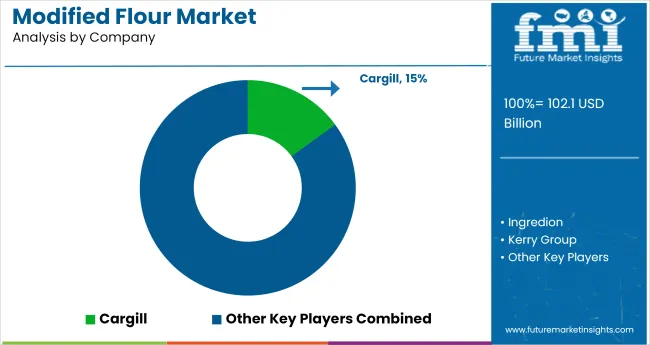
Modified Flour Market Analysis By Company

The global modified flour market is led by Cargill, Incorporated, holding a significant share of approximately 15%.Cargill's extensive portfolio includes modified flours derived from various sources such as wheat, corn, and tapioca, catering to diverse applications in the food and beverage industry.

The company's commitment to innovation and quality has solidified its leadership position in the market.Cargill's strategic initiatives, including research and development investments and global expansion, have further strengthened its market presence.The company's focus on meeting the evolving demands of consumers and food manufacturers has contributed to its sustained growth in the modified flour sector.

Recent Industry Developments

  • In August 2024, Cargill opened a starches and flour blending facility in Pandaan, East Java, to serve APAC markets. The site enhances production of modified starches and sweeteners, enabling localized blends for bakery and confectionery applications across the region.
  • In September 2024, Ingredion launched HOMECRAFT® multi-functional flours made from pulses, rice, and tapioca. Positioned as clean-label alternatives to modified starches, these flours deliver improved texture, stability, and mouthfeel for bakery, dairy, and sauce applications in health-conscious product formulations.

Key Players

  • Cargill
  • Ingredion
  • Kerry Group
  • Tate & Lyle
  • Roquette
  • DuPont (now part of International Flavors & Fragrances Inc.)
  • Bunge
  • Grain Millers
  • MGP Ingredients
  • Corbion
  • AAK
  • The Scoular Company
  • SunOpta
  • AVEBE
  • RCL Foods
  • Tereos
  • Harinera del Valle
  • Glico Nutrition
  • Manildra Group

Report Scope

Report Attributes Details
Market Size (2025) USD 102.1 billion
Market Value (2035) USD 177.7 billion
Forecast CAGR (2025 to 2035) 5.7%
Base Year for Estimation 2024
Historical Period 2020 to 2024
Projections Period 2025 to 2035
Quantitative Units USD billion for value and million tons for volume
Product Type Segmentation Wheat Flour, Rice Flour, Corn Flour, Potato Flour, Tapioca Flour/Starch, Cassava Flour, Soy Flour, Oat Flour, Chickpea Flour, Others
End-Use Segmentation Bakery and Confectionery, Chocolates & Candies, Biscuits, Cakes, Bread and Bread Products, Dairy Products, Infant Formula/Baby Food, Desserts & Smoothies, Instant Food Products, Beverages Processing
Functionality Segmentation Thickening, Stabilizing, Binding, Texture Modification, Moisture Control, Gel Formation, Gluten Modification, Shelf-life Extension
Sales Channel Segmentation Direct Sales, Supermarket/Hypermarket, Convenience Stores, Discount/Dollar Stores, Grocery Stores, Wholesale Stores, Online Retailing
Regions Covered North America, Latin America, Europe, East Asia, South Asia, Oceania, Middle East & Africa
Countries Covered United States, Canada, Mexico, Brazil, Argentina, Germany, France, United Kingdom, Italy, Spain, Netherlands, China, India, Japan, South Korea, Australia, New Zealand, GCC Countries, South Africa
Leading Modified Flour Brands Cargill, Ingredion, Kerry Group, Tate & Lyle, Roquette, DuPont (now part of International Flavors & Fragrances Inc.), Bunge, Grain Millers, MGP Ingredients, Corbion, AAK, The Scoular Company, SunOpta, AVEBE, RCL Foods, Tereos, Harinera del Valle, Glico Nutrition, Manildra Group
Additional Attributes Dollar sales by product type, end-use, and functionality, rising demand for gluten-free and alternative flour products, growing adoption in the food and beverage sector, expanding distribution through supermarkets and online retail, regional trends in food formulation and product development.

Modified Flour Market Analyzed by Key Investment Segments

By Product Type:

Product segmentation includes wheat flour, rice flour, corn flour, potato flour, tapioca flour/starch, cassava flour, soy flour, oat flour, chickpea flour, and others.

By End Use:

End-use categories comprise bakery and confectionery, chocolates & candies, biscuits, cakes, bread and bread products, dairy products, infant formula/baby food, desserts & smoothies, instant food products, and beverages processing.

By Functionality:

Functional attributes include thickening, stabilizing, binding, texture modification, moisture control, gel formation, gluten modification, and shelf-life extension.

By Sales Channel:

Sales channels include direct sales, supermarket/hypermarket, convenience stores, discount/dollar stores, grocery stores, wholesale stores, and online retailing.

By Region:

Regional analysis includes North America, Latin America, Europe, East Asia, South Asia, Oceania, and the Middle East & Africa.

Table of Content

  1. Executive Summary
    • Global Market Outlook
    • Demand-side Trends
    • Supply-side Trends
    • Technology Roadmap Analysis
    • Analysis and Recommendations
  2. Market Overview
    • Market Coverage/Taxonomy
    • Market Definition/Scope/Limitations
  3. Market Background
    • Market Dynamics
      • Drivers
      • Restraints
      • Opportunity
      • Trends
    • Scenario Forecast
      • Demand in Optimistic Scenario
      • Demand in Likely Scenario
      • Demand in Conservative Scenario
    • Opportunity Map Analysis
    • Product Life Cycle Analysis
    • Supply Chain Analysis
      • Supply Side Participants and their Roles
        • Producers
        • Mid-Level Participants (Traders/ Agents/ Brokers)
        • Wholesalers and Distributors
      • Value Added and Value Created at Node in the Supply Chain
      • List of Raw Material Suppliers
      • List of Existing and Potential Buyer’s
    • Investment Feasibility Matrix
    • Value Chain Analysis
      • Profit Margin Analysis
      • Wholesalers and Distributors
      • Retailers
    • PESTLE and Porter’s Analysis
    • Regulatory Landscape
      • By Key Regions
      • By Key Countries
    • Regional Parent Market Outlook
    • Production and Consumption Statistics
    • Import and Export Statistics
  4. Global Market Analysis 2020 to 2024 and Forecast, 2025 to 2035
    • Historical Market Size Value (USD Billion) & Volume (Million Tons) Analysis, 2020 to 2024
    • Current and Future Market Size Value (USD Billion) & Volume (Million Tons) Projections, 2025 to 2035
      • Y-o-Y Growth Trend Analysis
      • Absolute $ Opportunity Analysis
  5. Global Market Pricing Analysis 2020 to 2024 and Forecast 2025 to 2035
  6. Global Market Analysis 2020 to 2024 and Forecast 2025 to 2035, By Product Type
    • Introduction/Key Findings
    • Historical Market Size Value (USD Billion) & Volume (Million Tons) Analysis By Product Type, 2020 to 2024
    • Current and Future Market Size Value (USD Billion) & Volume (Million Tons) Analysis and Forecast By Product Type, 2025 to 2035
      • Wheat Flour
      • Rice Flour
      • Corn Flour
      • Potato Flour
      • Tapioca Flour/Starch
      • Cassava Flour
      • Soy Flour
      • Oat Flour
      • Chickpea Flour
      • Others
    • Y-o-Y Growth Trend Analysis By Product Type, 2020 to 2024
    • Absolute $ Opportunity Analysis By Product Type, 2025 to 2035
  7. Global Market Analysis 2020 to 2024 and Forecast 2025 to 2035, By End Use
    • Introduction/Key Findings
    • Historical Market Size Value (USD Billion) & Volume (Million Tons) Analysis By End Use, 2020 to 2024
    • Current and Future Market Size Value (USD Billion) & Volume (Million Tons) Analysis and Forecast By End Use, 2025 to 2035
      • Bakery and Confectionery
      • Chocolates & Candies
      • Biscuits
      • Cakes
      • Bread and Bread Products
      • Dairy Products
      • Infant Formula/Baby Food
      • Desserts & Smoothies
      • Instant Food Products
      • Beverages Processing
    • Y-o-Y Growth Trend Analysis By End Use, 2020 to 2024
    • Absolute $ Opportunity Analysis By End Use, 2025 to 2035
  8. Global Market Analysis 2020 to 2024 and Forecast 2025 to 2035, By Functionality
    • Introduction/Key Findings
    • Historical Market Size Value (USD Billion) & Volume (Million Tons) Analysis By Functionality, 2020 to 2024
    • Current and Future Market Size Value (USD Billion) & Volume (Million Tons) Analysis and Forecast By Functionality, 2025 to 2035
      • Thickening
      • Stabilizing
      • Binding
      • Texture Modification
      • Moisture Control
      • Gel Formation
      • Gluten Modification
      • Shelf-life Extension
    • Y-o-Y Growth Trend Analysis By Functionality, 2020 to 2024
    • Absolute $ Opportunity Analysis By Functionality, 2025 to 2035
  9. Global Market Analysis 2020 to 2024 and Forecast 2025 to 2035, By Sales Channel
    • Introduction/Key Findings
    • Historical Market Size Value (USD Billion) & Volume (Million Tons) Analysis By Sales Channel, 2020 to 2024
    • Current and Future Market Size Value (USD Billion) & Volume (Million Tons) Analysis and Forecast By Sales Channel, 2025 to 2035
      • Direct Sales
      • Supermarket/Hypermarket
      • Convenience Stores
      • Discount/Dollar Stores
      • Grocery Stores
      • Wholesale Stores
      • Online Retailing
    • Y-o-Y Growth Trend Analysis By Sales Channel, 2020 to 2024
    • Absolute $ Opportunity Analysis By Sales Channel, 2025 to 2035
  10. Global Market Analysis 2020 to 2024 and Forecast 2025 to 2035, By Region
    • Introduction
    • Historical Market Size Value (USD Billion) & Volume (Million Tons) Analysis By Region, 2020 to 2024
    • Current Market Size Value (USD Billion) & Volume (Million Tons) Analysis and Forecast By Region, 2025 to 2035
      • North America
      • Latin America
      • Western Europe
      • Eastern Europe
      • East Asia
      • South Asia & Pacific
      • Middle East and Africa
    • Market Attractiveness Analysis By Region
  11. North America Market Analysis 2020 to 2024 and Forecast 2025 to 2035, By Country
    • Historical Market Size Value (USD Billion) & Volume (Million Tons) Trend Analysis By Market Taxonomy, 2020 to 2024
    • Market Size Value (USD Billion) & Volume (Million Tons) Forecast By Market Taxonomy, 2025 to 2035
      • By Country
        • USA
        • Canada
        • Mexico
      • By Product Type
      • By End Use
      • By Functionality
      • By Sales Channel
    • Market Attractiveness Analysis
      • By Country
      • By Product Type
      • By End Use
      • By Functionality
      • By Sales Channel
    • Key Takeaways
  12. Latin America Market Analysis 2020 to 2024 and Forecast 2025 to 2035, By Country
    • Historical Market Size Value (USD Billion) & Volume (Million Tons) Trend Analysis By Market Taxonomy, 2020 to 2024
    • Market Size Value (USD Billion) & Volume (Million Tons) Forecast By Market Taxonomy, 2025 to 2035
      • By Country
        • Brazil
        • Argentina
        • Rest of LATAM
      • By Product Type
      • By End Use
      • By Functionality
      • By Sales Channel
    • Market Attractiveness Analysis
      • By Country
      • By Product Type
      • By End Use
      • By Functionality
      • By Sales Channel
    • Key Takeaways
  13. Western Europe Market Analysis 2020 to 2024 and Forecast 2025 to 2035, By Country
    • Historical Market Size Value (USD Billion) & Volume (Million Tons) Trend Analysis By Market Taxonomy, 2020 to 2024
    • Market Size Value (USD Billion) & Volume (Million Tons) Forecast By Market Taxonomy, 2025 to 2035
      • By Country
        • Germany
        • Italy
        • France
        • UK
        • Spain
        • BENELUX
        • Nordic
        • Rest of W. Europe
      • By Product Type
      • By End Use
      • By Functionality
      • By Sales Channel
    • Market Attractiveness Analysis
      • By Country
      • By Product Type
      • By End Use
      • By Functionality
      • By Sales Channel
    • Key Takeaways
  14. Eastern Europe Market Analysis 2020 to 2024 and Forecast 2025 to 2035, By Country
    • Historical Market Size Value (USD Billion) & Volume (Million Tons) Trend Analysis By Market Taxonomy, 2020 to 2024
    • Market Size Value (USD Billion) & Volume (Million Tons) Forecast By Market Taxonomy, 2025 to 2035
      • By Country
        • Russia
        • Hungary
        • Poland
        • Balkan & Baltics
        • Rest of E. Europe
      • By Product Type
      • By End Use
      • By Functionality
      • By Sales Channel
    • Market Attractiveness Analysis
      • By Country
      • By Product Type
      • By End Use
      • By Functionality
      • By Sales Channel
    • Key Takeaways
  15. East Asia Market Analysis 2020 to 2024 and Forecast 2025 to 2035, By Country
    • Historical Market Size Value (USD Billion) & Volume (Million Tons) Trend Analysis By Market Taxonomy, 2020 to 2024
    • Market Size Value (USD Billion) & Volume (Million Tons) Forecast By Market Taxonomy, 2025 to 2035
      • By Country
        • China
        • Japan
        • South Korea
      • By Product Type
      • By End Use
      • By Functionality
      • By Sales Channel
    • Market Attractiveness Analysis
      • By Country
      • By Product Type
      • By End Use
      • By Functionality
      • By Sales Channel
    • Key Takeaways
  16. South Asia & Pacific Market Analysis 2020 to 2024 and Forecast 2025 to 2035, By Country
    • Historical Market Size Value (USD Billion) & Volume (Million Tons) Trend Analysis By Market Taxonomy, 2020 to 2024
    • Market Size Value (USD Billion) & Volume (Million Tons) Forecast By Market Taxonomy, 2025 to 2035
      • By Country
        • India
        • Australia & New Zealand
        • ASEAN
        • Rest of SAP
      • By Product Type
      • By End Use
      • By Functionality
      • By Sales Channel
    • Market Attractiveness Analysis
      • By Country
      • By Product Type
      • By End Use
      • By Functionality
      • By Sales Channel
    • Key Takeaways
  17. Middle East and Africa Market Analysis 2020 to 2024 and Forecast 2025 to 2035, By Country
    • Historical Market Size Value (USD Billion) & Volume (Million Tons) Trend Analysis By Market Taxonomy, 2020 to 2024
    • Market Size Value (USD Billion) & Volume (Million Tons) Forecast By Market Taxonomy, 2025 to 2035
      • By Country
        • GCC Countries
        • Northern Africa
        • South Africa
        • Turkiye
        • Rest of MEA
      • By Product Type
      • By End Use
      • By Functionality
      • By Sales Channel
    • Market Attractiveness Analysis
      • By Country
      • By Product Type
      • By End Use
      • By Functionality
      • By Sales Channel
    • Key Takeaways
  18. Key Countries Market Analysis
    • USA
      • Pricing Analysis
      • Market Share Analysis, 2024
        • By Product Type
        • By End Use
        • By Functionality
        • By Sales Channel
    • Canada
      • Pricing Analysis
      • Market Share Analysis, 2024
        • By Product Type
        • By End Use
        • By Functionality
        • By Sales Channel
    • Brazil
      • Pricing Analysis
      • Market Share Analysis, 2024
        • By Product Type
        • By End Use
        • By Functionality
        • By Sales Channel
    • Mexico
      • Pricing Analysis
      • Market Share Analysis, 2024
        • By Product Type
        • By End Use
        • By Functionality
        • By Sales Channel
    • Argentina
      • Pricing Analysis
      • Market Share Analysis, 2024
        • By Product Type
        • By End Use
        • By Functionality
        • By Sales Channel
  19. Market Structure Analysis
    • Competition Dashboard
    • Competition Benchmarking
    • Market Share Analysis of Top Players
      • By Regional
      • By Product Type
      • By End Use
      • By Functionality
      • By Sales Channel
  20. Competition Analysis
    • Competition Deep Dive
      • Cargill
        • Overview
        • Product Portfolio
        • Profitability by Market Segments (Product/Age /Sales Channel/Region)
        • Sales Footprint
        • Strategy Overview
          • Marketing Strategy
          • Product Strategy
          • Channel Strategy
      • Ingredion
        • Overview
        • Product Portfolio
        • Profitability by Market Segments (Product/Age /Sales Channel/Region)
        • Sales Footprint
        • Strategy Overview
          • Marketing Strategy
          • Product Strategy
          • Channel Strategy
      • Kerry Group
        • Overview
        • Product Portfolio
        • Profitability by Market Segments (Product/Age /Sales Channel/Region)
        • Sales Footprint
        • Strategy Overview
          • Marketing Strategy
          • Product Strategy
          • Channel Strategy
      • Tate & Lyle
        • Overview
        • Product Portfolio
        • Profitability by Market Segments (Product/Age /Sales Channel/Region)
        • Sales Footprint
        • Strategy Overview
          • Marketing Strategy
          • Product Strategy
          • Channel Strategy
      • Roquette
        • Overview
        • Product Portfolio
        • Profitability by Market Segments (Product/Age /Sales Channel/Region)
        • Sales Footprint
        • Strategy Overview
          • Marketing Strategy
          • Product Strategy
          • Channel Strategy
      • DuPont (now part of International Flavors & Fragrances Inc.)
        • Overview
        • Product Portfolio
        • Profitability by Market Segments (Product/Age /Sales Channel/Region)
        • Sales Footprint
        • Strategy Overview
          • Marketing Strategy
          • Product Strategy
          • Channel Strategy
      • Bunge
        • Overview
        • Product Portfolio
        • Profitability by Market Segments (Product/Age /Sales Channel/Region)
        • Sales Footprint
        • Strategy Overview
          • Marketing Strategy
          • Product Strategy
          • Channel Strategy
      • Grain Millers
        • Overview
        • Product Portfolio
        • Profitability by Market Segments (Product/Age /Sales Channel/Region)
        • Sales Footprint
        • Strategy Overview
          • Marketing Strategy
          • Product Strategy
          • Channel Strategy
      • MGP Ingredients
        • Overview
        • Product Portfolio
        • Profitability by Market Segments (Product/Age /Sales Channel/Region)
        • Sales Footprint
        • Strategy Overview
          • Marketing Strategy
          • Product Strategy
          • Channel Strategy
      • Corbion
        • Overview
        • Product Portfolio
        • Profitability by Market Segments (Product/Age /Sales Channel/Region)
        • Sales Footprint
        • Strategy Overview
          • Marketing Strategy
          • Product Strategy
          • Channel Strategy
      • AAK
        • Overview
        • Product Portfolio
        • Profitability by Market Segments (Product/Age /Sales Channel/Region)
        • Sales Footprint
        • Strategy Overview
          • Marketing Strategy
          • Product Strategy
          • Channel Strategy
      • The Scoular Company
        • Overview
        • Product Portfolio
        • Profitability by Market Segments (Product/Age /Sales Channel/Region)
        • Sales Footprint
        • Strategy Overview
          • Marketing Strategy
          • Product Strategy
          • Channel Strategy
      • SunOpta
        • Overview
        • Product Portfolio
        • Profitability by Market Segments (Product/Age /Sales Channel/Region)
        • Sales Footprint
        • Strategy Overview
          • Marketing Strategy
          • Product Strategy
          • Channel Strategy
      • AVEBE
        • Overview
        • Product Portfolio
        • Profitability by Market Segments (Product/Age /Sales Channel/Region)
        • Sales Footprint
        • Strategy Overview
          • Marketing Strategy
          • Product Strategy
          • Channel Strategy
      • RCL Foods
        • Overview
        • Product Portfolio
        • Profitability by Market Segments (Product/Age /Sales Channel/Region)
        • Sales Footprint
        • Strategy Overview
          • Marketing Strategy
          • Product Strategy
          • Channel Strategy
      • Tereos
        • Overview
        • Product Portfolio
        • Profitability by Market Segments (Product/Age /Sales Channel/Region)
        • Sales Footprint
        • Strategy Overview
          • Marketing Strategy
          • Product Strategy
          • Channel Strategy
      • Harinera del Valle
        • Overview
        • Product Portfolio
        • Profitability by Market Segments (Product/Age /Sales Channel/Region)
        • Sales Footprint
        • Strategy Overview
          • Marketing Strategy
          • Product Strategy
          • Channel Strategy
      • Glico Nutrition
        • Overview
        • Product Portfolio
        • Profitability by Market Segments (Product/Age /Sales Channel/Region)
        • Sales Footprint
        • Strategy Overview
          • Marketing Strategy
          • Product Strategy
          • Channel Strategy
      • Manildra Group
        • Overview
        • Product Portfolio
        • Profitability by Market Segments (Product/Age /Sales Channel/Region)
        • Sales Footprint
        • Strategy Overview
          • Marketing Strategy
          • Product Strategy
          • Channel Strategy
  21. Assumptions & Acronyms Used
  22. Research Methodology

List of Tables

  • Table 1: Global Market Value (USD Billion) Forecast by Region, 2020-2035
  • Table 2: Global Market Volume (Million Tons) Forecast by Region, 2020-2035
  • Table 3: Global Market Value (USD Billion) Forecast by Product Type, 2020-2035
  • Table 4: Global Market Volume (Million Tons) Forecast by Product Type, 2020-2035
  • Table 5: Global Market Value (USD Billion) Forecast by End Use, 2020-2035
  • Table 6: Global Market Volume (Million Tons) Forecast by End Use, 2020-2035
  • Table 7: Global Market Value (USD Billion) Forecast by Functionality, 2020-2035
  • Table 8: Global Market Volume (Million Tons) Forecast by Functionality, 2020-2035
  • Table 9: Global Market Value (USD Billion) Forecast by Sales Channel, 2020-2035
  • Table 10: Global Market Volume (Million Tons) Forecast by Sales Channel, 2020-2035
  • Table 11: North America Market Value (USD Billion) Forecast by Country, 2020-2035
  • Table 12: North America Market Volume (Million Tons) Forecast by Country, 2020-2035
  • Table 13: North America Market Value (USD Billion) Forecast by Product Type, 2020-2035
  • Table 14: North America Market Volume (Million Tons) Forecast by Product Type, 2020-2035
  • Table 15: North America Market Value (USD Billion) Forecast by End Use, 2020-2035
  • Table 16: North America Market Volume (Million Tons) Forecast by End Use, 2020-2035
  • Table 17: North America Market Value (USD Billion) Forecast by Functionality, 2020-2035
  • Table 18: North America Market Volume (Million Tons) Forecast by Functionality, 2020-2035
  • Table 19: North America Market Value (USD Billion) Forecast by Sales Channel, 2020-2035
  • Table 20: North America Market Volume (Million Tons) Forecast by Sales Channel, 2020-2035
  • Table 21: Latin America Market Value (USD Billion) Forecast by Country, 2020-2035
  • Table 22: Latin America Market Volume (Million Tons) Forecast by Country, 2020-2035
  • Table 23: Latin America Market Value (USD Billion) Forecast by Product Type, 2020-2035
  • Table 24: Latin America Market Volume (Million Tons) Forecast by Product Type, 2020-2035
  • Table 25: Latin America Market Value (USD Billion) Forecast by End Use, 2020-2035
  • Table 26: Latin America Market Volume (Million Tons) Forecast by End Use, 2020-2035
  • Table 27: Latin America Market Value (USD Billion) Forecast by Functionality, 2020-2035
  • Table 28: Latin America Market Volume (Million Tons) Forecast by Functionality, 2020-2035
  • Table 29: Latin America Market Value (USD Billion) Forecast by Sales Channel, 2020-2035
  • Table 30: Latin America Market Volume (Million Tons) Forecast by Sales Channel, 2020-2035
  • Table 31: Western Europe Market Value (USD Billion) Forecast by Country, 2020-2035
  • Table 32: Western Europe Market Volume (Million Tons) Forecast by Country, 2020-2035
  • Table 33: Western Europe Market Value (USD Billion) Forecast by Product Type, 2020-2035
  • Table 34: Western Europe Market Volume (Million Tons) Forecast by Product Type, 2020-2035
  • Table 35: Western Europe Market Value (USD Billion) Forecast by End Use, 2020-2035
  • Table 36: Western Europe Market Volume (Million Tons) Forecast by End Use, 2020-2035
  • Table 37: Western Europe Market Value (USD Billion) Forecast by Functionality, 2020-2035
  • Table 38: Western Europe Market Volume (Million Tons) Forecast by Functionality, 2020-2035
  • Table 39: Western Europe Market Value (USD Billion) Forecast by Sales Channel, 2020-2035
  • Table 40: Western Europe Market Volume (Million Tons) Forecast by Sales Channel, 2020-2035
  • Table 41: Eastern Europe Market Value (USD Billion) Forecast by Country, 2020-2035
  • Table 42: Eastern Europe Market Volume (Million Tons) Forecast by Country, 2020-2035
  • Table 43: Eastern Europe Market Value (USD Billion) Forecast by Product Type, 2020-2035
  • Table 44: Eastern Europe Market Volume (Million Tons) Forecast by Product Type, 2020-2035
  • Table 45: Eastern Europe Market Value (USD Billion) Forecast by End Use, 2020-2035
  • Table 46: Eastern Europe Market Volume (Million Tons) Forecast by End Use, 2020-2035
  • Table 47: Eastern Europe Market Value (USD Billion) Forecast by Functionality, 2020-2035
  • Table 48: Eastern Europe Market Volume (Million Tons) Forecast by Functionality, 2020-2035
  • Table 49: Eastern Europe Market Value (USD Billion) Forecast by Sales Channel, 2020-2035
  • Table 50: Eastern Europe Market Volume (Million Tons) Forecast by Sales Channel, 2020-2035
  • Table 51: East Asia Market Value (USD Billion) Forecast by Country, 2020-2035
  • Table 52: East Asia Market Volume (Million Tons) Forecast by Country, 2020-2035
  • Table 53: East Asia Market Value (USD Billion) Forecast by Product Type, 2020-2035
  • Table 54: East Asia Market Volume (Million Tons) Forecast by Product Type, 2020-2035
  • Table 55: East Asia Market Value (USD Billion) Forecast by End Use, 2020-2035
  • Table 56: East Asia Market Volume (Million Tons) Forecast by End Use, 2020-2035
  • Table 57: East Asia Market Value (USD Billion) Forecast by Functionality, 2020-2035
  • Table 58: East Asia Market Volume (Million Tons) Forecast by Functionality, 2020-2035
  • Table 59: East Asia Market Value (USD Billion) Forecast by Sales Channel, 2020-2035
  • Table 60: East Asia Market Volume (Million Tons) Forecast by Sales Channel, 2020-2035
  • Table 61: South Asia & Pacific Market Value (USD Billion) Forecast by Country, 2020-2035
  • Table 62: South Asia & Pacific Market Volume (Million Tons) Forecast by Country, 2020-2035
  • Table 63: South Asia & Pacific Market Value (USD Billion) Forecast by Product Type, 2020-2035
  • Table 64: South Asia & Pacific Market Volume (Million Tons) Forecast by Product Type, 2020-2035
  • Table 65: South Asia & Pacific Market Value (USD Billion) Forecast by End Use, 2020-2035
  • Table 66: South Asia & Pacific Market Volume (Million Tons) Forecast by End Use, 2020-2035
  • Table 67: South Asia & Pacific Market Value (USD Billion) Forecast by Functionality, 2020-2035
  • Table 68: South Asia & Pacific Market Volume (Million Tons) Forecast by Functionality, 2020-2035
  • Table 69: South Asia & Pacific Market Value (USD Billion) Forecast by Sales Channel, 2020-2035
  • Table 70: South Asia & Pacific Market Volume (Million Tons) Forecast by Sales Channel, 2020-2035
  • Table 71: Middle East and Africa Market Value (USD Billion) Forecast by Country, 2020-2035
  • Table 72: Middle East and Africa Market Volume (Million Tons) Forecast by Country, 2020-2035
  • Table 73: Middle East and Africa Market Value (USD Billion) Forecast by Product Type, 2020-2035
  • Table 74: Middle East and Africa Market Volume (Million Tons) Forecast by Product Type, 2020-2035
  • Table 75: Middle East and Africa Market Value (USD Billion) Forecast by End Use, 2020-2035
  • Table 76: Middle East and Africa Market Volume (Million Tons) Forecast by End Use, 2020-2035
  • Table 77: Middle East and Africa Market Value (USD Billion) Forecast by Functionality, 2020-2035
  • Table 78: Middle East and Africa Market Volume (Million Tons) Forecast by Functionality, 2020-2035
  • Table 79: Middle East and Africa Market Value (USD Billion) Forecast by Sales Channel, 2020-2035
  • Table 80: Middle East and Africa Market Volume (Million Tons) Forecast by Sales Channel, 2020-2035

List of Figures

  • Figure 1: Global Market Volume (Million Tons) Forecast 2020-2035
  • Figure 2: Global Market Pricing Analysis
  • Figure 3: Global Market Value (USD Billion) Forecast 2020-2035
  • Figure 4: Global Market Value Share and BPS Analysis by Product Type, 2025 and 2035
  • Figure 5: Global Market Y-o-Y Growth Comparison by Product Type, 2025-2035
  • Figure 6: Global Market Attractiveness Analysis by Product Type
  • Figure 7: Global Market Value Share and BPS Analysis by End Use, 2025 and 2035
  • Figure 8: Global Market Y-o-Y Growth Comparison by End Use, 2025-2035
  • Figure 9: Global Market Attractiveness Analysis by End Use
  • Figure 10: Global Market Value Share and BPS Analysis by Functionality, 2025 and 2035
  • Figure 11: Global Market Y-o-Y Growth Comparison by Functionality, 2025-2035
  • Figure 12: Global Market Attractiveness Analysis by Functionality
  • Figure 13: Global Market Value Share and BPS Analysis by Sales Channel, 2025 and 2035
  • Figure 14: Global Market Y-o-Y Growth Comparison by Sales Channel, 2025-2035
  • Figure 15: Global Market Attractiveness Analysis by Sales Channel
  • Figure 16: Global Market Value (USD Billion) Share and BPS Analysis by Region, 2025 and 2035
  • Figure 17: Global Market Y-o-Y Growth Comparison by Region, 2025-2035
  • Figure 18: Global Market Attractiveness Analysis by Region
  • Figure 19: North America Market Incremental $ Opportunity, 2025-2035
  • Figure 20: Latin America Market Incremental $ Opportunity, 2025-2035
  • Figure 21: Western Europe Market Incremental $ Opportunity, 2025-2035
  • Figure 22: Eastern Europe Market Incremental $ Opportunity, 2025-2035
  • Figure 23: East Asia Market Incremental $ Opportunity, 2025-2035
  • Figure 24: South Asia & Pacific Market Incremental $ Opportunity, 2025-2035
  • Figure 25: Middle East and Africa Market Incremental $ Opportunity, 2025-2035
  • Figure 26: North America Market Value Share and BPS Analysis by Country, 2025 and 2035
  • Figure 27: North America Market Value Share and BPS Analysis by Product Type, 2025 and 2035
  • Figure 28: North America Market Y-o-Y Growth Comparison by Product Type, 2025-2035
  • Figure 29: North America Market Attractiveness Analysis by Product Type
  • Figure 30: North America Market Value Share and BPS Analysis by End Use, 2025 and 2035
  • Figure 31: North America Market Y-o-Y Growth Comparison by End Use, 2025-2035
  • Figure 32: North America Market Attractiveness Analysis by End Use
  • Figure 33: North America Market Value Share and BPS Analysis by Functionality, 2025 and 2035
  • Figure 34: North America Market Y-o-Y Growth Comparison by Functionality, 2025-2035
  • Figure 35: North America Market Attractiveness Analysis by Functionality
  • Figure 36: North America Market Value Share and BPS Analysis by Sales Channel, 2025 and 2035
  • Figure 37: North America Market Y-o-Y Growth Comparison by Sales Channel, 2025-2035
  • Figure 38: North America Market Attractiveness Analysis by Sales Channel
  • Figure 39: Latin America Market Value Share and BPS Analysis by Country, 2025 and 2035
  • Figure 40: Latin America Market Value Share and BPS Analysis by Product Type, 2025 and 2035
  • Figure 41: Latin America Market Y-o-Y Growth Comparison by Product Type, 2025-2035
  • Figure 42: Latin America Market Attractiveness Analysis by Product Type
  • Figure 43: Latin America Market Value Share and BPS Analysis by End Use, 2025 and 2035
  • Figure 44: Latin America Market Y-o-Y Growth Comparison by End Use, 2025-2035
  • Figure 45: Latin America Market Attractiveness Analysis by End Use
  • Figure 46: Latin America Market Value Share and BPS Analysis by Functionality, 2025 and 2035
  • Figure 47: Latin America Market Y-o-Y Growth Comparison by Functionality, 2025-2035
  • Figure 48: Latin America Market Attractiveness Analysis by Functionality
  • Figure 49: Latin America Market Value Share and BPS Analysis by Sales Channel, 2025 and 2035
  • Figure 50: Latin America Market Y-o-Y Growth Comparison by Sales Channel, 2025-2035
  • Figure 51: Latin America Market Attractiveness Analysis by Sales Channel
  • Figure 52: Western Europe Market Value Share and BPS Analysis by Country, 2025 and 2035
  • Figure 53: Western Europe Market Value Share and BPS Analysis by Product Type, 2025 and 2035
  • Figure 54: Western Europe Market Y-o-Y Growth Comparison by Product Type, 2025-2035
  • Figure 55: Western Europe Market Attractiveness Analysis by Product Type
  • Figure 56: Western Europe Market Value Share and BPS Analysis by End Use, 2025 and 2035
  • Figure 57: Western Europe Market Y-o-Y Growth Comparison by End Use, 2025-2035
  • Figure 58: Western Europe Market Attractiveness Analysis by End Use
  • Figure 59: Western Europe Market Value Share and BPS Analysis by Functionality, 2025 and 2035
  • Figure 60: Western Europe Market Y-o-Y Growth Comparison by Functionality, 2025-2035
  • Figure 61: Western Europe Market Attractiveness Analysis by Functionality
  • Figure 62: Western Europe Market Value Share and BPS Analysis by Sales Channel, 2025 and 2035
  • Figure 63: Western Europe Market Y-o-Y Growth Comparison by Sales Channel, 2025-2035
  • Figure 64: Western Europe Market Attractiveness Analysis by Sales Channel
  • Figure 65: Eastern Europe Market Value Share and BPS Analysis by Country, 2025 and 2035
  • Figure 66: Eastern Europe Market Value Share and BPS Analysis by Product Type, 2025 and 2035
  • Figure 67: Eastern Europe Market Y-o-Y Growth Comparison by Product Type, 2025-2035
  • Figure 68: Eastern Europe Market Attractiveness Analysis by Product Type
  • Figure 69: Eastern Europe Market Value Share and BPS Analysis by End Use, 2025 and 2035
  • Figure 70: Eastern Europe Market Y-o-Y Growth Comparison by End Use, 2025-2035
  • Figure 71: Eastern Europe Market Attractiveness Analysis by End Use
  • Figure 72: Eastern Europe Market Value Share and BPS Analysis by Functionality, 2025 and 2035
  • Figure 73: Eastern Europe Market Y-o-Y Growth Comparison by Functionality, 2025-2035
  • Figure 74: Eastern Europe Market Attractiveness Analysis by Functionality
  • Figure 75: Eastern Europe Market Value Share and BPS Analysis by Sales Channel, 2025 and 2035
  • Figure 76: Eastern Europe Market Y-o-Y Growth Comparison by Sales Channel, 2025-2035
  • Figure 77: Eastern Europe Market Attractiveness Analysis by Sales Channel
  • Figure 78: East Asia Market Value Share and BPS Analysis by Country, 2025 and 2035
  • Figure 79: East Asia Market Value Share and BPS Analysis by Product Type, 2025 and 2035
  • Figure 80: East Asia Market Y-o-Y Growth Comparison by Product Type, 2025-2035
  • Figure 81: East Asia Market Attractiveness Analysis by Product Type
  • Figure 82: East Asia Market Value Share and BPS Analysis by End Use, 2025 and 2035
  • Figure 83: East Asia Market Y-o-Y Growth Comparison by End Use, 2025-2035
  • Figure 84: East Asia Market Attractiveness Analysis by End Use
  • Figure 85: East Asia Market Value Share and BPS Analysis by Functionality, 2025 and 2035
  • Figure 86: East Asia Market Y-o-Y Growth Comparison by Functionality, 2025-2035
  • Figure 87: East Asia Market Attractiveness Analysis by Functionality
  • Figure 88: East Asia Market Value Share and BPS Analysis by Sales Channel, 2025 and 2035
  • Figure 89: East Asia Market Y-o-Y Growth Comparison by Sales Channel, 2025-2035
  • Figure 90: East Asia Market Attractiveness Analysis by Sales Channel
  • Figure 91: South Asia & Pacific Market Value Share and BPS Analysis by Country, 2025 and 2035
  • Figure 92: South Asia & Pacific Market Value Share and BPS Analysis by Product Type, 2025 and 2035
  • Figure 93: South Asia & Pacific Market Y-o-Y Growth Comparison by Product Type, 2025-2035
  • Figure 94: South Asia & Pacific Market Attractiveness Analysis by Product Type
  • Figure 95: South Asia & Pacific Market Value Share and BPS Analysis by End Use, 2025 and 2035
  • Figure 96: South Asia & Pacific Market Y-o-Y Growth Comparison by End Use, 2025-2035
  • Figure 97: South Asia & Pacific Market Attractiveness Analysis by End Use
  • Figure 98: South Asia & Pacific Market Value Share and BPS Analysis by Functionality, 2025 and 2035
  • Figure 99: South Asia & Pacific Market Y-o-Y Growth Comparison by Functionality, 2025-2035
  • Figure 100: South Asia & Pacific Market Attractiveness Analysis by Functionality
  • Figure 101: South Asia & Pacific Market Value Share and BPS Analysis by Sales Channel, 2025 and 2035
  • Figure 102: South Asia & Pacific Market Y-o-Y Growth Comparison by Sales Channel, 2025-2035
  • Figure 103: South Asia & Pacific Market Attractiveness Analysis by Sales Channel
  • Figure 104: Middle East and Africa Market Value Share and BPS Analysis by Country, 2025 and 2035
  • Figure 105: Middle East and Africa Market Value Share and BPS Analysis by Product Type, 2025 and 2035
  • Figure 106: Middle East and Africa Market Y-o-Y Growth Comparison by Product Type, 2025-2035
  • Figure 107: Middle East and Africa Market Attractiveness Analysis by Product Type
  • Figure 108: Middle East and Africa Market Value Share and BPS Analysis by End Use, 2025 and 2035
  • Figure 109: Middle East and Africa Market Y-o-Y Growth Comparison by End Use, 2025-2035
  • Figure 110: Middle East and Africa Market Attractiveness Analysis by End Use
  • Figure 111: Middle East and Africa Market Value Share and BPS Analysis by Functionality, 2025 and 2035
  • Figure 112: Middle East and Africa Market Y-o-Y Growth Comparison by Functionality, 2025-2035
  • Figure 113: Middle East and Africa Market Attractiveness Analysis by Functionality
  • Figure 114: Middle East and Africa Market Value Share and BPS Analysis by Sales Channel, 2025 and 2035
  • Figure 115: Middle East and Africa Market Y-o-Y Growth Comparison by Sales Channel, 2025-2035
  • Figure 116: Middle East and Africa Market Attractiveness Analysis by Sales Channel
  • Figure 117: Global Market - Tier Structure Analysis
  • Figure 118: Global Market - Company Share Analysis

Frequently Asked Questions

What is the projected size of the global modified flour market in 2025?

The projected size of the global modified flour market in 2025 is USD 102.1 billion.

What is the market value of the modified flour market in 2035 and its CAGR?

The market value of the modified flour market in 2035 is USD 177.7 billion, with a CAGR of 5.7%.

Which application dominates the modified flour market?

Bakery and confectionery applications dominate the modified flour market with a 32.5% market share.

Which country will experience the fastest growth in the modified flour market?

India will experience the fastest growth in the modified flour market with a CAGR of 6.3% from 2025 to 2035.

Who is the leading company in the modified flour market?

The leading company in the modified flour market is Cargill, Incorporated, with a 15% market share.

Explore Similar Insights

Future Market Insights

Modified Flour Market