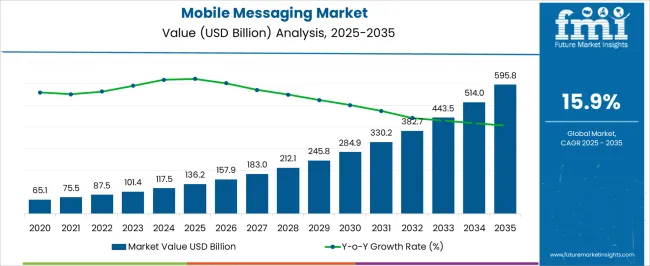
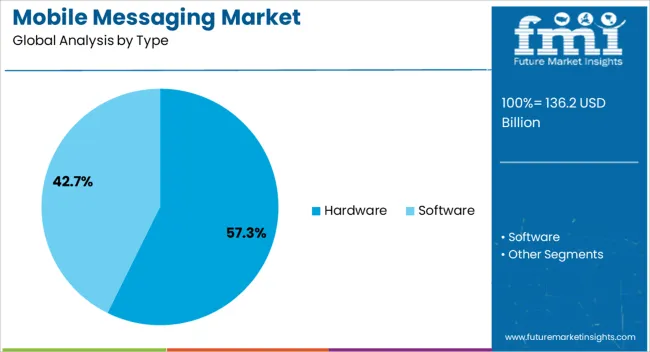
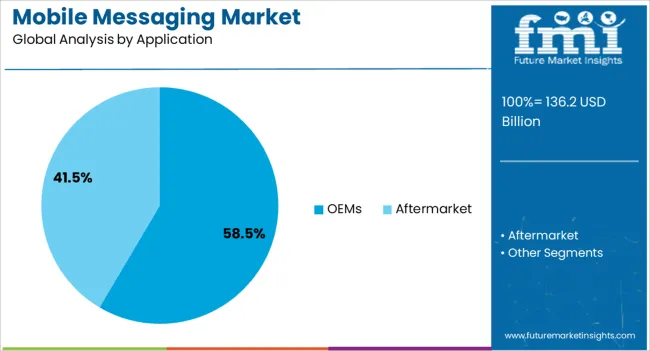
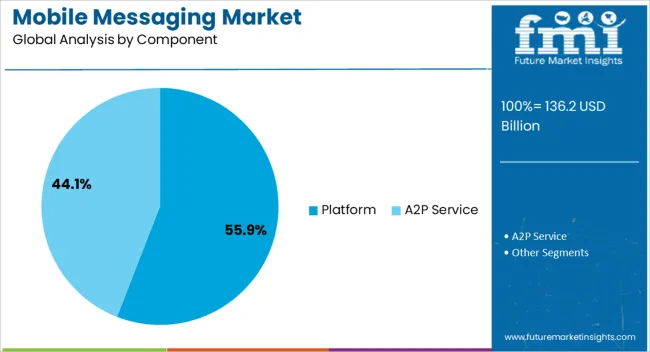
The global mobile messaging market size is set to reach USD 101.41 billion in 2023. Overall sales of mobile messaging are likely to surge at 15.9% CAGR, taking the forecasted market valuation to USD 443.53 billion by the end of 2033.
The market is expected to change rapidly over the years. The key trends that are expected to shape the market are:
Rise of Rich Communication Services (RCS): RCS is a next-generation messaging protocol that aims to replace the traditional SMS protocol. RCS enables advanced features such as read receipts, group chats, high-resolution media sharing, and more.
It also allows businesses to add branding elements, interactive buttons, and rich media to their messages. More mobile carriers and messaging app providers are adopting RCS to enhance the user experience. For example, Google has been pushing RCS adoption through its Android Messages app, which is pre-installed on many Android phones.
Integration with Artificial Intelligence (AI): Messaging apps are increasingly incorporating AI-powered chatbots to provide instant customer support, automate business processes, and deliver personalized content. Chatbots use natural language processing (NLP) and machine learning (ML) to understand user queries and respond with relevant information.
For example, some airlines use chatbots to provide flight updates and help customers rebook flights in case of delays or cancellations. Facebook Messenger has also introduced chatbots that can be integrated with business websites to provide instant customer support.
Growth of Business Messaging: Businesses are leveraging messaging apps to connect with customers in real time, provide customer support, and facilitate transactions. Messaging platforms are adding new features to support business messaging, such as appointment scheduling, payments, and e-commerce.
For example, WhatsApp Business enables small businesses to create a profile, automate text messaging, and respond to customer queries. Facebook Messenger has also introduced tools for businesses to facilitate transactions, such as in-app payments and purchase receipts.
Expansion of Social Messaging: Social messaging apps like WhatsApp, Facebook Messenger, and WeChat are becoming more than just text messaging apps. They are evolving into social media platforms that offer a range of features such as video calls, newsfeeds, stories, and more.
Messaging platforms are also integrating with other social media platforms to provide a seamless user experience. For example, Instagram users can now connect their accounts to Facebook Messenger to send and receive messages from both platforms.
Attributes | Details |
---|---|
Mobile Messaging Market CAGR (2023 to 2033) | 15.9% |
Mobile Messaging Market Size (2023) | USD 101.41 billion |
Mobile Messaging Market Size (2033) | USD 443.53 billion |
According to recent research by Future Market Insights, the mobile messaging market is projected to expand at a rate of 15.9% during the forecast period from 2023 to 2033. The market outlook could be divided into short-term, medium-term, and long-term.
Short term (2023 to 2025): Messaging apps are adding more advanced features such as video calling, file sharing, and group chats. These features provide a richer user experience and make messaging apps more appealing to users. The availability of advanced text messaging features is expected to continue to drive the growth of the mobile messaging market in the short term.
Medium-term (2025 to 2028): Messaging apps are becoming an essential channel for businesses to engage with their customers. Messaging allows for more personalized and targeted communication, helping businesses build stronger relationships with their customers. With the growing importance of customer engagement, messaging apps are expected to continue to play a significant role in the mobile messaging market.
Long-term (2028 to 2033): Chatbots are AI-powered conversational agents that can communicate with users through messaging apps. The integration of chatbots into text messaging apps has opened up new opportunities for businesses to provide better customer service and increase engagement. Chatbots can handle routine inquiries, freeing up customer service agents to handle more complex issues. This trend has driven the growth of chatbots, which is expected to continue in the coming years.
Growing Smartphone Penetration: The number of smartphone users worldwide is expected to reach 3.8 billion in 2021, and this number is projected to grow to over 4.3 billion by 2023. With the increasing availability and affordability of smartphones, more people have access to mobile messenger, driving the demand for mobile messaging.
Need for Instant Communication: People expect to communicate instantly with their contacts, whether it's for personal or business purposes. Mobile text messaging apps provide a convenient and fast way to communicate, especially for real-time conversations. With the popularity of messaging apps, people can stay connected with their contacts from anywhere, at any time.
Shift to Remote Work: The COVID-19 pandemic has accelerated the shift towards remote work, with many employees working from home. Messaging apps have become an essential tool for remote teams to communicate and collaborate effectively. Many businesses are relying on messaging apps to maintain communication with their employees, making the mobile messaging market more critical than ever.
Rise of Social Media: Social media platforms such as Facebook, Instagram, and Twitter have become popular communication channels, especially among younger generations. Messaging apps have evolved to incorporate social media features, making them more appealing to users. This trend has driven the growth of social messaging, which is expected to continue in the coming years.
Increasing Use of Mobile Payments: The growth of mobile payments has created new opportunities for mobile messengers. Many text messaging apps now offer payment features that allow users to transfer money to their contacts without leaving the app. This trend has driven the growth of mobile payments, which is expected to continue to grow in the coming years.
Security Concerns: Messaging apps store sensitive personal information, and as the usage of messaging apps grows, so does the potential for data breaches and privacy violations. This can lead to a loss of trust among users and businesses, resulting in lower adoption rates.
Competition from Established Players: The mobile messenger market is highly competitive, with established players such as WhatsApp, Facebook Messenger, and WeChat dominating the market. It can be challenging for new entrants to gain market share and establish themselves in such a competitive market.
Regulatory Challenges: The mobile messaging market is subject to various regulations related to data privacy, data protection, and content moderation. Complying with these regulations can be challenging and costly for messaging app providers, which may limit their growth potential.
Limited Internet Connectivity: In some parts of the world, internet connectivity is limited, which can limit the adoption of mobile messaging apps. Without access to a stable internet connection, users may not be able to use messaging apps effectively, limiting the market's growth potential in these regions.
Technological Limitations: The market is constantly evolving, with new features and technologies being introduced regularly. Messaging app providers must keep up with these changes and innovate to remain competitive. However, technological limitations, such as device compatibility and network infrastructure, can make it challenging for messaging app providers to offer new and advanced features.
User Retention: The market is highly competitive, and mobile messengers must continuously engage their users to retain them. Messaging apps that fail to provide a compelling user experience risk losing their users to competitors, which can limit their growth potential.
Monetization Challenges: Many messaging apps are free to use, which can make it challenging for messaging app providers to monetize their services. Developing sustainable revenue models can be a significant challenge for messaging app providers, which may limit their growth potential in the long term.
The USA has one of the highest smartphone penetration rates in the world, with around 81% of adults owning a smartphone as of 2021. With the increasing availability and affordability of smartphones, more people have access to text messaging, driving the demand for mobile messaging.
Social media platforms such as Facebook, Instagram, and Twitter have a strong presence in the USA, with high adoption rates among users. Messaging apps have evolved to incorporate social media features, making them more appealing to users. This trend has driven the growth of social messaging in the USA.
The USA mobile messenger market is a highly competitive space with several prominent players. Here are some of the top companies in the US market:
India has the second-largest internet user base in the world, with over 750 million users, according to the Internet and Mobile Association of India (IAMAI). With such a high number of internet users, there is a huge potential for growth in the market.
India's e-commerce market is expected to grow significantly in the coming years. Messaging apps are becoming an essential tool for e-commerce businesses in India to communicate with their customers, provide customer support, and enable transactions.
Top companies in India’s mobile messaging market:
Japan has one of the highest rates of internet penetration in the world, with over 93% of the population using the internet. With such a high number of internet users, there is a huge potential for growth in the market.
Top companies in the Japanese mobile messenger market include:
China has a very large mobile payment market, with companies like Alipay and WeChat Pay dominating the space. Messaging apps in China are integrating mobile payment features into their platforms, which has created new opportunities for businesses to reach customers and for individuals to make transactions.
Social messaging, where mobile messengers incorporate social media features, is becoming more popular in China. This trend has driven the growth of social messaging in the country.
Top companies in the Chinese mobile messenger market include:
The growth potential for the banking and financial institutions vertical in the mobile messaging industry is unparalleled. This is attributed to the surging adoption of business mobility and premium messaging services, which are propelling the expansion of the BFSI sector.
In today's digital age, customer engagement has become a key component in building brand loyalty, and the BFSI sector is no exception. With the proliferation of mobile messaging solutions, financial institutions can now communicate with customers in real-time, providing them with transaction data, retail banking activities, and support for their financial needs.
The increasing number of internet users and the widespread use of smartphones have heightened the demand for prompt and efficient customer service. This trend is driving the explosive growth of mobile messaging in the BFSI industry, enabling financial institutions to build stronger relationships with their customers and stay ahead of the competition.
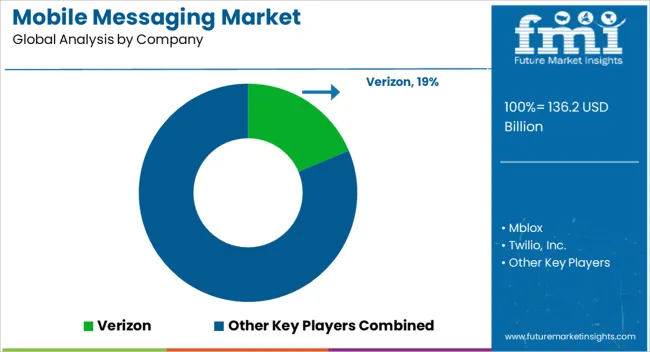
The mobile messaging market is highly competitive, and the market players have adopted various strategies to gain a larger market share. Here are a few examples:
Table 1: Global Market Value (US$ Million) Forecast by Region, 2018 to 2033
Table 2: Global Market Value (US$ Million) Forecast by Type, 2018 to 2033
Table 3: Global Market Value (US$ Million) Forecast by Component, 2018 to 2033
Table 4: Global Market Value (US$ Million) Forecast by Deployment Mode, 2018 to 2033
Table 5: Global Market Value (US$ Million) Forecast by End User, 2018 to 2033
Table 6: North America Market Value (US$ Million) Forecast by Country, 2018 to 2033
Table 7: North America Market Value (US$ Million) Forecast by Type, 2018 to 2033
Table 8: North America Market Value (US$ Million) Forecast by Component, 2018 to 2033
Table 9: North America Market Value (US$ Million) Forecast by Deployment Mode, 2018 to 2033
Table 10: North America Market Value (US$ Million) Forecast by End User, 2018 to 2033
Table 11: Latin America Market Value (US$ Million) Forecast by Country, 2018 to 2033
Table 12: Latin America Market Value (US$ Million) Forecast by Type, 2018 to 2033
Table 13: Latin America Market Value (US$ Million) Forecast by Component, 2018 to 2033
Table 14: Latin America Market Value (US$ Million) Forecast by Deployment Mode, 2018 to 2033
Table 15: Latin America Market Value (US$ Million) Forecast by End User, 2018 to 2033
Table 16: Europe Market Value (US$ Million) Forecast by Country, 2018 to 2033
Table 17: Europe Market Value (US$ Million) Forecast by Type, 2018 to 2033
Table 18: Europe Market Value (US$ Million) Forecast by Component, 2018 to 2033
Table 19: Europe Market Value (US$ Million) Forecast by Deployment Mode, 2018 to 2033
Table 20: Europe Market Value (US$ Million) Forecast by End User, 2018 to 2033
Table 21: South Asia Market Value (US$ Million) Forecast by Country, 2018 to 2033
Table 22: South Asia Market Value (US$ Million) Forecast by Type, 2018 to 2033
Table 23: South Asia Market Value (US$ Million) Forecast by Component, 2018 to 2033
Table 24: South Asia Market Value (US$ Million) Forecast by Deployment Mode, 2018 to 2033
Table 25: South Asia Market Value (US$ Million) Forecast by End User, 2018 to 2033
Table 26: East Asia Market Value (US$ Million) Forecast by Country, 2018 to 2033
Table 27: East Asia Market Value (US$ Million) Forecast by Type, 2018 to 2033
Table 28: East Asia Market Value (US$ Million) Forecast by Component, 2018 to 2033
Table 29: East Asia Market Value (US$ Million) Forecast by Deployment Mode, 2018 to 2033
Table 30: East Asia Market Value (US$ Million) Forecast by End User, 2018 to 2033
Table 31: Oceania Market Value (US$ Million) Forecast by Country, 2018 to 2033
Table 32: Oceania Market Value (US$ Million) Forecast by Type, 2018 to 2033
Table 33: Oceania Market Value (US$ Million) Forecast by Component, 2018 to 2033
Table 34: Oceania Market Value (US$ Million) Forecast by Deployment Mode, 2018 to 2033
Table 35: Oceania Market Value (US$ Million) Forecast by End User, 2018 to 2033
Table 36: MEA Market Value (US$ Million) Forecast by Country, 2018 to 2033
Table 37: MEA Market Value (US$ Million) Forecast by Type, 2018 to 2033
Table 38: MEA Market Value (US$ Million) Forecast by Component, 2018 to 2033
Table 39: MEA Market Value (US$ Million) Forecast by Deployment Mode, 2018 to 2033
Table 40: MEA Market Value (US$ Million) Forecast by End User, 2018 to 2033
Figure 1: Global Market Value (US$ Million) by Type, 2023 to 2033
Figure 2: Global Market Value (US$ Million) by Component, 2023 to 2033
Figure 3: Global Market Value (US$ Million) by Deployment Mode, 2023 to 2033
Figure 4: Global Market Value (US$ Million) by End User, 2023 to 2033
Figure 5: Global Market Value (US$ Million) by Region, 2023 to 2033
Figure 6: Global Market Value (US$ Million) Analysis by Region, 2018 to 2033
Figure 7: Global Market Value Share (%) and BPS Analysis by Region, 2023 to 2033
Figure 8: Global Market Y-o-Y Growth (%) Projections by Region, 2023 to 2033
Figure 9: Global Market Value (US$ Million) Analysis by Type, 2018 to 2033
Figure 10: Global Market Value Share (%) and BPS Analysis by Type, 2023 to 2033
Figure 11: Global Market Y-o-Y Growth (%) Projections by Type, 2023 to 2033
Figure 12: Global Market Value (US$ Million) Analysis by Component, 2018 to 2033
Figure 13: Global Market Value Share (%) and BPS Analysis by Component, 2023 to 2033
Figure 14: Global Market Y-o-Y Growth (%) Projections by Component, 2023 to 2033
Figure 15: Global Market Value (US$ Million) Analysis by Deployment Mode, 2018 to 2033
Figure 16: Global Market Value Share (%) and BPS Analysis by Deployment Mode, 2023 to 2033
Figure 17: Global Market Y-o-Y Growth (%) Projections by Deployment Mode, 2023 to 2033
Figure 18: Global Market Value (US$ Million) Analysis by End User, 2018 to 2033
Figure 19: Global Market Value Share (%) and BPS Analysis by End User, 2023 to 2033
Figure 20: Global Market Y-o-Y Growth (%) Projections by End User, 2023 to 2033
Figure 21: Global Market Attractiveness by Type, 2023 to 2033
Figure 22: Global Market Attractiveness by Component, 2023 to 2033
Figure 23: Global Market Attractiveness by Deployment Mode, 2023 to 2033
Figure 24: Global Market Attractiveness by End User, 2023 to 2033
Figure 25: Global Market Attractiveness by Region, 2023 to 2033
Figure 26: North America Market Value (US$ Million) by Type, 2023 to 2033
Figure 27: North America Market Value (US$ Million) by Component, 2023 to 2033
Figure 28: North America Market Value (US$ Million) by Deployment Mode, 2023 to 2033
Figure 29: North America Market Value (US$ Million) by End User, 2023 to 2033
Figure 30: North America Market Value (US$ Million) by Country, 2023 to 2033
Figure 31: North America Market Value (US$ Million) Analysis by Country, 2018 to 2033
Figure 32: North America Market Value Share (%) and BPS Analysis by Country, 2023 to 2033
Figure 33: North America Market Y-o-Y Growth (%) Projections by Country, 2023 to 2033
Figure 34: North America Market Value (US$ Million) Analysis by Type, 2018 to 2033
Figure 35: North America Market Value Share (%) and BPS Analysis by Type, 2023 to 2033
Figure 36: North America Market Y-o-Y Growth (%) Projections by Type, 2023 to 2033
Figure 37: North America Market Value (US$ Million) Analysis by Component, 2018 to 2033
Figure 38: North America Market Value Share (%) and BPS Analysis by Component, 2023 to 2033
Figure 39: North America Market Y-o-Y Growth (%) Projections by Component, 2023 to 2033
Figure 40: North America Market Value (US$ Million) Analysis by Deployment Mode, 2018 to 2033
Figure 41: North America Market Value Share (%) and BPS Analysis by Deployment Mode, 2023 to 2033
Figure 42: North America Market Y-o-Y Growth (%) Projections by Deployment Mode, 2023 to 2033
Figure 43: North America Market Value (US$ Million) Analysis by End User, 2018 to 2033
Figure 44: North America Market Value Share (%) and BPS Analysis by End User, 2023 to 2033
Figure 45: North America Market Y-o-Y Growth (%) Projections by End User, 2023 to 2033
Figure 46: North America Market Attractiveness by Type, 2023 to 2033
Figure 47: North America Market Attractiveness by Component, 2023 to 2033
Figure 48: North America Market Attractiveness by Deployment Mode, 2023 to 2033
Figure 49: North America Market Attractiveness by End User, 2023 to 2033
Figure 50: North America Market Attractiveness by Country, 2023 to 2033
Figure 51: Latin America Market Value (US$ Million) by Type, 2023 to 2033
Figure 52: Latin America Market Value (US$ Million) by Component, 2023 to 2033
Figure 53: Latin America Market Value (US$ Million) by Deployment Mode, 2023 to 2033
Figure 54: Latin America Market Value (US$ Million) by End User, 2023 to 2033
Figure 55: Latin America Market Value (US$ Million) by Country, 2023 to 2033
Figure 56: Latin America Market Value (US$ Million) Analysis by Country, 2018 to 2033
Figure 57: Latin America Market Value Share (%) and BPS Analysis by Country, 2023 to 2033
Figure 58: Latin America Market Y-o-Y Growth (%) Projections by Country, 2023 to 2033
Figure 59: Latin America Market Value (US$ Million) Analysis by Type, 2018 to 2033
Figure 60: Latin America Market Value Share (%) and BPS Analysis by Type, 2023 to 2033
Figure 61: Latin America Market Y-o-Y Growth (%) Projections by Type, 2023 to 2033
Figure 62: Latin America Market Value (US$ Million) Analysis by Component, 2018 to 2033
Figure 63: Latin America Market Value Share (%) and BPS Analysis by Component, 2023 to 2033
Figure 64: Latin America Market Y-o-Y Growth (%) Projections by Component, 2023 to 2033
Figure 65: Latin America Market Value (US$ Million) Analysis by Deployment Mode, 2018 to 2033
Figure 66: Latin America Market Value Share (%) and BPS Analysis by Deployment Mode, 2023 to 2033
Figure 67: Latin America Market Y-o-Y Growth (%) Projections by Deployment Mode, 2023 to 2033
Figure 68: Latin America Market Value (US$ Million) Analysis by End User, 2018 to 2033
Figure 69: Latin America Market Value Share (%) and BPS Analysis by End User, 2023 to 2033
Figure 70: Latin America Market Y-o-Y Growth (%) Projections by End User, 2023 to 2033
Figure 71: Latin America Market Attractiveness by Type, 2023 to 2033
Figure 72: Latin America Market Attractiveness by Component, 2023 to 2033
Figure 73: Latin America Market Attractiveness by Deployment Mode, 2023 to 2033
Figure 74: Latin America Market Attractiveness by End User, 2023 to 2033
Figure 75: Latin America Market Attractiveness by Country, 2023 to 2033
Figure 76: Europe Market Value (US$ Million) by Type, 2023 to 2033
Figure 77: Europe Market Value (US$ Million) by Component, 2023 to 2033
Figure 78: Europe Market Value (US$ Million) by Deployment Mode, 2023 to 2033
Figure 79: Europe Market Value (US$ Million) by End User, 2023 to 2033
Figure 80: Europe Market Value (US$ Million) by Country, 2023 to 2033
Figure 81: Europe Market Value (US$ Million) Analysis by Country, 2018 to 2033
Figure 82: Europe Market Value Share (%) and BPS Analysis by Country, 2023 to 2033
Figure 83: Europe Market Y-o-Y Growth (%) Projections by Country, 2023 to 2033
Figure 84: Europe Market Value (US$ Million) Analysis by Type, 2018 to 2033
Figure 85: Europe Market Value Share (%) and BPS Analysis by Type, 2023 to 2033
Figure 86: Europe Market Y-o-Y Growth (%) Projections by Type, 2023 to 2033
Figure 87: Europe Market Value (US$ Million) Analysis by Component, 2018 to 2033
Figure 88: Europe Market Value Share (%) and BPS Analysis by Component, 2023 to 2033
Figure 89: Europe Market Y-o-Y Growth (%) Projections by Component, 2023 to 2033
Figure 90: Europe Market Value (US$ Million) Analysis by Deployment Mode, 2018 to 2033
Figure 91: Europe Market Value Share (%) and BPS Analysis by Deployment Mode, 2023 to 2033
Figure 92: Europe Market Y-o-Y Growth (%) Projections by Deployment Mode, 2023 to 2033
Figure 93: Europe Market Value (US$ Million) Analysis by End User, 2018 to 2033
Figure 94: Europe Market Value Share (%) and BPS Analysis by End User, 2023 to 2033
Figure 95: Europe Market Y-o-Y Growth (%) Projections by End User, 2023 to 2033
Figure 96: Europe Market Attractiveness by Type, 2023 to 2033
Figure 97: Europe Market Attractiveness by Component, 2023 to 2033
Figure 98: Europe Market Attractiveness by Deployment Mode, 2023 to 2033
Figure 99: Europe Market Attractiveness by End User, 2023 to 2033
Figure 100: Europe Market Attractiveness by Country, 2023 to 2033
Figure 101: South Asia Market Value (US$ Million) by Type, 2023 to 2033
Figure 102: South Asia Market Value (US$ Million) by Component, 2023 to 2033
Figure 103: South Asia Market Value (US$ Million) by Deployment Mode, 2023 to 2033
Figure 104: South Asia Market Value (US$ Million) by End User, 2023 to 2033
Figure 105: South Asia Market Value (US$ Million) by Country, 2023 to 2033
Figure 106: South Asia Market Value (US$ Million) Analysis by Country, 2018 to 2033
Figure 107: South Asia Market Value Share (%) and BPS Analysis by Country, 2023 to 2033
Figure 108: South Asia Market Y-o-Y Growth (%) Projections by Country, 2023 to 2033
Figure 109: South Asia Market Value (US$ Million) Analysis by Type, 2018 to 2033
Figure 110: South Asia Market Value Share (%) and BPS Analysis by Type, 2023 to 2033
Figure 111: South Asia Market Y-o-Y Growth (%) Projections by Type, 2023 to 2033
Figure 112: South Asia Market Value (US$ Million) Analysis by Component, 2018 to 2033
Figure 113: South Asia Market Value Share (%) and BPS Analysis by Component, 2023 to 2033
Figure 114: South Asia Market Y-o-Y Growth (%) Projections by Component, 2023 to 2033
Figure 115: South Asia Market Value (US$ Million) Analysis by Deployment Mode, 2018 to 2033
Figure 116: South Asia Market Value Share (%) and BPS Analysis by Deployment Mode, 2023 to 2033
Figure 117: South Asia Market Y-o-Y Growth (%) Projections by Deployment Mode, 2023 to 2033
Figure 118: South Asia Market Value (US$ Million) Analysis by End User, 2018 to 2033
Figure 119: South Asia Market Value Share (%) and BPS Analysis by End User, 2023 to 2033
Figure 120: South Asia Market Y-o-Y Growth (%) Projections by End User, 2023 to 2033
Figure 121: South Asia Market Attractiveness by Type, 2023 to 2033
Figure 122: South Asia Market Attractiveness by Component, 2023 to 2033
Figure 123: South Asia Market Attractiveness by Deployment Mode, 2023 to 2033
Figure 124: South Asia Market Attractiveness by End User, 2023 to 2033
Figure 125: South Asia Market Attractiveness by Country, 2023 to 2033
Figure 126: East Asia Market Value (US$ Million) by Type, 2023 to 2033
Figure 127: East Asia Market Value (US$ Million) by Component, 2023 to 2033
Figure 128: East Asia Market Value (US$ Million) by Deployment Mode, 2023 to 2033
Figure 129: East Asia Market Value (US$ Million) by End User, 2023 to 2033
Figure 130: East Asia Market Value (US$ Million) by Country, 2023 to 2033
Figure 131: East Asia Market Value (US$ Million) Analysis by Country, 2018 to 2033
Figure 132: East Asia Market Value Share (%) and BPS Analysis by Country, 2023 to 2033
Figure 133: East Asia Market Y-o-Y Growth (%) Projections by Country, 2023 to 2033
Figure 134: East Asia Market Value (US$ Million) Analysis by Type, 2018 to 2033
Figure 135: East Asia Market Value Share (%) and BPS Analysis by Type, 2023 to 2033
Figure 136: East Asia Market Y-o-Y Growth (%) Projections by Type, 2023 to 2033
Figure 137: East Asia Market Value (US$ Million) Analysis by Component, 2018 to 2033
Figure 138: East Asia Market Value Share (%) and BPS Analysis by Component, 2023 to 2033
Figure 139: East Asia Market Y-o-Y Growth (%) Projections by Component, 2023 to 2033
Figure 140: East Asia Market Value (US$ Million) Analysis by Deployment Mode, 2018 to 2033
Figure 141: East Asia Market Value Share (%) and BPS Analysis by Deployment Mode, 2023 to 2033
Figure 142: East Asia Market Y-o-Y Growth (%) Projections by Deployment Mode, 2023 to 2033
Figure 143: East Asia Market Value (US$ Million) Analysis by End User, 2018 to 2033
Figure 144: East Asia Market Value Share (%) and BPS Analysis by End User, 2023 to 2033
Figure 145: East Asia Market Y-o-Y Growth (%) Projections by End User, 2023 to 2033
Figure 146: East Asia Market Attractiveness by Type, 2023 to 2033
Figure 147: East Asia Market Attractiveness by Component, 2023 to 2033
Figure 148: East Asia Market Attractiveness by Deployment Mode, 2023 to 2033
Figure 149: East Asia Market Attractiveness by End User, 2023 to 2033
Figure 150: East Asia Market Attractiveness by Country, 2023 to 2033
Figure 151: Oceania Market Value (US$ Million) by Type, 2023 to 2033
Figure 152: Oceania Market Value (US$ Million) by Component, 2023 to 2033
Figure 153: Oceania Market Value (US$ Million) by Deployment Mode, 2023 to 2033
Figure 154: Oceania Market Value (US$ Million) by End User, 2023 to 2033
Figure 155: Oceania Market Value (US$ Million) by Country, 2023 to 2033
Figure 156: Oceania Market Value (US$ Million) Analysis by Country, 2018 to 2033
Figure 157: Oceania Market Value Share (%) and BPS Analysis by Country, 2023 to 2033
Figure 158: Oceania Market Y-o-Y Growth (%) Projections by Country, 2023 to 2033
Figure 159: Oceania Market Value (US$ Million) Analysis by Type, 2018 to 2033
Figure 160: Oceania Market Value Share (%) and BPS Analysis by Type, 2023 to 2033
Figure 161: Oceania Market Y-o-Y Growth (%) Projections by Type, 2023 to 2033
Figure 162: Oceania Market Value (US$ Million) Analysis by Component, 2018 to 2033
Figure 163: Oceania Market Value Share (%) and BPS Analysis by Component, 2023 to 2033
Figure 164: Oceania Market Y-o-Y Growth (%) Projections by Component, 2023 to 2033
Figure 165: Oceania Market Value (US$ Million) Analysis by Deployment Mode, 2018 to 2033
Figure 166: Oceania Market Value Share (%) and BPS Analysis by Deployment Mode, 2023 to 2033
Figure 167: Oceania Market Y-o-Y Growth (%) Projections by Deployment Mode, 2023 to 2033
Figure 168: Oceania Market Value (US$ Million) Analysis by End User, 2018 to 2033
Figure 169: Oceania Market Value Share (%) and BPS Analysis by End User, 2023 to 2033
Figure 170: Oceania Market Y-o-Y Growth (%) Projections by End User, 2023 to 2033
Figure 171: Oceania Market Attractiveness by Type, 2023 to 2033
Figure 172: Oceania Market Attractiveness by Component, 2023 to 2033
Figure 173: Oceania Market Attractiveness by Deployment Mode, 2023 to 2033
Figure 174: Oceania Market Attractiveness by End User, 2023 to 2033
Figure 175: Oceania Market Attractiveness by Country, 2023 to 2033
Figure 176: MEA Market Value (US$ Million) by Type, 2023 to 2033
Figure 177: MEA Market Value (US$ Million) by Component, 2023 to 2033
Figure 178: MEA Market Value (US$ Million) by Deployment Mode, 2023 to 2033
Figure 179: MEA Market Value (US$ Million) by End User, 2023 to 2033
Figure 180: MEA Market Value (US$ Million) by Country, 2023 to 2033
Figure 181: MEA Market Value (US$ Million) Analysis by Country, 2018 to 2033
Figure 182: MEA Market Value Share (%) and BPS Analysis by Country, 2023 to 2033
Figure 183: MEA Market Y-o-Y Growth (%) Projections by Country, 2023 to 2033
Figure 184: MEA Market Value (US$ Million) Analysis by Type, 2018 to 2033
Figure 185: MEA Market Value Share (%) and BPS Analysis by Type, 2023 to 2033
Figure 186: MEA Market Y-o-Y Growth (%) Projections by Type, 2023 to 2033
Figure 187: MEA Market Value (US$ Million) Analysis by Component, 2018 to 2033
Figure 188: MEA Market Value Share (%) and BPS Analysis by Component, 2023 to 2033
Figure 189: MEA Market Y-o-Y Growth (%) Projections by Component, 2023 to 2033
Figure 190: MEA Market Value (US$ Million) Analysis by Deployment Mode, 2018 to 2033
Figure 191: MEA Market Value Share (%) and BPS Analysis by Deployment Mode, 2023 to 2033
Figure 192: MEA Market Y-o-Y Growth (%) Projections by Deployment Mode, 2023 to 2033
Figure 193: MEA Market Value (US$ Million) Analysis by End User, 2018 to 2033
Figure 194: MEA Market Value Share (%) and BPS Analysis by End User, 2023 to 2033
Figure 195: MEA Market Y-o-Y Growth (%) Projections by End User, 2023 to 2033
Figure 196: MEA Market Attractiveness by Type, 2023 to 2033
Figure 197: MEA Market Attractiveness by Component, 2023 to 2033
Figure 198: MEA Market Attractiveness by Deployment Mode, 2023 to 2033
Figure 199: MEA Market Attractiveness by End User, 2023 to 2033
Figure 200: MEA Market Attractiveness by Country, 2023 to 2033
Through 2033, the Mobile Messaging Market is projected to develop at a CAGR of 15.9%.
In 2023, the market is expected to attain USD 101.41 billion.
By 2033, the industry is to have expanded to USD 443.53 billion.
The demand gets driven up as mobile subscribers are steadily rising in number.
Text-based mobile marketing is acquiring popularity.
Data security and privacy issues limit the growth of the mobile messaging market.
Explore Similar Insights
Thank you!
You will receive an email from our Business Development Manager. Please be sure to check your SPAM/JUNK folder too.