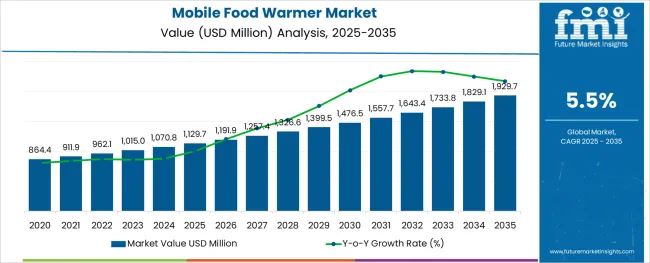
The Mobile Food Warmer Market is estimated to be valued at USD 1129.7 million in 2025 and is projected to reach USD 1929.7 million by 2035, registering a compound annual growth rate (CAGR) of 5.5% over the forecast period.
The alginic acid market is undergoing consistent growth, propelled by rising demand from food processing, pharmaceutical formulations, and cosmetic applications. A growing focus on natural and sustainable ingredients in manufacturing processes has positioned alginic acid as a preferred biopolymer across industries.
The market is further supported by its diverse functional benefits, including water retention, gelling, and stabilizing properties, which make it indispensable in high-performance formulations. Increased regulatory acceptance of alginates as safe additives and the push towards cleaner labeling in food and personal care products have reinforced their adoption.
Ongoing innovation in extraction technologies and the utilization of algae as a renewable resource are paving the way for cost-effective production and expanded applications, ensuring sustained market expansion in the coming years.
The market is segmented by Type, Buyer Type, and Sales Channel and region. By Type, the market is divided into Countertop, Chest Type Standalone, and Upright Standalone. In terms of Buyer Type, the market is classified into Commercial and Household. Based on Sales Channel, the market is segmented into Direct Procurement, Distributor Sales, eCommerce Platforms, and Other Channels. Regionally, the market is classified into North America, Latin America, Western Europe, Eastern Europe, Balkan & Baltic Countries, Russia & Belarus, Central Asia, East Asia, South Asia & Pacific, and the Middle East & Africa.
The market is segmented by Type, Buyer Type, and Sales Channel and region. By Type, the market is divided into Countertop, Chest Type Standalone, and Upright Standalone. In terms of Buyer Type, the market is classified into Commercial and Household. Based on Sales Channel, the market is segmented into Direct Procurement, Distributor Sales, eCommerce Platforms, and Other Channels. Regionally, the market is classified into North America, Latin America, Western Europe, Eastern Europe, Balkan & Baltic Countries, Russia & Belarus, Central Asia, East Asia, South Asia & Pacific, and the Middle East & Africa.
When segmented by salts, sodium alginate is expected to command 27.5% of the market revenue in 2025, marking it as the leading subsegment in this category. This leadership has been driven by its superior solubility, ease of incorporation into formulations, and versatility in a wide range of applications.
Its ability to form stable gels and maintain viscosity under varying conditions has made it highly sought after in both food and pharmaceutical sectors. Manufacturers have prioritized sodium alginate due to its consistent performance, cost-effectiveness, and regulatory acceptance, which have collectively strengthened its position.
The segment’s prominence has also been enhanced by its adaptability to evolving consumer preferences for plant-derived and sustainable ingredients, reinforcing its market share.
Segmented by end user industry, the food industry is projected to hold 33.0% of the market revenue in 2025, positioning it as the most prominent sector. This dominance has been shaped by the industry’s increasing reliance on alginic acid and its derivatives to deliver desirable textures, stabilize emulsions, and improve shelf life of processed foods.
As consumer demand for clean label and natural additives has intensified, the food sector has responded by integrating alginates into bakery, dairy, and confectionery products. Enhanced production efficiency and compliance with food safety standards have further encouraged widespread use.
The segment’s leadership has also been supported by product differentiation strategies where alginates contribute to premium quality and innovation, securing their role in modern food formulations.
When analyzed by functionality, thickening agents are forecast to account for 29.0% of the market revenue in 2025, establishing themselves as the dominant functional category. This preeminence has been underpinned by the growing need for consistent texture and viscosity in a wide array of end products.
Alginic acid’s natural origin and high efficiency in creating uniform, stable thickness without altering taste or color have solidified its appeal. The demand for thickeners in both edible and topical applications has expanded, with manufacturers leveraging its rheological properties to meet performance and regulatory requirements.
The functionality’s leading share has also been reinforced by the ability to deliver cost savings through lower dosages and its compatibility with other ingredients, securing its position as an indispensable component in formulation strategies.
Mobile food warmer is becoming increasingly popular around the world. The main reason for its rising popularity is that mobile food warmer provide consumers with a high level of convenience.
Mobile food warmer are a necessary investment on a commercial scale, but the popularity of residential mobile food warmer is changing the dynamics of the mobile food warmer market.
According to the FDA, hot foods should be kept at an internal temperature of 140 °F or higher to prevent bacteria from growing on them and to provide a satiating experience to consumers.
The growing popularity of outdoor kitchens and modern kitchens has also contributed to an increase in demand for mobile food warmer.
The irregularity in market structure caused by counterfeit products is a major challenge for the mobile food warmer market. Another impediment to the otherwise expanding mobile food warmer market is the lack of space in small kitchens.
Food-warming drawers take up a lot of space and should be avoided in small kitchens. Asian kitchens are small and compact, and mobile food warmers cannot be accommodated without sacrificing shelf space.
With individuals' lifestyles quickly evolving and manufacturers' substantial investment in Research and Development (R&D) facilities, the mobile food warmer market players are able to provide products that meet the needs and requirements of customers.
Knowledge and experience have helped individuals in coming up with solutions in all sectors, reducing the size of equipment and components and making them readily available in a wide range of sizes, impacting the mobile food warmer market growth.
As a result, these are factors that are predicted to recommence to start opening potentially lucrative opportunities for both major players and emerging players in the mobile food warmer market.
The emergence of companies and manufacturing techniques leads to a lower carbon footprint, which significantly reduces product prices, offering opportunities for the mobile food warmer market. These factors are also predicted to maintain the mobile food warmer market shifting forward.
The root cause of the mobile food warmer market is technological product innovation. Manufacturers in the mobile food warmer market are planning to introduce advanced features to meet all of the needs of consumers.
For example, the CookTek SinAqua Souper induction warmer detects when the soup needs to be stirred. The product includes a timer and a caution if the pan becomes dry. Smart homes and smart kitchen appliances are anticipated to increase dramatically over the forecast period.
Holiday shoppers are thinking about comfort foods. A mobile food warmer is a kitchen appliance that provides numerous benefits when used. A mobile food warmer makes it easier for customers to stick to their diet plans.
This mobile food warmer is available in a variety of sizes and features to meet the diverse needs of the global consumer base.
For example, a food warmer unit with adjustable temperature makes it simple to achieve the best food cooking process, whereas one with a timer function makes it simple to achieve the best results while cooking food.
Similarly, automatic temperature control gives consumers complete control over the food warming process.
North America emerged as the largest market in the mobile food warmer market during the forecast period, accounting for the highest revenue share. North American revenue growth is primarily attributed to the advancement of new technologies and industrial sectors.
North American countries, particularly developed economies, show the greatest potential for mobile food warmer market.
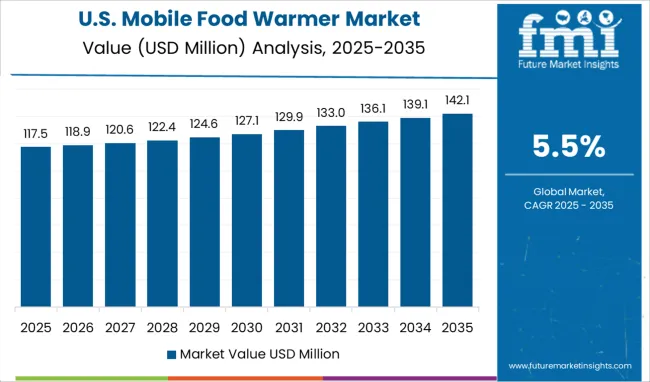
The mobile food warmer market in the United States is predicted to be worth USD 1929.7 Million by 2035, with a CAGR of 5.9% during the forecast period (2025 to 2035). Individuals who are completely enthralled by innovative products constitute a sizable segment of the population, and as a result, countries tend to dominate the mobile food warmer market.
United States economies are strong, allowing customers to purchase products at low prices with additional services, resulting in a high adoption rate and increased volume of sales of mobile food warmer as well as escalating the demand for mobile food warmer.
Most Americans are constantly on the move and appear to be on the run. The majority of people are driving to and from work, rushing from one appointment to the next, picking up children, and attending business meetings and social gatherings. Such a mobile lifestyle emphasizes the significance of mobile food warmer and defines the growing demand for mobile food warmer.
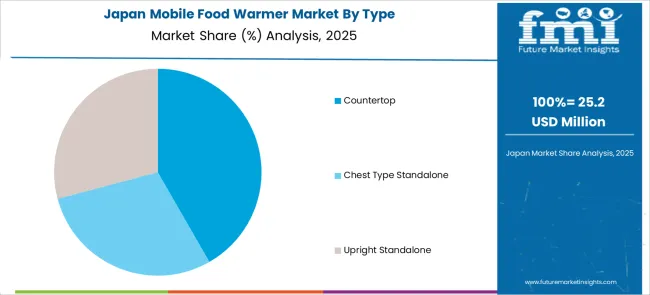
The Japan mobile food warmer market is projected to be worth USD 1929.7 million by 2035, growing at a 5.6% CAGR during the forecast period (2025 to 2035). Over the forecast period, the Japan mobile food warmer market is anticipated to expand at the fastest CAGR.
People's increasing urbanization and preference for appliances that simplify their lives in each and every way are also pushing the sales of mobile food warmer.
The affordability and convenience of the portable water warmer have an effective persuasive strength that incentivizes customers to purchase it, which leads to higher sales of mobile food warmer along with boosting the mobile food warmer market adoption trends.
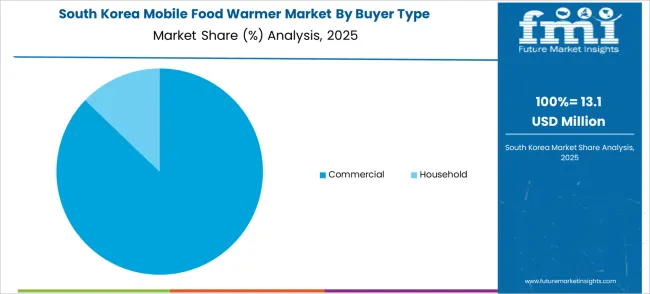
The mobile food warmer market in South Korea is expected to reach USD 60.55 million by 2035, with a CAGR of 4.3% during the forecast period (2025 to 2035). Metal warming trays are commonly used in food service establishments.
The reason for this is that restaurants, hotels, and catering companies require food service equipment that can withstand heavy use.
The Asian food service market is expanding, and the South Korean mobile food warmer market is following suit along with ramping up the mobile food warmer market trends.
The China mobile food warmer market is estimated to be worth USD 259.5 million by 2035, registering a CAGR of 7% over the forecast period (2025 to 2035).
The European industries operate on a pre-designed infrastructure, allowing them to focus on customer satisfaction and experience.
Manufacturers relied heavily on Europe regions to supply raw materials for production, but with changing norms since the outbreak of Coronavirus, mobile food warmer market players are investing in product production and development, creating new opportunities for the mobile food warmer market.
The mobile food warmer market in the United Kingdom is expected to be worth USD 1929.7 million by 2035, with a CAGR of 5.5% during the forecast period (2025 to 2035).
Another factor driving sales of mobile food warmer is the consistently changing preferences of individuals' lifestyles and inclination toward appliances that ease every aspect of their daily lives. The portable water warmer's affordability and convenience have a strong persuasive power, which encourages customers to buy it, increasing sales of mobile food warmer.
Mobile food warmer outperform microwaves because they do not leave spots behind like microwaves do. Furthermore, food warmers never overheat the food and come in two models: electric and digital. Many mobile baby food warmer machines include a built-in sterilizer that can clean baby bottles, increasing consumer convenience.
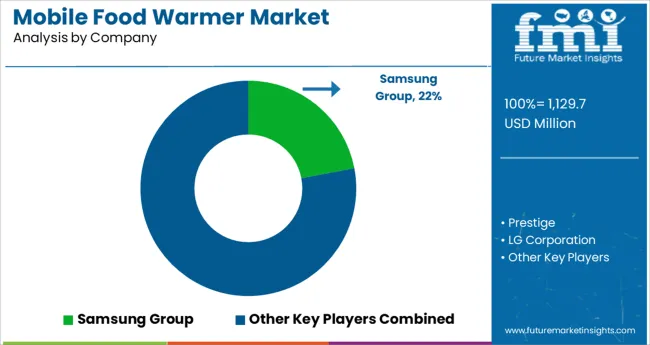
The global market for mobile food warmer is expanding at a rapid pace. Mobile food warmer market manufacturers are increasingly focusing on innovative solutions with advanced efficiency and feature in order to limit the risk factors associated with mobile food warmer and enable faster and more effective operation.
Before entering the mobile food warmer market, new companies must carefully consider all of these factors.
Due to mobile food warmer market growth in technological innovations, mobile food warmer market competition, and mergers and acquisitions, a large number of domestic and regional vendors are offering specific products for different end-users.
The competition in the mobile food warmer market is being driven by innovative designs and technological advancements within the category. Manufacturers are incorporating high-end features into their product offerings in order to gain a competitive advantage.
Siemens, for example, sells a warming drawer that is ideal for pre-warming dishes, keeping foods hot for a longer period of time, and low-temperature cooking, all of which contribute to greater convenience and flexibility in the kitchen.
Recent Development:
The global mobile food warmer market is estimated to be valued at USD 1,129.7 million in 2025.
It is projected to reach USD 1,929.7 million by 2035.
The market is expected to grow at a 5.5% CAGR between 2025 and 2035.
The key product types are countertop, chest type standalone and upright standalone.
commercial segment is expected to dominate with a 68.0% industry share in 2025.


Our Research Products

The "Full Research Suite" delivers actionable market intel, deep dives on markets or technologies, so clients act faster, cut risk, and unlock growth.

The Leaderboard benchmarks and ranks top vendors, classifying them as Established Leaders, Leading Challengers, or Disruptors & Challengers.

Locates where complements amplify value and substitutes erode it, forecasting net impact by horizon

We deliver granular, decision-grade intel: market sizing, 5-year forecasts, pricing, adoption, usage, revenue, and operational KPIs—plus competitor tracking, regulation, and value chains—across 60 countries broadly.

Spot the shifts before they hit your P&L. We track inflection points, adoption curves, pricing moves, and ecosystem plays to show where demand is heading, why it is changing, and what to do next across high-growth markets and disruptive tech

Real-time reads of user behavior. We track shifting priorities, perceptions of today’s and next-gen services, and provider experience, then pace how fast tech moves from trial to adoption, blending buyer, consumer, and channel inputs with social signals (#WhySwitch, #UX).

Partner with our analyst team to build a custom report designed around your business priorities. From analysing market trends to assessing competitors or crafting bespoke datasets, we tailor insights to your needs.
Supplier Intelligence
Discovery & Profiling
Capacity & Footprint
Performance & Risk
Compliance & Governance
Commercial Readiness
Who Supplies Whom
Scorecards & Shortlists
Playbooks & Docs
Category Intelligence
Definition & Scope
Demand & Use Cases
Cost Drivers
Market Structure
Supply Chain Map
Trade & Policy
Operating Norms
Deliverables
Buyer Intelligence
Account Basics
Spend & Scope
Procurement Model
Vendor Requirements
Terms & Policies
Entry Strategy
Pain Points & Triggers
Outputs
Pricing Analysis
Benchmarks
Trends
Should-Cost
Indexation
Landed Cost
Commercial Terms
Deliverables
Brand Analysis
Positioning & Value Prop
Share & Presence
Customer Evidence
Go-to-Market
Digital & Reputation
Compliance & Trust
KPIs & Gaps
Outputs
Full Research Suite comprises of:
Market outlook & trends analysis
Interviews & case studies
Strategic recommendations
Vendor profiles & capabilities analysis
5-year forecasts
8 regions and 60+ country-level data splits
Market segment data splits
12 months of continuous data updates
DELIVERED AS:
PDF EXCEL ONLINE
Mobile Camping Toilet Market Size and Share Forecast Outlook 2025 to 2035
Mobile Phone Screen Underlayer Cushioning Material Market Size and Share Forecast Outlook 2025 to 2035
Mobile Application Store Market Size and Share Forecast Outlook 2025 to 2035
Mobile Money Market Forecast and Outlook 2025 to 2035
Mobile Application Testing Solution Market Size and Share Forecast Outlook 2025 to 2035
Mobile Cardiac Telemetry System Market Size and Share Forecast Outlook 2025 to 2035
Mobile Robots Market Size and Share Forecast Outlook 2025 to 2035
Mobile Crane Market Size and Share Forecast Outlook 2025 to 2035
Mobile Vascular Imaging Market Size and Share Forecast Outlook 2025 to 2035
Mobile Animal Inhalation Anesthesia Machine Market Size and Share Forecast Outlook 2025 to 2035
Mobile Unified Communications and Collaboration (UC&C) Solution Market Size and Share Forecast Outlook 2025 to 2035
Mobile Data Protection Market Size and Share Forecast Outlook 2025 to 2035
Mobile Medical Tablets Market Size and Share Forecast Outlook 2025 to 2035
Mobile WLAN Access Points Market Size and Share Forecast Outlook 2025 to 2035
Mobile Social Networks Market Size and Share Forecast Outlook 2025 to 2035
Mobile Printer Market Size and Share Forecast Outlook 2025 to 2035
Mobile Application Development Platform Market Size and Share Forecast Outlook 2025 to 2035
Mobile Threat Management Security Software Market Size and Share Forecast Outlook 2025 to 2035
Mobile Broadband Infrastructure Market Size and Share Forecast Outlook 2025 to 2035
Mobile Enterprise Application Development Platform Market Size and Share Forecast Outlook 2025 to 2035

Thank you!
You will receive an email from our Business Development Manager. Please be sure to check your SPAM/JUNK folder too.
Chat With
MaRIA