Mobile Bottling Line Market Outlook (2023 to 2033)

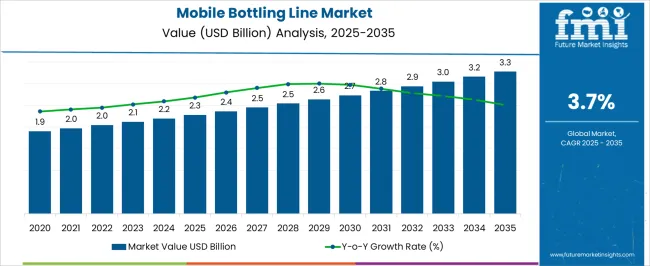
The market for mobile bottling lines is expected to grow at a CAGR of 3.7% over the estimated period of 2023 to 2033. The industry value is expected to grow from US$ 2,121.1 Mn in 2023 to US$ 3,050.3 Million in 2033. The global market is likely to be worth US$ 2,045.4 million by the end of 2022.

A mobile bottling line is a system that is used to bottle beverages on the go. This type of system is often used by companies that produce beverages such as beer or soda, in large quantities. Mobile bottling lines are also used by some wineries to fill glass bottles in bulk.

Mobile bottling lines typically consist of a series of conveyor belts and filling machines. The conveyor belts transport the empty bottles to filling machines, where they are filled with the beverage. These filled bottles are then transported to a labeling machine, where they are labeled and packaged for sale.

As modern-day consumers prefer single grab-and-go products rather than traditional bulk-buying products owing to their rising focus on convenience, key beverage companies are aiming to provide eco-friendly packaging and shelf-stable innovations. Their innovations include products made with fewer chemicals and preservatives, as well as clean and renewable materials.

A few other companies are constantly innovating and enhancing their existing product line to come up with something for every consumer. Rising awareness of health across the globe is compelling key beverage manufacturers to include low-sugar, low-calorie, and natural ingredients in their products. The majority of these manufacturers are nowadays moving away from synthetic or conventional sweeteners to stevia sweeteners to expand their client base.

High demand for on-the-go drinks in both developing and developed countries is projected to propel sales of mobile bottling lines in the next ten years. In addition, key players are changing the packaging of their products by developing vibrant and creative solutions to sell their beverages to those consumers looking for healthy products, as well as those facing a time crunch. Thus, the increasing need for convenience is pushing sales of ready-to-drink beverages, which would positively affect the mobile bottling line industry.

Attributes Key Insights
Global Mobile Bottling Line Market Estimated Size (2023E) US$ 2,121.1 Million
Projected Market Valuation (2033F) US$ 3,050.3 Million
Value-based CAGR (2023 to 2033) 3.7%
Collective Share of the US, Germany, Japan, and Australia 70.8%

Don't pay for what you don't need

Customize your report by selecting specific countries or regions and save 30%!

2018 to 2022 Mobile Bottling Line Market Outlook Compared to 2023 to 2033 Demand Forecast

The global market for mobile bottling lines increased from US$ 1,702.1 million in 2018 to US$ 2,045.4 Million in 2022. The market exhibited considerable growth at a CAGR of 4.7% during the historical period from 2018 to 2022.

The historical outlook of the mobile bottling line industry has been positive, but future projections are even more optimistic. With the increasing demand for mobile bottling lines, the market is growing rapidly.

In the next ten years, the mobile bottling line industry is expected to grow significantly. This growth is expected to be driven by factors such as the increasing popularity of bottled beverages and the need for more efficient & convenient packaging solutions. These factors would further help provide growth opportunities to new and existing players in the market to capitalize on.

Market-o-nomics - Highlighting the Key Trends

Various factors are responsible for propelling growth in the mobile bottling line industry. Lead analysts at Future Market Insights have conducted extensive research work to find out upcoming trends, threats, growth opportunities, driving factors, obstacles, and recent developments that can affect the market in the given time frame.

The drivers, restraints, opportunities, and threats (DROTs) identified are as follows:

DRIVERS

  • The emergence of carbonated soft drinks that act as functional beverages, especially for health-conscious consumers, would fuel sales.
  • Surging demand for soft drinks and non-alcoholic beverages that are low in sugar and have stress-relieving properties would augment growth.

RESTRAINTS

  • As proper maintenance of bottling line equipment is required for ensuring continued productivity and maximizing investments, it involves high-cost spending.
  • In piston-filling machines, pistons are used to pump the beverage and the process may often reduce the overall speed, which can affect growth.

OPPORTUNITIES

  • Key companies are expected to create new pump-filling machines that have interchangeable parts, which are easy to customize and upgrade.
  • Demand for gravity-filling machines is set to surge as a wide variety of low-viscosity fluids can be bottled in these.

THREATS

  • As overflow filling machines are limited to only low-viscosity liquids, their demand may decline.
  • Companies manufacturing fruit-based beverages with chunky materials may face complexities with pump-filling machines as they do not process them well.
Nandini Roy Choudhury

Principal Consultant

Talk to Analyst

Find your sweet spots for generating winning opportunities in this market.

Country-wise Insights

Why is the Demand for Mobile Bottling Lines Evolving in the USA?

USA-based Mobile Bottling and Canning Line Companies to Engage in Mergers & Acquisitions

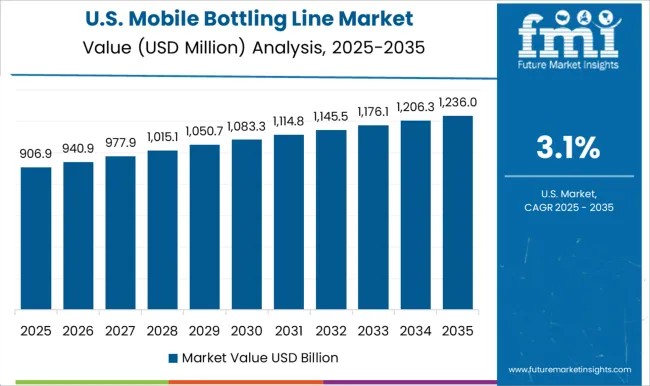
The US is set to account for 38.6% of the North American market share and is projected to surpass a valuation of US$ 818.7 Million in 2023. In recent years, the US mobile bottling line market has seen significant changes.

The most notable change has been a consolidation of the industry. There have been several large mergers and acquisitions among mobile bottling line manufacturers across the country. This consolidation has led to a smaller number of suppliers in the market and has further allowed remaining suppliers to increase their market shares.

Why is the UK Exhibiting Immense Popularity of Mobile Bottling Lines?

Manufacturing Facility Expansions by Bottling Line Process Firms to Push Sales in the UK

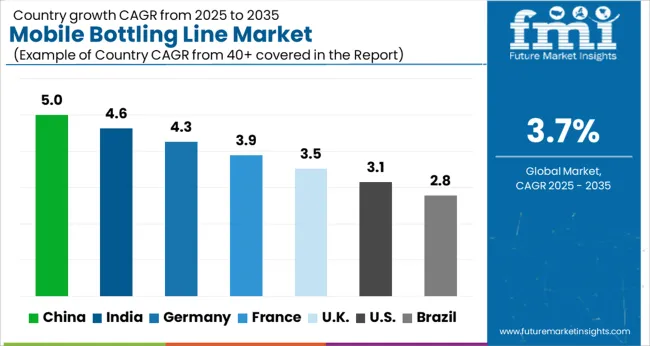
The UK mobile bottling line industry is anticipated to grow at 5.8% CAGR between 2023 and 2033. The country has a long tradition of manufacturing and exporting such products. In recent years, there has been an increasing demand for these products due to the growth of the craft beer industry.

Various UK-based companies have responded to this surging demand by investing in new manufacturing facilities and expanding the existing ones. This has allowed the UK to become one of the leading suppliers of mobile bottling lines in the world.

Why is India Set to Emerge as a Leading Mobile Bottling Line Manufacturing Hub?

High Demand for Bottled Water in India to Propel Sales of Bottling Plant Equipment

The India mobile bottling line industry is anticipated to grow at 5.8% CAGR between 2023 and 2033. The mobile bottling line sector in India is expected to continue to grow at a steady pace in the next ten years. This is because the demand for bottled water and other beverages is expected to increase across the country. Mobile bottling lines are an ideal way to bottle large quantities of beverages quickly and efficiently.

Why Would China Exhibit a Strong Position in the Mobile Bottling Line Industry?

Government Support to Chinese Bottling Line Machine Manufacturers Would Aid Growth

The China mobile bottling line industry is likely to exhibit growth at 6.5% CAGR between 2023 and 2033. China has a strong position in the mobile bottling line sector due to a large number of reasons.

Firstly, China has a large population which provides a ready market for mobile bottling lines. Secondly, Chinese manufacturers are able to produce mobile bottling lines at relatively lower prices compared to their foreign counterparts. This makes them attractive to cost-conscious buyers.

Thirdly, China has a well-developed infrastructure which makes it easy for manufacturers to transport mobile bottling lines around the country. Lastly, the Chinese government is supportive of businesses and provides various incentives for companies to set up their facilities in the country.
Will Germany Provide Lucrative Opportunities to Mobile Bottling Line Firms?

Constant Innovations by German Bottling Line Manufacturers to Bode Well by 2033

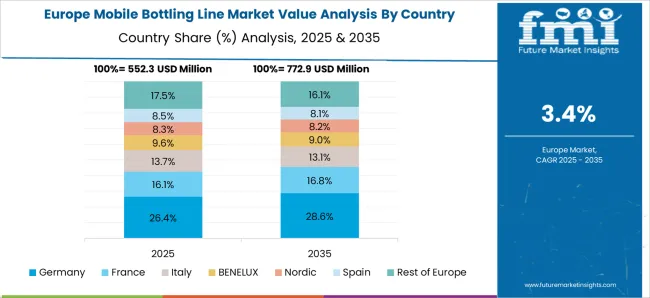
Germany is anticipated to hold a 22.6% share of the global mobile bottling line market by 2022 and hold a value of US$ 479.4 Million. In the mobile bottling line market, Germany is known for its innovative and efficient production processes.

The country has a long history of successful product development and implementation. In the mobile bottling line market, Germany's innovation is in its ability to produce large quantities of high-quality products in a short amount of time. The country has a reputation for being able to meet the unmet needs of customers quickly and efficiently.

Category-wise Insights

Which Type of Automation is Expected to Showcase High Popularity?

Demand for Automatic Bottling Plant Equipment to Skyrocket across the Globe

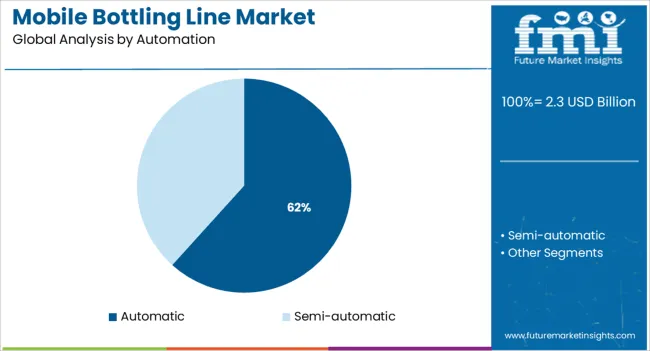
Based on automation, the market for mobile bottling lines is divided into semi-automatic and automatic. Out of these, the automatic segment is projected to remain at the forefront throughout the speculated time frame. This type of mobile bottling line is operated with minimal human intervention. Thus, their demand would skyrocket among beverage manufacturing companies that produce commodities in bulk.

Which is the Highly Preferred Capacity of Mobile Bottling Lines?

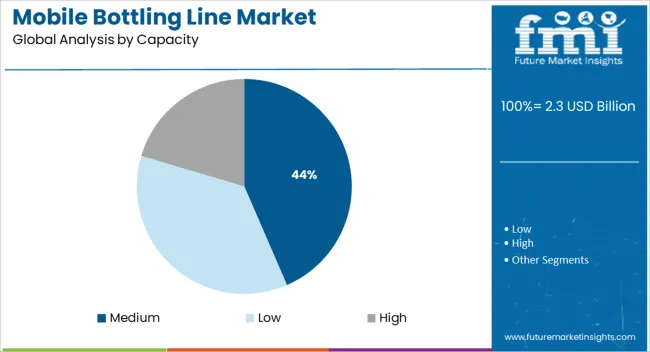
Majority of the Companies to Prefer Medium Capacity Bottling and Canning Lines

Based on capacity, the global market is segmented into low capacity, medium capacity, and high capacity. Low-capacity mobile bottling lines are suitable for companies with lower production output. These machines have a compact design and are easy to install & operate. They occupy less floor space and less manpower, as compared to the other two types.

Medium-capacity mobile bottling lines are designed for companies with higher production output. These machines have high speed and can handle more products at a time. They occupy more floor space and require more manpower, as compared to low-capacity machines. Demand for these machines is likely to grow at a fast pace among bottled water manufacturing firms.

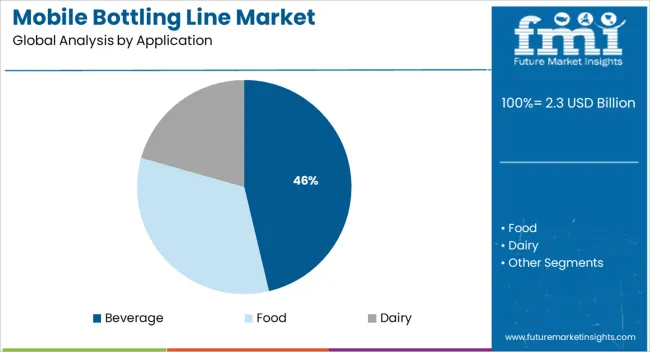
Which is the Dominant Application of Mobile Bottling Lines?

Bottling Machine Lines Are to be Extensively Utilized by Beverage Manufacturing Companies

There are many industries that have a use for mobile bottling lines. The beverage industry is one that has a major use for this type of equipment. There are various benefits of using a mobile bottling line in the beverage industry.

One of the benefits of the beverage industry is that it can help to speed up the production process. This is because mobile bottling lines can be used to bottle products quickly and efficiently. This can also help to save time and money in the production process.

Another benefit of using a mobile bottling line in the beverage industry is that it can help to improve the quality of products that are being manufactured. This is because mobile bottling lines can be used to ensure that products are bottled correctly and securely. This can also help to prevent numerous problems associated with products being contaminated or leakage during transport.
Get the data you need at a Fraction of the cost

Personalize your report by choosing insights you need
and save 40%!

Competitive Landscape

Competition in the mobile bottling line market is intense as renowned companies are trying to gain a larger share of the overall industry. In today's business world, mobile bottling lines are becoming more and more popular. With advancements in technology, these bottling lines are able to be set up faster and easier than ever before. There are different companies that offer mobile bottling lines and beverage bottles with advanced features.

For instance:

  • In November 2022, PepsiCo joined hands with Northern Bottling Company to install a high-speed, high-volume carbonated soft drinks (CSD) line with high demand for soft drinks in Pakistan. It has a capacity of nearly 45,000 bottles per hour and is expected to handle five recipes, namely, Sting energy drinks, Pepsi Diet, Mirinda, 7up, and Pepsi.
  • In October 2022, Coca-Cola India launched a limited edition. bottle named Locked Coke for the festive season. The bottle has a Bluetooth-enabled cap, which is programmed to open in the presence of the sender’s mobile phone. The launch is a part of the company’s #MilkeHiManegiDiwali campaign. It aims to encourage consumers to celebrate and meet during Diwali in person.

Scope of the Report

Attribute Details
Estimated Market Size (2023) US$ 2,121.1 Million
Projected Market Valuation (2033) US$ 3,050.3 Million
Value-based CAGR (2023 to 2033) 3.7%
Forecast Period 2023 to 2033
Historical Data Available for 2018 to 2022
Market Analysis Value (US$ Million)
Key Regions Covered North America; Latin America; Europe; Asia Pacific; Oceania
Key Countries Covered The USA, Canada, Mexico, Germany, The UK, France, Italy, Spain, China, Japan, India, South Korea, Australia, Brazil, Argentina, South Africa, UAE
Key Segments Covered Application, Automation, Capacity, Region
Key Companies Profiled Krones AG; Ic Filling Systems; the Tetra Laval Group; Promach; Barry-Wehmiller Group, Inc.; Coesia S.P.A.; Optima Packaging Group GmbH; Zhangjiagang King Machine Co. Ltd; Hiemens Bottling Machines; PallayPack Inc.; MULTIVAC Sepp Haggenmuller SE and Co. KG; ATS Automation Tooling Systems Inc.; Sacmi Imola S.C.
Report Coverage Company Share Analysis, DROT Analysis, Market Dynamics and Challenges, Strategic Growth Initiatives, Market Forecast, Competitive Landscape

Mobile Bottling Line Market Outlook by Category

By Application:

  • Food
  • Beverage
  • Dairy

By Automation:

  • Semi-automatic
  • Automatic

By Capacity:

  • Low
  • Medium
  • High

By Region:

  • North America
  • Latin America
  • Europe
  • Asia Pacific
  • Oceania
  • Middle East & Africa (MEA)

Frequently Asked Questions

How big is the mobile bottling line industry?

The mobile bottling line industry is set to reach nearly US$ 2,121.1 Million by 2023.

At what rate is the mobile bottling line industry expected to grow?

The mobile bottling line industry is expected to rise at a CAGR of 3.7% in the next ten years.

Which are the major countries driving the demand for mobile bottling lines?

The US, UK, China, and Germany are the major countries driving the demand for mobile bottling lines.

What is the Japan mobile bottling line industry outlook?

By the end of 2023, Japan is set to exhibit a CAGR of 6.6% in the global market for mobile bottling lines and hold a value share of US$ 140.0 Million.

What is the Australia mobile bottling line industry outlook?

By the end of 2023, Australia is anticipated to showcase a CAGR of 3.0% in the global market for mobile bottling lines and generate a share of US$ 91.5 Million.

At what rate will the demand for mobile bottling lines grow in China?

The China mobile bottling line industry is expected to grow at a 6.5% CAGR between 2023 and 2033.

At what rate will the demand for mobile bottling lines grow in India?

The India mobile bottling line industry is anticipated to grow at 5.8% CAGR between 2023 and 2033.

At what rate will the demand for mobile bottling lines grow in the UK?

The UK mobile bottling line industry is set to grow at 5.8% CAGR between 2023 and 2033.

Which companies would dominate the market for mobile bottling lines?

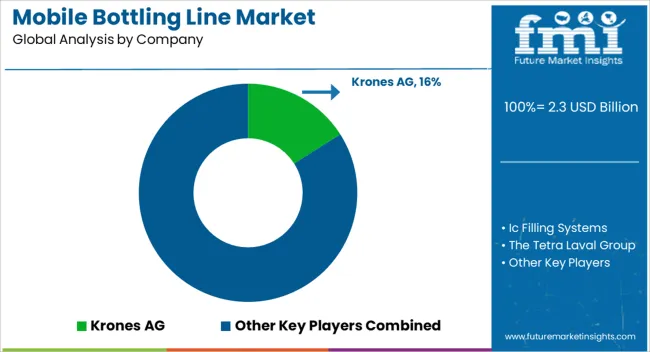
Krones AG, Ic Filling Systems, the Tetra Laval Group, Promach, and Barry-Wehmiller Group, Inc. are the key companies dominating the mobile bottling line industry.

What is the demand outlook forecast for the mobile bottling line industry?

The global demand for mobile bottling lines is anticipated to surpass US$ 3,050.3 Million by the end of 2033.

Table of Content

1. Executive Summary | Mobile Bottling Line Market

    1.1. Global Market Outlook

    1.2. Demand-side Trends

    1.3. Supply-side Trends

    1.4. Technology Roadmap Analysis

    1.5. Analysis and Recommendations

2. Market Overview

    2.1. Market Coverage / Taxonomy

    2.2. Market Definition / Scope / Limitations

3. Market Background

    3.1. Market Dynamics

        3.1.1. Drivers

        3.1.2. Restraints

        3.1.3. Opportunity

        3.1.4. Trends

    3.2. Scenario Forecast

        3.2.1. Demand in Optimistic Scenario

        3.2.2. Demand in Likely Scenario

        3.2.3. Demand in Conservative Scenario

    3.3. Product launches & Recent Developments

    3.4. Product Life Cycle Analysis

    3.5. Value Chain Analysis

        3.5.1. Supply Side Participants and their Roles

            3.5.1.1. Producers

            3.5.1.2. Mid-Level Participants (Traders / Agents / Brokers)

            3.5.1.3. Wholesalers and Distributors

        3.5.2. % of Operating Margin Analysis

        3.5.3. List of Raw Material Suppliers

        3.5.4. List of Existing and Potential Buyers

    3.6. Global Market - Pricing Analysis

        3.6.1. Price Point Assessment by Region

        3.6.2. Price Point Assessment by Product Type

        3.6.3. Price Forecast till 2033

        3.6.4. Factors affecting pricing

    3.7. Forecast Factors - Relevance & Impact

    3.8. PESTLE and Porter’s Analysis

    3.9. Regulatory Landscape

        3.9.1. Packaging & Labelling Regulations

        3.9.2. Certifications and Certifying Agency Overview

        3.9.3. Import/Export Policies

    3.10. Regional Parent Market Outlook

    3.11. Production and Consumption Statistics

    3.12. Import and Export Statistics

    3.13. Consumers Survey Analysis

    3.14. Macro-Economic Factors

    3.15. Product Claims & Nutritional Information scanned by Buyers

4. Global Market Analysis 2018 to 2022 and Forecast, 2023 to 2033

    4.1. Historical Market Size Value (US$ Million) & Volume (MT) Analysis, 2018 to 2022

    4.2. Current and Future Market Size Value (US$ Million) & Volume (MT) Projections, 2023 to 2033

        4.2.1. Y-o-Y Growth Trend Analysis

        4.2.2. Absolute $ Opportunity Analysis

5. Global Market Analysis 2018 to 2022 and Forecast 2023 to 2033, By Application

    5.1. Introduction / Key Findings

    5.2. Historical Market Size Value (US$ Million) & Volume (MT) Analysis By Application, 2018 to 2022

    5.3. Current and Future Market Size Value (US$ Million) & Volume (MT) Analysis and Forecast By Application, 2023 to 2033

        5.3.1. Food

        5.3.2. Beverage

        5.3.3. Dairy

    5.4. Y-o-Y Growth Trend Analysis By Application, 2018 to 2022

    5.5. Absolute $ Opportunity Analysis By Application, 2023 to 2033

6. Global Market Analysis 2018 to 2022 and Forecast 2023 to 2033, By Automation

    6.1. Introduction / Key Findings

    6.2. Historical Market Size Value (US$ Million) & Volume (MT) Analysis By Automation, 2018 to 2022

    6.3. Current and Future Market Size Value (US$ Million) & Volume (MT) Analysis and Forecast By Automation, 2023 to 2033

        6.3.1. Semi-automatic

        6.3.2. Automatic

    6.4. Y-o-Y Growth Trend Analysis By Automation, 2018 to 2022

    6.5. Absolute $ Opportunity Analysis By Automation, 2023 to 2033

7. Global Market Analysis 2018 to 2022 and Forecast 2023 to 2033, By Capacity

    7.1. Introduction / Key Findings

    7.2. Historical Market Size Value (US$ Million) & Volume (MT) Analysis By Capacity, 2018 to 2022

    7.3. Current and Future Market Size Value (US$ Million) & Volume (MT) Analysis and Forecast By Capacity, 2023 to 2033

        7.3.1. Low

        7.3.2. Medium

        7.3.3. High

    7.4. Y-o-Y Growth Trend Analysis By Capacity, 2018 to 2022

    7.5. Absolute $ Opportunity Analysis By Capacity, 2023 to 2033

8. Global Market Analysis 2018 to 2022 and Forecast 2023 to 2033, By Region

    8.1. Introduction

    8.2. Historical Market Size Value (US$ Million) & Volume (MT) Analysis By Region, 2018 to 2022

    8.3. Current Market Size Value (US$ Million) & Volume (MT) Analysis and Forecast By Region, 2023 to 2033

        8.3.1. North America

        8.3.2. Latin America

        8.3.3. Europe

        8.3.4. East Asia

        8.3.5. South Asia

        8.3.6. Oceania

        8.3.7. Middle East & Africa (MEA)

    8.4. Market Attractiveness Analysis By Region

9. North America Market Analysis 2018 to 2022 and Forecast 2023 to 2033, By Country

    9.1. Historical Market Size Value (US$ Million) & Volume (MT) Trend Analysis By Market Taxonomy, 2018 to 2022

    9.2. Market Size Value (US$ Million) & Volume (MT) Forecast By Market Taxonomy, 2023 to 2033

        9.2.1. By Country

            9.2.1.1. The US

            9.2.1.2. Canada

        9.2.2. By Application

        9.2.3. By Automation

        9.2.4. By Capacity

    9.3. Market Attractiveness Analysis

        9.3.1. By Country

        9.3.2. By Application

        9.3.3. By Automation

        9.3.4. By Capacity

    9.4. Key Takeaways

10. Latin America Market Analysis 2018 to 2022 and Forecast 2023 to 2033, By Country

    10.1. Historical Market Size Value (US$ Million) & Volume (MT) Trend Analysis By Market Taxonomy, 2018 to 2022

    10.2. Market Size Value (US$ Million) & Volume (MT) Forecast By Market Taxonomy, 2023 to 2033

        10.2.1. By Country

            10.2.1.1. Brazil

            10.2.1.2. Mexico

            10.2.1.3. Argentina

            10.2.1.4. Chile

            10.2.1.5. Peru

            10.2.1.6. Rest of Latin America

        10.2.2. By Application

        10.2.3. By Automation

        10.2.4. By Capacity

    10.3. Market Attractiveness Analysis

        10.3.1. By Country

        10.3.2. By Application

        10.3.3. By Automation

        10.3.4. By Capacity

    10.4. Key Takeaways

11. Europe Market Analysis 2018 to 2022 and Forecast 2023 to 2033, By Country

    11.1. Historical Market Size Value (US$ Million) & Volume (MT) Trend Analysis By Market Taxonomy, 2018 to 2022

    11.2. Market Size Value (US$ Million) & Volume (MT) Forecast By Market Taxonomy, 2023 to 2033

        11.2.1. By Country

            11.2.1.1. Germany

            11.2.1.2. Italy

            11.2.1.3. France

            11.2.1.4. The UK

            11.2.1.5. Spain

            11.2.1.6. Russia

            11.2.1.7. BENELUX

            11.2.1.8. Poland

            11.2.1.9. Nordic Countries

            11.2.1.10. Rest of Europe

        11.2.2. By Application

        11.2.3. By Automation

        11.2.4. By Capacity

    11.3. Market Attractiveness Analysis

        11.3.1. By Country

        11.3.2. By Application

        11.3.3. By Automation

        11.3.4. By Capacity

    11.4. Key Takeaways

12. East Asia Market Analysis 2018 to 2022 and Forecast 2023 to 2033, By Country

    12.1. Historical Market Size Value (US$ Million) & Volume (MT) Trend Analysis By Market Taxonomy, 2018 to 2022

    12.2. Market Size Value (US$ Million) & Volume (MT) Forecast By Market Taxonomy, 2023 to 2033

        12.2.1. By Country

            12.2.1.1. China

            12.2.1.2. Japan

            12.2.1.3. South Korea

        12.2.2. By Application

        12.2.3. By Automation

        12.2.4. By Capacity

    12.3. Market Attractiveness Analysis

        12.3.1. By Country

        12.3.2. By Application

        12.3.3. By Automation

        12.3.4. By Capacity

    12.4. Key Takeaways

13. South Asia Market Analysis 2018 to 2022 and Forecast 2023 to 2033, By Country

    13.1. Historical Market Size Value (US$ Million) & Volume (MT) Trend Analysis By Market Taxonomy, 2018 to 2022

    13.2. Market Size Value (US$ Million) & Volume (MT) Forecast By Market Taxonomy, 2023 to 2033

        13.2.1. By Country

            13.2.1.1. India

            13.2.1.2. Thailand

            13.2.1.3. Malaysia

            13.2.1.4. Indonesia

            13.2.1.5. Singapore

            13.2.1.6. Rest of South Asia

        13.2.2. By Application

        13.2.3. By Automation

        13.2.4. By Capacity

    13.3. Market Attractiveness Analysis

        13.3.1. By Country

        13.3.2. By Application

        13.3.3. By Automation

        13.3.4. By Capacity

    13.4. Key Takeaways

14. Oceania Market Analysis 2018 to 2022 and Forecast 2023 to 2033, By Country

    14.1. Historical Market Size Value (US$ Million) & Volume (MT) Trend Analysis By Market Taxonomy, 2018 to 2022

    14.2. Market Size Value (US$ Million) & Volume (MT) Forecast By Market Taxonomy, 2023 to 2033

        14.2.1. By Country

            14.2.1.1. Australia

            14.2.1.2. New Zealand

        14.2.2. By Application

        14.2.3. By Automation

        14.2.4. By Capacity

    14.3. Market Attractiveness Analysis

        14.3.1. By Country

        14.3.2. By Application

        14.3.3. By Automation

        14.3.4. By Capacity

    14.4. Key Takeaways

15. MEA Market Analysis 2018 to 2022 and Forecast 2023 to 2033, By Country

    15.1. Historical Market Size Value (US$ Million) & Volume (MT) Trend Analysis By Market Taxonomy, 2018 to 2022

    15.2. Market Size Value (US$ Million) & Volume (MT) Forecast By Market Taxonomy, 2023 to 2033

        15.2.1. By Country

            15.2.1.1. GCC Countries

            15.2.1.2. South Africa

            15.2.1.3. Central Africa

            15.2.1.4. North Africa

        15.2.2. By Application

        15.2.3. By Automation

        15.2.4. By Capacity

    15.3. Market Attractiveness Analysis

        15.3.1. By Country

        15.3.2. By Application

        15.3.3. By Automation

        15.3.4. By Capacity

    15.4. Key Takeaways

16. Key Countries Market Analysis

    16.1. The US

        16.1.1. Pricing Analysis

        16.1.2. Market Share Analysis, 2022

            16.1.2.1. By Application

            16.1.2.2. By Automation

            16.1.2.3. By Capacity

    16.2. Canada

        16.2.1. Pricing Analysis

        16.2.2. Market Share Analysis, 2022

            16.2.2.1. By Application

            16.2.2.2. By Automation

            16.2.2.3. By Capacity

    16.3. Brazil

        16.3.1. Pricing Analysis

        16.3.2. Market Share Analysis, 2022

            16.3.2.1. By Application

            16.3.2.2. By Automation

            16.3.2.3. By Capacity

    16.4. Mexico

        16.4.1. Pricing Analysis

        16.4.2. Market Share Analysis, 2022

            16.4.2.1. By Application

            16.4.2.2. By Automation

            16.4.2.3. By Capacity

    16.5. Argentina

        16.5.1. Pricing Analysis

        16.5.2. Market Share Analysis, 2022

            16.5.2.1. By Application

            16.5.2.2. By Automation

            16.5.2.3. By Capacity

    16.6. Chile

        16.6.1. Pricing Analysis

        16.6.2. Market Share Analysis, 2022

            16.6.2.1. By Application

            16.6.2.2. By Automation

            16.6.2.3. By Capacity

    16.7. Peru

        16.7.1. Pricing Analysis

        16.7.2. Market Share Analysis, 2022

            16.7.2.1. By Application

            16.7.2.2. By Automation

            16.7.2.3. By Capacity

    16.8. Germany

        16.8.1. Pricing Analysis

        16.8.2. Market Share Analysis, 2022

            16.8.2.1. By Application

            16.8.2.2. By Automation

            16.8.2.3. By Capacity

    16.9. Italy

        16.9.1. Pricing Analysis

        16.9.2. Market Share Analysis, 2022

            16.9.2.1. By Application

            16.9.2.2. By Automation

            16.9.2.3. By Capacity

    16.10. France

        16.10.1. Pricing Analysis

        16.10.2. Market Share Analysis, 2022

            16.10.2.1. By Application

            16.10.2.2. By Automation

            16.10.2.3. By Capacity

    16.11. Spain

        16.11.1. Pricing Analysis

        16.11.2. Market Share Analysis, 2022

            16.11.2.1. By Application

            16.11.2.2. By Automation

            16.11.2.3. By Capacity

    16.12. The UK

        16.12.1. Pricing Analysis

        16.12.2. Market Share Analysis, 2022

            16.12.2.1. By Application

            16.12.2.2. By Automation

            16.12.2.3. By Capacity

    16.13. Russia

        16.13.1. Pricing Analysis

        16.13.2. Market Share Analysis, 2022

            16.13.2.1. By Application

            16.13.2.2. By Automation

            16.13.2.3. By Capacity

    16.14. Poland

        16.14.1. Pricing Analysis

        16.14.2. Market Share Analysis, 2022

            16.14.2.1. By Application

            16.14.2.2. By Automation

            16.14.2.3. By Capacity

    16.15. BENELUX

        16.15.1. Pricing Analysis

        16.15.2. Market Share Analysis, 2022

            16.15.2.1. By Application

            16.15.2.2. By Automation

            16.15.2.3. By Capacity

    16.16. Nordic Countries

        16.16.1. Pricing Analysis

        16.16.2. Market Share Analysis, 2022

            16.16.2.1. By Application

            16.16.2.2. By Automation

            16.16.2.3. By Capacity

    16.17. China

        16.17.1. Pricing Analysis

        16.17.2. Market Share Analysis, 2022

            16.17.2.1. By Application

            16.17.2.2. By Automation

            16.17.2.3. By Capacity

    16.18. Japan

        16.18.1. Pricing Analysis

        16.18.2. Market Share Analysis, 2022

            16.18.2.1. By Application

            16.18.2.2. By Automation

            16.18.2.3. By Capacity

    16.19. South Korea

        16.19.1. Pricing Analysis

        16.19.2. Market Share Analysis, 2022

            16.19.2.1. By Application

            16.19.2.2. By Automation

            16.19.2.3. By Capacity

    16.20. India

        16.20.1. Pricing Analysis

        16.20.2. Market Share Analysis, 2022

            16.20.2.1. By Application

            16.20.2.2. By Automation

            16.20.2.3. By Capacity

    16.21. Thailand

        16.21.1. Pricing Analysis

        16.21.2. Market Share Analysis, 2022

            16.21.2.1. By Application

            16.21.2.2. By Automation

            16.21.2.3. By Capacity

    16.22. Indonesia

        16.22.1. Pricing Analysis

        16.22.2. Market Share Analysis, 2022

            16.22.2.1. By Application

            16.22.2.2. By Automation

            16.22.2.3. By Capacity

    16.23. Malaysia

        16.23.1. Pricing Analysis

        16.23.2. Market Share Analysis, 2022

            16.23.2.1. By Application

            16.23.2.2. By Automation

            16.23.2.3. By Capacity

    16.24. Singapore

        16.24.1. Pricing Analysis

        16.24.2. Market Share Analysis, 2022

            16.24.2.1. By Application

            16.24.2.2. By Automation

            16.24.2.3. By Capacity

    16.25. Australia

        16.25.1. Pricing Analysis

        16.25.2. Market Share Analysis, 2022

            16.25.2.1. By Application

            16.25.2.2. By Automation

            16.25.2.3. By Capacity

    16.26. New Zealand

        16.26.1. Pricing Analysis

        16.26.2. Market Share Analysis, 2022

            16.26.2.1. By Application

            16.26.2.2. By Automation

            16.26.2.3. By Capacity

    16.27. GCC Countries

        16.27.1. Pricing Analysis

        16.27.2. Market Share Analysis, 2022

            16.27.2.1. By Application

            16.27.2.2. By Automation

            16.27.2.3. By Capacity

    16.28. South Africa

        16.28.1. Pricing Analysis

        16.28.2. Market Share Analysis, 2022

            16.28.2.1. By Application

            16.28.2.2. By Automation

            16.28.2.3. By Capacity

    16.29. North Africa

        16.29.1. Pricing Analysis

        16.29.2. Market Share Analysis, 2022

            16.29.2.1. By Application

            16.29.2.2. By Automation

            16.29.2.3. By Capacity

    16.30. Central Africa

        16.30.1. Pricing Analysis

        16.30.2. Market Share Analysis, 2022

            16.30.2.1. By Application

            16.30.2.2. By Automation

            16.30.2.3. By Capacity

17. Market Structure Analysis

    17.1. Competition Dashboard

    17.2. Competition Benchmarking

    17.3. Market Share Analysis of Top Players

        17.3.1. By Regional

        17.3.2. By Application

        17.3.3. By Automation

        17.3.4. By Capacity

18. Competition Analysis

    18.1. Competition Deep Dive

        18.1.1. Krones AG

            18.1.1.1. Overview

            18.1.1.2. Product Portfolio

            18.1.1.3. Profitability by Market Segments (Application / Automation / Capacity / Region)

            18.1.1.4. Sales Footprint

            18.1.1.5. Strategy Overview

                18.1.1.5.1. Marketing Strategy

                18.1.1.5.2. Product Strategy

                18.1.1.5.3. Channel Strategy

        18.1.2. Ic Filling Systems

            18.1.2.1. Overview

            18.1.2.2. Product Portfolio

            18.1.2.3. Profitability by Market Segments (Application / Automation / Capacity / Region)

            18.1.2.4. Sales Footprint

            18.1.2.5. Strategy Overview

                18.1.2.5.1. Marketing Strategy

                18.1.2.5.2. Product Strategy

                18.1.2.5.3. Channel Strategy

        18.1.3. the Tetra Laval Group

            18.1.3.1. Overview

            18.1.3.2. Product Portfolio

            18.1.3.3. Profitability by Market Segments (Application / Automation / Capacity / Region)

            18.1.3.4. Sales Footprint

            18.1.3.5. Strategy Overview

                18.1.3.5.1. Marketing Strategy

                18.1.3.5.2. Product Strategy

                18.1.3.5.3. Channel Strategy

        18.1.4. Promach

            18.1.4.1. Overview

            18.1.4.2. Product Portfolio

            18.1.4.3. Profitability by Market Segments (Application / Automation / Capacity / Region)

            18.1.4.4. Sales Footprint

            18.1.4.5. Strategy Overview

                18.1.4.5.1. Marketing Strategy

                18.1.4.5.2. Product Strategy

                18.1.4.5.3. Channel Strategy

        18.1.5. Barry-Wehmiller Group, Inc.

            18.1.5.1. Overview

            18.1.5.2. Product Portfolio

            18.1.5.3. Profitability by Market Segments (Application / Automation / Capacity / Region)

            18.1.5.4. Sales Footprint

            18.1.5.5. Strategy Overview

                18.1.5.5.1. Marketing Strategy

                18.1.5.5.2. Product Strategy

                18.1.5.5.3. Channel Strategy

        18.1.6. Coesia S.P.A.

            18.1.6.1. Overview

            18.1.6.2. Product Portfolio

            18.1.6.3. Profitability by Market Segments (Application / Automation / Capacity / Region)

            18.1.6.4. Sales Footprint

            18.1.6.5. Strategy Overview

                18.1.6.5.1. Marketing Strategy

                18.1.6.5.2. Product Strategy

                18.1.6.5.3. Channel Strategy

        18.1.7. Optima Packaging Group GmbH

            18.1.7.1. Overview

            18.1.7.2. Product Portfolio

            18.1.7.3. Profitability by Market Segments (Application / Automation / Capacity / Region)

            18.1.7.4. Sales Footprint

            18.1.7.5. Strategy Overview

                18.1.7.5.1. Marketing Strategy

                18.1.7.5.2. Product Strategy

                18.1.7.5.3. Channel Strategy

        18.1.8. Zhangjiagang King Machine Co. Ltd

            18.1.8.1. Overview

            18.1.8.2. Product Portfolio

            18.1.8.3. Profitability by Market Segments (Application / Automation / Capacity / Region)

            18.1.8.4. Sales Footprint

            18.1.8.5. Strategy Overview

                18.1.8.5.1. Marketing Strategy

                18.1.8.5.2. Product Strategy

                18.1.8.5.3. Channel Strategy

        18.1.9. Hiemens Bottling Machines

            18.1.9.1. Overview

            18.1.9.2. Product Portfolio

            18.1.9.3. Profitability by Market Segments (Application / Automation / Capacity / Region)

            18.1.9.4. Sales Footprint

            18.1.9.5. Strategy Overview

                18.1.9.5.1. Marketing Strategy

                18.1.9.5.2. Product Strategy

                18.1.9.5.3. Channel Strategy

        18.1.10. PallayPack Inc.

            18.1.10.1. Overview

            18.1.10.2. Product Portfolio

            18.1.10.3. Profitability by Market Segments (Application / Automation / Capacity / Region)

            18.1.10.4. Sales Footprint

            18.1.10.5. Strategy Overview

                18.1.10.5.1. Marketing Strategy

                18.1.10.5.2. Product Strategy

                18.1.10.5.3. Channel Strategy

        18.1.11. MULTIVAC Sepp Haggenmuller SE and Co. KG

            18.1.11.1. Overview

            18.1.11.2. Product Portfolio

            18.1.11.3. Profitability by Market Segments (Application / Automation / Capacity / Region)

            18.1.11.4. Sales Footprint

            18.1.11.5. Strategy Overview

                18.1.11.5.1. Marketing Strategy

                18.1.11.5.2. Product Strategy

                18.1.11.5.3. Channel Strategy

        18.1.12. ATS Automation Tooling Systems Inc.

            18.1.12.1. Overview

            18.1.12.2. Product Portfolio

            18.1.12.3. Profitability by Market Segments (Application / Automation / Capacity / Region)

            18.1.12.4. Sales Footprint

            18.1.12.5. Strategy Overview

                18.1.12.5.1. Marketing Strategy

                18.1.12.5.2. Product Strategy

                18.1.12.5.3. Channel Strategy

        18.1.13. Sacmi Imola S.C.

            18.1.13.1. Overview

            18.1.13.2. Product Portfolio

            18.1.13.3. Profitability by Market Segments (Application / Automation / Capacity / Region)

            18.1.13.4. Sales Footprint

            18.1.13.5. Strategy Overview

                18.1.13.5.1. Marketing Strategy

                18.1.13.5.2. Product Strategy

                18.1.13.5.3. Channel Strategy

19. Assumptions & Acronyms Used

20. Research Methodology

Recommendations

Food and Beverage

Bread Improvers Market

October 2024

REP-GB-11240

311 pages

Process Automation

Air Fryer Market

January 2024

REP-GB-11157

333 pages

Process Automation

Chicken Plucking Machine Market

January 2023

REP-GB-16154

309 pages

Process Automation

Cow Milking Machine Market

December 2022

REP-GB-16161

323 pages

Explore Process Automation Insights

View Reports
Future Market Insights

Mobile Bottling Line Market

Schedule a Call