Mining Lubricant Market Outlook from 2025 to 2035

The Mining Lubricant market is experiencing substantial growth driven by the increasing demand for reliable and high-performance lubrication solutions across mining operations. The market’s future outlook is shaped by the continuous modernization of mining equipment, rising mechanization, and stringent maintenance standards to ensure operational efficiency. Growing awareness of the importance of reducing equipment downtime and minimizing wear and tear is fueling the adoption of advanced lubricants.

Additionally, the shift toward synthetic-based products is supporting longer equipment life and enhanced performance under extreme temperature and load conditions. The rising demand for coal and other minerals globally has further accelerated the need for effective lubrication solutions to ensure smooth operations and compliance with safety standards.

The market is also being propelled by ongoing research and innovation in lubricant formulations that enhance energy efficiency and reduce environmental impact As mining activities expand in emerging economies and established mining regions prioritize sustainability, the Mining Lubricant market is poised for steady growth in the coming years.
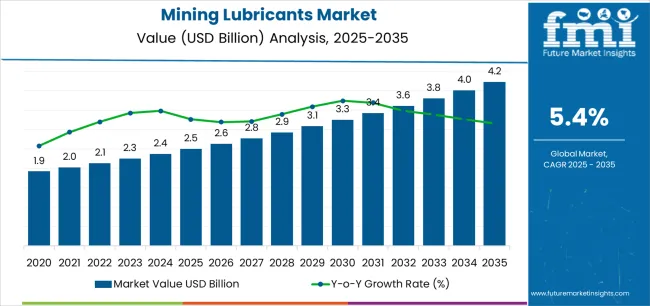
Quick Stats for Mining Lubricant Market

  • Mining Lubricant Market Industry Value (2025): USD 2.5 billion
  • Mining Lubricant Market Forecast Value (2035): USD 4.2 billion
  • Mining Lubricant Market Forecast CAGR: 5.4%
  • Leading Segment in Mining Lubricant Market in 2025: Oils (93.0%)
  • Key Growth Region in Mining Lubricant Market: North America, Asia-Pacific, Europe
  • Top Key Players in Mining Lubricant Market: Shell plc, ExxonMobil, BP (Castrol), TotalEnergies, Chevron, FUCHS, PETRONAS, LUKOIL, Klüber Lubrication, Petro-Canada Lubricants

Mining Lubricants Market Market Value Analysis

Metric Value
Mining Lubricant Market Estimated Value in (2025 E) USD 2.5 billion
Mining Lubricant Market Forecast Value in (2035 F) USD 4.2 billion
Forecast CAGR (2025 to 2035) 5.4%

Segmental Analysis

The market is segmented by Product Type, Source, and Application and region. By Product Type, the market is divided into Oils and Greases. In terms of Source, the market is classified into Synthetic and Bio-Based. Based on Application, the market is segmented into Coal Mining, Iron Ore, Precious Metals & Rare Earths, Bauxite, Industrial Minerals, and Others. Regionally, the market is classified into North America, Latin America, Western Europe, Eastern Europe, Balkan & Baltic Countries, Russia & Belarus, Central Asia, East Asia, South Asia & Pacific, and the Middle East & Africa.
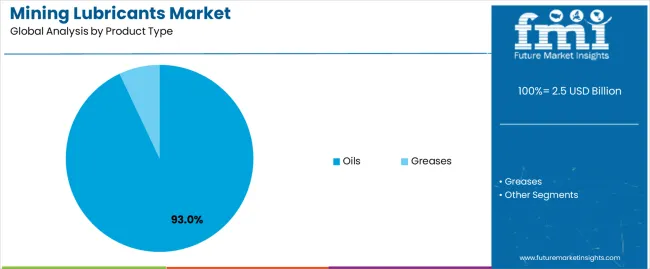
Insights into the Oils Product Type Segment

Mining Lubricants Market Analysis By Product Type

The oils product type is projected to hold 93.0% of the Mining Lubricant market revenue share in 2025, making it the dominant product category. This prominence is driven by the versatility and efficiency of oils in reducing friction, wear, and heat generation in heavy-duty mining machinery. Oils provide consistent performance under high-pressure and high-temperature conditions, making them suitable for a wide range of mining operations.

Their compatibility with both conventional and advanced lubrication systems has reinforced their adoption across the mining sector. Additionally, oils facilitate extended equipment life and reduced maintenance costs, supporting operational continuity and efficiency.

The preference for oils is further strengthened by increasing investments in preventive maintenance programs and the need to comply with industry safety and environmental standards These factors collectively ensure that oils continue to lead the Mining Lubricant market.
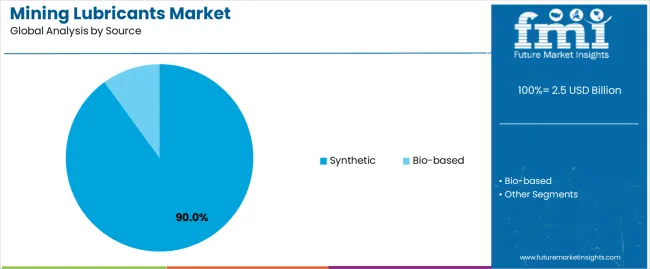
Insights into the Synthetic Source Segment

Mining Lubricants Market Analysis By Source

The synthetic source segment is expected to account for 90.0% of the Mining Lubricant market revenue share in 2025, reflecting strong demand for high-performance lubrication solutions. Synthetic lubricants are favored due to their superior thermal stability, oxidation resistance, and enhanced protection against equipment wear.

The segment’s growth is influenced by the need for reliable performance in extreme operational environments and heavy-load mining applications. Synthetic lubricants also support energy efficiency and reduce the frequency of lubricant replacement, which is critical in large-scale mining operations.

The increasing adoption of advanced machinery that requires precision lubrication has further propelled the demand for synthetic sources These factors combined have made synthetic lubricants the preferred choice for mining operations globally, ensuring their leading position in the market.
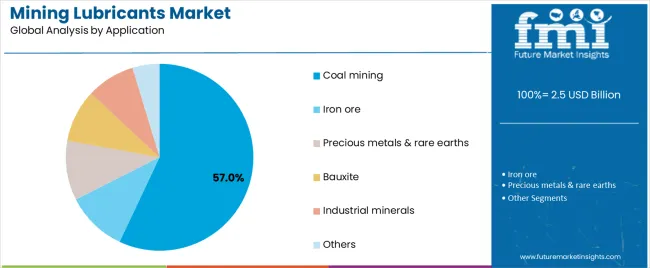
Insights into the Coal Mining Application Segment

Mining Lubricants Market Analysis By Application

The coal mining application segment is anticipated to hold 57.0% of the Mining Lubricant market revenue in 2025, establishing it as the largest application segment. The growth is driven by the intensive use of heavy machinery such as draglines, excavators, and conveyors in coal mining operations, which demand high-performance lubrication to operate efficiently and safely.

The harsh and abrasive conditions of coal mining necessitate lubricants that can withstand high loads, extreme temperatures, and continuous operation. The segment’s prominence is further supported by increasing global coal production and the need for reduced downtime in mining processes.

The focus on extending equipment life, minimizing maintenance costs, and ensuring operational safety has reinforced the use of specialized mining lubricants in coal mining applications These factors collectively contribute to the dominance of the coal mining segment in the Mining Lubricant market.

Semi-annual Market Update

The table below represents the annual growth rates from 2025 to 2035. From the base year 2025 to the current year 2025, the report studied how the growth trajectory varies from the first half of the year, i.e., January to June (H1), to the second half consisting of July through December (H2). This gives an all-inclusive picture of the performance of the industry over time to potential stakeholders and helps in making possible future developments.

The figures in the table below showcase the growth rate for each half-year of 2025 to 2025. It was estimated to rise at a CAGR of 5.2% in H1 2025, although entering H2, a manifold rise in the growth rate of 5.8% is depicted.

Particulars Value CAGR
H1 5.2% (2025 to 2035)
H2 5.8% (2025 to 2035)
H1 4.9% (2025 to 2035)
H2 5.9% (2025 to 2035)

Moving into the subsequent period, from H1 2025 to H2 2025, the CAGR is projected to slightly drop to 4.9% in the first half and relatively increase to 5.9% in the second half. In the first half (H1), the market witnessed a decline of 20 BPS while in the second half (H2), there was a slight surge of 10 BPS.

Key Industry Highlights

Mining Firms Embrace AI and IoT for Predictive Maintenance

Modern mining companies are currently utilizing AI and IoT to monitor their equipment closely, including the inclusion of lubricants. These technologies make it possible to monitor the level and quality of lubricants in real time.

For instance, sensors can identify whether the lubricant level is running low or if it's losing its effectiveness. This allows operators to note the nature of the problems beforehand and prevent breakdowns in order to continue mining operations in full swing.

AI and IoT are also raising the demand for smart lubricants that function admirably with such systems. Predictive maintenance uses AI to forecast when something might go wrong, thereby enabling firms to fix issues before they cause serious damage.

For instance, if the sensors indicate that a lubricant is wearing out faster than usual, maintenance could be done before it does any harm. It is projected to help mining companies save certain amounts on repairs and increase operational efficiency.

Increasing Demand for High-temperature and Extreme-pressure Lubricants Fuels Growth

There is a growing demand for lubricants with an extremely high temperature and pressure rating worldwide. It is attributed to the increasing innovation of mining equipment to extend their capacities to run smoothly on different types of grounds.

The latest mining machinery that is utilized in deep underground mines or in deep-sea locations operates under extremely high heat and pressure, against which ordinary lubricants do not have enough resistance. Hence, special lubricants are required to keep mining drills and crushers running smoothly at extreme temperatures.

High-temperature and extreme-pressure lubricants ensure that the equipment runs smoothly, thereby reducing the total maintenance period. Such special lubricants ensure that machines work well even in the most odious conditions to prevent breakdowns and costly repairs. As mining companies continue to adopt more unique and heavy machinery, demand for durable lubricants increases, thereby augmenting growth.

Rising Demand for Coal and Base Metals to Create Novel Opportunities

Coal mining represents around 57% of the total consumption of mining lubricants. Even though large reserves of coal are located in China, India, and the United States, most of the coal produced in these countries is used as feedstock for energy production.

Coal accounted for around 58% and 64% of total energy production in China and India, respectively. Though the share of coal in energy production is depleting in China, the country is projected to continue dominating in terms of energy production due to a lack of supply of alternative sources.

In developing countries, growing infrastructure and construction requirements, followed by rapid industrialization, are set to raise demand for base metals. Rising demand for coal to generate power, combined with high demand for base metals, is likely to boost mining activities, further augmenting lubricant sales.

Small-scale Companies May Not Invest in High-end Lubes due to Exorbitant Costs

Innovative mining lubricants are designed to perform well in extreme conditions, such as very high temperatures and pressures. These special lubricants are very expensive. This makes them difficult to purchase for mining companies, particularly small-scale companies or those mining on a shoestring budget.

For instance, deep-sea mining operations require these expensive lubricants so the machinery can function correctly in inhospitable underwater conditions. These products can be too expensive for the companies to bear their costs, thereby restricting their use and in turn affecting operations.

The high cost of cutting-edge lubricants is anticipated to lead companies to fall back on less expensive solutions or even delay investments in new products. When companies are not investing in these sophisticated, high-end lubricants, demand goes down. Hence, the industry is projected to witness a declining growth rate fueled by tight budgets acting as a restraint to wide-scale diffusion and application.

2020 to 2024 Global Mining Lubricant Sales Analysis Compared to Demand Forecast for 2025 to 2035

The global market witnessed a CAGR of 3.8% between 2020 and 2025. Total revenue reached about USD 2,255.3 million in 2025. During the forecast period, global sales are projected to fetch a CAGR of 5.4%.

Back in 2025, the COVID-19 pandemic LED to lockdowns and restrictions on traveling, which delayed lubricant production and delivery. Mining activities were affected due to reduced production capacity, complete plant shutdowns, and decreased demand for lubricants. Product shortages and increased costs of raw materials further added to the slowdown in growth.

As a result of the pandemic, global economic activities slowed down. Hence, there were fewer investments in new mining projects and equipment. Companies cut spending on items like high-performance lubricants and focused on keeping ongoing operations running rather than upgrading or adding capacity.

It is envisaged that as the global economy bounces back, more money will be invested in mining projects during the forecast period. With the rising need for minerals and metals to develop modern infrastructure and technology, mining activities have been on the rise. Companies will likely invest in better equipment and high-quality lubricants, which are set to help improve performance and reduce downtime.

Lubricants developed for use in cutting-edge mining equipment are anticipated to be in high demand. The need for new lubricants made from eco-friendly sources is also projected to rise with increasing focus of companies on reducing their environmental impact. This is anticipated to fuel growth as firms strive to enhance efficiency and comply with standards protecting the environment.

Market Concentration

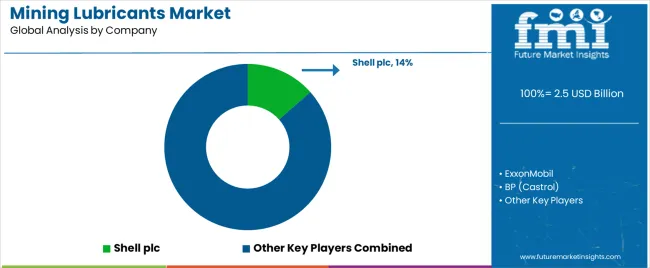
Tier 1 companies include key players with annual revenues exceeding USD 500 million. These companies are currently capturing a significant share of 31% to 36% globally. These frontrunners are characterized by high production capacity and a wide product portfolio.

They are distinguished by extensive expertise in manufacturing and a broad geographical reach, underpinned by a robust consumer base. The firms provide a wide range of products and utilize the latest technology to meet regulatory standards. Prominent companies within Tier 1 include Shell PLC, Exxon Mobil Corporation, Total S.A., BP PLC, and PetroChina Company Ltd.

Tier 2 companies encompass mid-sized participants with revenues ranging from USD 100 to 500 million, holding a presence in specific regions and exerting significant influence across local economies. These firms are distinguished by a robust presence overseas and in-depth market expertise.

They possess strong technology capabilities and adhere strictly to regulatory requirements. However, the firms may not wield cutting-edge technology or maintain an extensive global reach. Noteworthy entities in Tier 2 include Total S.A., PETRONAS, FUCHS, Chevron Corp., and Lukoil Oil Company.

Tier 3 encompasses most of the small-scale enterprises operating within the regional sphere and catering to specialized needs with revenues below USD 100 million. They are notably focused on meeting local demands and are hence categorized within the Tier 3 segment.

In this context, Tier 3 is acknowledged as an informal sector, indicating a segment distinguished by a lack of extensive organization and formal structure compared to the structured one. Tier 3 includes Schaeffer Manufacturing Co., Kluber Lubrication, PetroCanada, and others.

Country-wise Insights

The section covers assessments of mining lubricant sales across key countries. Countries from South Asia and Pacific are anticipated to exhibit promising double-digit growth over the forecast period. All the below-listed countries are collectively set to reflect a CAGR of around 6.6% through the forecast period, which is 1.13X of the global market.

Countries CAGR 2025 to 2035
India 7.6%
South Korea 6.8%
China 6.5%
Japan 6.2%
Türkiye 5.9%

Several Large-scale Mining Operations across China Fuel Sales

In the forecast period, China's mining lubricant industry is predicted to rise steadily at a CAGR of 6.5% and attain a total worth of USD 1,053.5 million by 2035. The country is considered one of the most prominent producers and consumers of mining resources in the world. It produces a high volume of coal, iron ore, and rare earth minerals.

Extensive mining operations in the country boost substantial demand for mining lubricants. The country is currently showcasing a diverse structure in terms of mining with several ongoing mineral extraction processes and large-scale operations.

The high intensity of mining calls for large volumes of specialty lubricants to help maintain equipment efficiency and performance. Moreover, China's investments in unique mining technologies and related infrastructure are contributing to growing demand.

Domestic production is guaranteed by China's capacity for local production of lubricants and its large-scale mining operations, thereby ensuring stable supplies at low costs to mining companies. The ability to produce the product locally has helped the country maintain its competitive edge.

The United States Witnesses High Demand for Eco-friendly Lubricants

In the forecast period, the United States is predicted to rise steadily at a CAGR of 4.2% and attain a total worth of USD 368.24 million by 2035. It is one of the leading countries in terms of mining technology and infrastructure development. It needs high-performance lubricants to efficiently run the state-of-the-art equipment present in the mining industry.

Increasing coal, copper, and gold extraction activities in the United States are also set to push demand for cutting-edge machinery. The machinery would further require innovative lubricants for smooth and effective performance.

Rising emphasis on automation and remotely controlled mining operations in the United States raises demand for lubricants. These can bear extreme conditions and reduce maintenance needs, thereby boosting growth.

The United States also has very strict environmental and safety laws in place, which impact mining operations. These regulations compel mining companies to use quality lubricants that are harmless to the environment to abide by the law and minimize their impact on the environment.

Government Support like Policy Reforms and Incentives Boost Demand in India

India is projected to surge at a CAGR of 7.6% from 2025 to 2035, with sales anticipated to reach USD 346.01 million by 2035. Rapid infrastructure and industrial developments have LED to high demand for minerals, such as iron ore, bauxite, and coal in the country.

There is hence a requirement for mining lubricants to smoothly conduct extensive mining activities and maintain high efficiency. Increasing investments in new mining technologies and large-scale mining projects in India stimulate the appetite for quality lubricants developed specifically for rugged mining conditions.

The country’s government also plays a key role in pushing mining lubricant demand through various initiatives, including policy reforms and incentives. Recent attempts to enhance mining infrastructure, propel mineral output, and attract foreign direct investments (FDIs) have created favorable grounds for mining operations.

Increased production capacity and modernization of mining practices by the authorities have resulted in a high need for specialty lubricants. These are set to be designed to improve equipment reliability and performance in India’s flourishing mining industry.

Category-wise Insights

The section explains the growth trajectories of the two leading segments. In terms of product type, the oils segment will likely dominate and generate a share of around 93.1% in 2025.

Based on the source, the synthetic segment is projected to hold a share of 90% in 2025. The analysis would enable potential clients to make effective business decisions for investment purposes.

High Versatility and Reliability Make Oil-based Lubricants Mainly Preferred

Segment Oils (Product Type)
Value Share (2025) 93.1%

The oils segment is predicted to experience a decent CAGR of 3.8% from 2025 to 2035. Oil-based lubricants are anticipated to lead due to their exceptional lubrication properties as well as their ability to handle high temperatures and pressures. They are widely used across several mining equipment as they provide reliable performance and protect machinery operating in harsh conditions.

Their high versatility allows them to be used in different types of mining operations, right from coal to precious metal extraction. However, as environmental regulations tighten and sustainability becomes a priority, there is a rising trend toward biodegradable and eco-friendly lubricants. Despite this shift, oil-based lubricants remain highly preferred due to their proven effectiveness and broad application range in the mining industry.

Synthetic Lubricants Gain Traction Amid Ability to Reduce Maintenance Costs

Segment Synthetic (Source)
Value Share (2025) 90%

Synthetic lubricants are increasingly becoming popular in the mining industry due to their ability to handle extreme temperatures and pressures, making these ideal for heavy-duty machinery. They provide superior oxidation and thermal stability compared to traditional lubricants, which translates to long-lasting protection as well as reduced wear and tear.

Unlike conventional lubricants, synthetic options are less likely to break down or become contaminated, which reduces maintenance costs and equipment downtime. These advantages contribute to their growing demand as mining service providers seek enhanced performance and reliability while managing operational costs effectively.
Competition Outlook

Mining Lubricants Market Analysis By Company

Key players are investing significantly to secure their competency as a reliable provider of lubricants, meeting growing needs in several applications and fueling sales. They are also embracing collaboration and joint venture strategies to come up with innovative products and boost their client base.

Continuing with the trend, key players are introducing innovative products owing to the growing demand for unique solutions from the mining industry. Reputed companies are adopting the strategy of geographic expansion to strengthen their position. The industry is also projected to witness the entry of several start-ups and they will likely join hands with leading mining service providers.

Industry Updates

  • In April 2025, Shell plc, based in the United Kingdom, launched three new Shell Helix Ultra motor oils, enhancing engine power by up to 1.8%, responsiveness by 3.4%, and fuel efficiency by 4%, extending engine life up to 200,000 km.
  • In April 2025, Shell Lubricants, headquartered in the Netherlands and Italy-based Ducati extended their global collaboration for three more years. They will continue co-designing high-performance motorcycle engine oils and supplying Shell Advance Ducati oils to Ducati’s global dealer network and factories.
  • In March 2025, Jakarta-based Shell Indonesia planned to build its first grease manufacturing plant in the city. This new facility will complement Shell’s existing Marunda Lubricants Oil Blending Plant in Bekasi, enhancing local production capabilities.

Leading Mining Lubricant Companies

  • Shell PLC
  • BP plc
  • Exxon Mobil Corporation
  • Total Energies SE
  • Fuchs Petrolub SE
  • Chevron Corporation
  • Valvoline, Inc.
  • Eni SpA
  • PJSC Lukoil Company
  • Klüber Lubrication
  • Petroliam Nasional Berhad (PETRONAS)
  • Quaker Chemical Corporation
  • Calumet Specialty Products Partners, L.P.
  • China Petroleum & Chemical Corp (Sinopec Corporation)
  • Repsol SA
  • Savita Oil Technologies Ltd.
  • Schaeffer Manufacturing Co.
  • Petro-Canada Lubricants Inc.

Key Segments of Market Report

By Product Type:

Two main product types included in the study are oils and greases.

By Source:

Synthetic and bio-based are the key sources.

By Application:

Application segments included in the study are coal mining, bauxite mining, iron ore mining, precious metal and rare earth minerals mining, industrial minerals mining, and others.

By Region:

Regions considered in the study include North America, Latin America, Western Europe, Eastern Europe, East Asia, South Asia, and the Middle East and Africa.

Frequently Asked Questions

How big is the mining lubricant market in 2025?

The global mining lubricant market is estimated to be valued at USD 2.5 billion in 2025.

What will be the size of mining lubricant market in 2035?

The market size for the mining lubricant market is projected to reach USD 4.2 billion by 2035.

How much will be the mining lubricant market growth between 2025 and 2035?

The mining lubricant market is expected to grow at a 5.4% CAGR between 2025 and 2035.

What are the key product types in the mining lubricant market?

The key product types in mining lubricant market are oils and greases.

Which source segment to contribute significant share in the mining lubricant market in 2025?

In terms of source, synthetic segment to command 90.0% share in the mining lubricant market in 2025.

Table of Content

  1. Executive Summary
    • Global Market Outlook
    • Demand to side Trends
    • Supply to side Trends
    • Technology Roadmap Analysis
    • Analysis and Recommendations
  2. Market Overview
    • Market Coverage / Taxonomy
    • Market Definition / Scope / Limitations
  3. Market Background
    • Market Dynamics
      • Drivers
      • Restraints
      • Opportunity
      • Trends
    • Scenario Forecast
      • Demand in Optimistic Scenario
      • Demand in Likely Scenario
      • Demand in Conservative Scenario
    • Opportunity Map Analysis
    • Product Life Cycle Analysis
    • Supply Chain Analysis
    • Investment Feasibility Matrix
    • Value Chain Analysis
    • PESTLE and Porter’s Analysis
    • Regulatory Landscape
    • Regional Parent Market Outlook
    • Production and Consumption Statistics
    • Import and Export Statistics
  4. Global Market Analysis 2020 to 2025 and Forecast, 2025 to 2035
    • Historical Market Size Value (USD Million) Analysis, 2020 to 2025
    • Current and Future Market Size Value (USD Million) Projections, 2025 to 2035
      • Y to o to Y Growth Trend Analysis
      • Absolute $ Opportunity Analysis
  5. Global Market Pricing Analysis 2020 to 2025 and Forecast 2025 to 2035
  6. Global Market Analysis 2020 to 2025 and Forecast 2025 to 2035, By Product Type
    • Introduction / Key Findings
    • Historical Market Size Value (USD Million) Analysis By Product Type , 2020 to 2025
    • Current and Future Market Size Value (USD Million) Analysis and Forecast By Product Type , 2025 to 2035
      • Oils
      • Greases
    • Y to o to Y Growth Trend Analysis By Product Type , 2020 to 2025
    • Absolute $ Opportunity Analysis By Product Type , 2025 to 2035
  7. Global Market Analysis 2020 to 2025 and Forecast 2025 to 2035, By Source
    • Introduction / Key Findings
    • Historical Market Size Value (USD Million) Analysis By Source, 2020 to 2025
    • Current and Future Market Size Value (USD Million) Analysis and Forecast By Source, 2025 to 2035
      • Synthetic
      • Bio-Based
    • Y to o to Y Growth Trend Analysis By Source, 2020 to 2025
    • Absolute $ Opportunity Analysis By Source, 2025 to 2035
  8. Global Market Analysis 2020 to 2025 and Forecast 2025 to 2035, By Application
    • Introduction / Key Findings
    • Historical Market Size Value (USD Million) Analysis By Application, 2020 to 2025
    • Current and Future Market Size Value (USD Million) Analysis and Forecast By Application, 2025 to 2035
      • Coal Mining
      • Iron Ore
      • Precious Metals & Rare Earths
      • Bauxite
      • Industrial Minerals
      • Others
    • Y to o to Y Growth Trend Analysis By Application, 2020 to 2025
    • Absolute $ Opportunity Analysis By Application, 2025 to 2035
  9. Global Market Analysis 2020 to 2025 and Forecast 2025 to 2035, By Region
    • Introduction
    • Historical Market Size Value (USD Million) Analysis By Region, 2020 to 2025
    • Current Market Size Value (USD Million) Analysis and Forecast By Region, 2025 to 2035
      • North America
      • Latin America
      • Western Europe
      • Eastern Europe
      • East Asia
      • South Asia and Pacific
      • Middle East & Africa
    • Market Attractiveness Analysis By Region
  10. North America Market Analysis 2020 to 2025 and Forecast 2025 to 2035, By Country
    • Historical Market Size Value (USD Million) Trend Analysis By Market Taxonomy, 2020 to 2025
    • Market Size Value (USD Million) Forecast By Market Taxonomy, 2025 to 2035
      • By Country
        • USA
        • Canada
        • Mexico
      • By Product Type
      • By Source
      • By Application
    • Market Attractiveness Analysis
      • By Country
      • By Product Type
      • By Source
      • By Application
    • Key Takeaways
  11. Latin America Market Analysis 2020 to 2025 and Forecast 2025 to 2035, By Country
    • Historical Market Size Value (USD Million) Trend Analysis By Market Taxonomy, 2020 to 2025
    • Market Size Value (USD Million) Forecast By Market Taxonomy, 2025 to 2035
      • By Country
        • Brazil
        • Chile
        • Rest of Latin America
      • By Product Type
      • By Source
      • By Application
    • Market Attractiveness Analysis
      • By Country
      • By Product Type
      • By Source
      • By Application
    • Key Takeaways
  12. Western Europe Market Analysis 2020 to 2025 and Forecast 2025 to 2035, By Country
    • Historical Market Size Value (USD Million) Trend Analysis By Market Taxonomy, 2020 to 2025
    • Market Size Value (USD Million) Forecast By Market Taxonomy, 2025 to 2035
      • By Country
        • Germany
        • UK
        • Italy
        • Spain
        • France
        • Nordic
        • BENELUX
        • Rest of Western Europe
      • By Product Type
      • By Source
      • By Application
    • Market Attractiveness Analysis
      • By Country
      • By Product Type
      • By Source
      • By Application
    • Key Takeaways
  13. Eastern Europe Market Analysis 2020 to 2025 and Forecast 2025 to 2035, By Country
    • Historical Market Size Value (USD Million) Trend Analysis By Market Taxonomy, 2020 to 2025
    • Market Size Value (USD Million) Forecast By Market Taxonomy, 2025 to 2035
      • By Country
        • Russia
        • Poland
        • Hungary
        • Balkan & Baltic
        • Rest of Eastern Europe
      • By Product Type
      • By Source
      • By Application
    • Market Attractiveness Analysis
      • By Country
      • By Product Type
      • By Source
      • By Application
    • Key Takeaways
  14. East Asia Market Analysis 2020 to 2025 and Forecast 2025 to 2035, By Country
    • Historical Market Size Value (USD Million) Trend Analysis By Market Taxonomy, 2020 to 2025
    • Market Size Value (USD Million) Forecast By Market Taxonomy, 2025 to 2035
      • By Country
        • China
        • Japan
        • South Korea
      • By Product Type
      • By Source
      • By Application
    • Market Attractiveness Analysis
      • By Country
      • By Product Type
      • By Source
      • By Application
    • Key Takeaways
  15. South Asia and Pacific Market Analysis 2020 to 2025 and Forecast 2025 to 2035, By Country
    • Historical Market Size Value (USD Million) Trend Analysis By Market Taxonomy, 2020 to 2025
    • Market Size Value (USD Million) Forecast By Market Taxonomy, 2025 to 2035
      • By Country
        • India
        • ASEAN
        • Australia & New Zealand
        • Rest of South Asia and Pacific
      • By Product Type
      • By Source
      • By Application
    • Market Attractiveness Analysis
      • By Country
      • By Product Type
      • By Source
      • By Application
    • Key Takeaways
  16. Middle East & Africa Market Analysis 2020 to 2025 and Forecast 2025 to 2035, By Country
    • Historical Market Size Value (USD Million) Trend Analysis By Market Taxonomy, 2020 to 2025
    • Market Size Value (USD Million) Forecast By Market Taxonomy, 2025 to 2035
      • By Country
        • Kingdom of Saudi Arabia
        • Other GCC Countries
        • Turkiye
        • South Africa
        • Other African Union
        • Rest of Middle East & Africa
      • By Product Type
      • By Source
      • By Application
    • Market Attractiveness Analysis
      • By Country
      • By Product Type
      • By Source
      • By Application
    • Key Takeaways
  17. Key Countries Market Analysis
    • USA
      • Pricing Analysis
      • Market Share Analysis, 2025
        • By Product Type
        • By Source
        • By Application
    • Canada
      • Pricing Analysis
      • Market Share Analysis, 2025
        • By Product Type
        • By Source
        • By Application
    • Mexico
      • Pricing Analysis
      • Market Share Analysis, 2025
        • By Product Type
        • By Source
        • By Application
    • Brazil
      • Pricing Analysis
      • Market Share Analysis, 2025
        • By Product Type
        • By Source
        • By Application
    • Chile
      • Pricing Analysis
      • Market Share Analysis, 2025
        • By Product Type
        • By Source
        • By Application
    • Germany
      • Pricing Analysis
      • Market Share Analysis, 2025
        • By Product Type
        • By Source
        • By Application
    • UK
      • Pricing Analysis
      • Market Share Analysis, 2025
        • By Product Type
        • By Source
        • By Application
    • Italy
      • Pricing Analysis
      • Market Share Analysis, 2025
        • By Product Type
        • By Source
        • By Application
    • Spain
      • Pricing Analysis
      • Market Share Analysis, 2025
        • By Product Type
        • By Source
        • By Application
    • France
      • Pricing Analysis
      • Market Share Analysis, 2025
        • By Product Type
        • By Source
        • By Application
    • India
      • Pricing Analysis
      • Market Share Analysis, 2025
        • By Product Type
        • By Source
        • By Application
    • ASEAN
      • Pricing Analysis
      • Market Share Analysis, 2025
        • By Product Type
        • By Source
        • By Application
    • Australia & New Zealand
      • Pricing Analysis
      • Market Share Analysis, 2025
        • By Product Type
        • By Source
        • By Application
    • China
      • Pricing Analysis
      • Market Share Analysis, 2025
        • By Product Type
        • By Source
        • By Application
    • Japan
      • Pricing Analysis
      • Market Share Analysis, 2025
        • By Product Type
        • By Source
        • By Application
    • South Korea
      • Pricing Analysis
      • Market Share Analysis, 2025
        • By Product Type
        • By Source
        • By Application
    • Russia
      • Pricing Analysis
      • Market Share Analysis, 2025
        • By Product Type
        • By Source
        • By Application
    • Poland
      • Pricing Analysis
      • Market Share Analysis, 2025
        • By Product Type
        • By Source
        • By Application
    • Hungary
      • Pricing Analysis
      • Market Share Analysis, 2025
        • By Product Type
        • By Source
        • By Application
    • Kingdom of Saudi Arabia
      • Pricing Analysis
      • Market Share Analysis, 2025
        • By Product Type
        • By Source
        • By Application
    • Turkiye
      • Pricing Analysis
      • Market Share Analysis, 2025
        • By Product Type
        • By Source
        • By Application
    • South Africa
      • Pricing Analysis
      • Market Share Analysis, 2025
        • By Product Type
        • By Source
        • By Application
  18. Market Structure Analysis
    • Competition Dashboard
    • Competition Benchmarking
    • Market Share Analysis of Top Players
      • By Regional
      • By Product Type
      • By Source
      • By Application
  19. Competition Analysis
    • Competition Deep Dive
      • Shell plc
        • Overview
        • Product Portfolio
        • Profitability by Market Segments (Product/Age /Sales Channel/Region)
        • Sales Footprint
        • Strategy Overview
          • Marketing Strategy
          • Product Strategy
          • Channel Strategy
      • ExxonMobil
      • BP (Castrol)
      • TotalEnergies
      • Chevron
      • FUCHS
      • PETRONAS
      • LUKOIL
      • Klüber Lubrication
      • Petro-Canada Lubricants
  20. Assumptions & Acronyms Used
  21. Research Methodology

List of Tables

  • Table 1: Global Market Value (USD Million) Forecast by Region, 2020 to 2035
  • Table 2: Global Market Value (USD Million) Forecast by Product Type , 2020 to 2035
  • Table 3: Global Market Value (USD Million) Forecast by Source, 2020 to 2035
  • Table 4: Global Market Value (USD Million) Forecast by Application, 2020 to 2035
  • Table 5: North America Market Value (USD Million) Forecast by Country, 2020 to 2035
  • Table 6: North America Market Value (USD Million) Forecast by Product Type , 2020 to 2035
  • Table 7: North America Market Value (USD Million) Forecast by Source, 2020 to 2035
  • Table 8: North America Market Value (USD Million) Forecast by Application, 2020 to 2035
  • Table 9: Latin America Market Value (USD Million) Forecast by Country, 2020 to 2035
  • Table 10: Latin America Market Value (USD Million) Forecast by Product Type , 2020 to 2035
  • Table 11: Latin America Market Value (USD Million) Forecast by Source, 2020 to 2035
  • Table 12: Latin America Market Value (USD Million) Forecast by Application, 2020 to 2035
  • Table 13: Western Europe Market Value (USD Million) Forecast by Country, 2020 to 2035
  • Table 14: Western Europe Market Value (USD Million) Forecast by Product Type , 2020 to 2035
  • Table 15: Western Europe Market Value (USD Million) Forecast by Source, 2020 to 2035
  • Table 16: Western Europe Market Value (USD Million) Forecast by Application, 2020 to 2035
  • Table 17: Eastern Europe Market Value (USD Million) Forecast by Country, 2020 to 2035
  • Table 18: Eastern Europe Market Value (USD Million) Forecast by Product Type , 2020 to 2035
  • Table 19: Eastern Europe Market Value (USD Million) Forecast by Source, 2020 to 2035
  • Table 20: Eastern Europe Market Value (USD Million) Forecast by Application, 2020 to 2035
  • Table 21: East Asia Market Value (USD Million) Forecast by Country, 2020 to 2035
  • Table 22: East Asia Market Value (USD Million) Forecast by Product Type , 2020 to 2035
  • Table 23: East Asia Market Value (USD Million) Forecast by Source, 2020 to 2035
  • Table 24: East Asia Market Value (USD Million) Forecast by Application, 2020 to 2035
  • Table 25: South Asia and Pacific Market Value (USD Million) Forecast by Country, 2020 to 2035
  • Table 26: South Asia and Pacific Market Value (USD Million) Forecast by Product Type , 2020 to 2035
  • Table 27: South Asia and Pacific Market Value (USD Million) Forecast by Source, 2020 to 2035
  • Table 28: South Asia and Pacific Market Value (USD Million) Forecast by Application, 2020 to 2035
  • Table 29: Middle East & Africa Market Value (USD Million) Forecast by Country, 2020 to 2035
  • Table 30: Middle East & Africa Market Value (USD Million) Forecast by Product Type , 2020 to 2035
  • Table 31: Middle East & Africa Market Value (USD Million) Forecast by Source, 2020 to 2035
  • Table 32: Middle East & Africa Market Value (USD Million) Forecast by Application, 2020 to 2035

List of Figures

  • Figure 1: Global Market Pricing Analysis
  • Figure 2: Global Market Value (USD Million) Forecast 2020-2035
  • Figure 3: Global Market Value Share and BPS Analysis by Product Type , 2025 and 2035
  • Figure 4: Global Market Y to o to Y Growth Comparison by Product Type , 2025-2035
  • Figure 5: Global Market Attractiveness Analysis by Product Type
  • Figure 6: Global Market Value Share and BPS Analysis by Source, 2025 and 2035
  • Figure 7: Global Market Y to o to Y Growth Comparison by Source, 2025-2035
  • Figure 8: Global Market Attractiveness Analysis by Source
  • Figure 9: Global Market Value Share and BPS Analysis by Application, 2025 and 2035
  • Figure 10: Global Market Y to o to Y Growth Comparison by Application, 2025-2035
  • Figure 11: Global Market Attractiveness Analysis by Application
  • Figure 12: Global Market Value (USD Million) Share and BPS Analysis by Region, 2025 and 2035
  • Figure 13: Global Market Y to o to Y Growth Comparison by Region, 2025-2035
  • Figure 14: Global Market Attractiveness Analysis by Region
  • Figure 15: North America Market Incremental Dollar Opportunity, 2025-2035
  • Figure 16: Latin America Market Incremental Dollar Opportunity, 2025-2035
  • Figure 17: Western Europe Market Incremental Dollar Opportunity, 2025-2035
  • Figure 18: Eastern Europe Market Incremental Dollar Opportunity, 2025-2035
  • Figure 19: East Asia Market Incremental Dollar Opportunity, 2025-2035
  • Figure 20: South Asia and Pacific Market Incremental Dollar Opportunity, 2025-2035
  • Figure 21: Middle East & Africa Market Incremental Dollar Opportunity, 2025-2035
  • Figure 22: North America Market Value Share and BPS Analysis by Country, 2025 and 2035
  • Figure 23: North America Market Value Share and BPS Analysis by Product Type , 2025 and 2035
  • Figure 24: North America Market Y to o to Y Growth Comparison by Product Type , 2025-2035
  • Figure 25: North America Market Attractiveness Analysis by Product Type
  • Figure 26: North America Market Value Share and BPS Analysis by Source, 2025 and 2035
  • Figure 27: North America Market Y to o to Y Growth Comparison by Source, 2025-2035
  • Figure 28: North America Market Attractiveness Analysis by Source
  • Figure 29: North America Market Value Share and BPS Analysis by Application, 2025 and 2035
  • Figure 30: North America Market Y to o to Y Growth Comparison by Application, 2025-2035
  • Figure 31: North America Market Attractiveness Analysis by Application
  • Figure 32: Latin America Market Value Share and BPS Analysis by Country, 2025 and 2035
  • Figure 33: Latin America Market Value Share and BPS Analysis by Product Type , 2025 and 2035
  • Figure 34: Latin America Market Y to o to Y Growth Comparison by Product Type , 2025-2035
  • Figure 35: Latin America Market Attractiveness Analysis by Product Type
  • Figure 36: Latin America Market Value Share and BPS Analysis by Source, 2025 and 2035
  • Figure 37: Latin America Market Y to o to Y Growth Comparison by Source, 2025-2035
  • Figure 38: Latin America Market Attractiveness Analysis by Source
  • Figure 39: Latin America Market Value Share and BPS Analysis by Application, 2025 and 2035
  • Figure 40: Latin America Market Y to o to Y Growth Comparison by Application, 2025-2035
  • Figure 41: Latin America Market Attractiveness Analysis by Application
  • Figure 42: Western Europe Market Value Share and BPS Analysis by Country, 2025 and 2035
  • Figure 43: Western Europe Market Value Share and BPS Analysis by Product Type , 2025 and 2035
  • Figure 44: Western Europe Market Y to o to Y Growth Comparison by Product Type , 2025-2035
  • Figure 45: Western Europe Market Attractiveness Analysis by Product Type
  • Figure 46: Western Europe Market Value Share and BPS Analysis by Source, 2025 and 2035
  • Figure 47: Western Europe Market Y to o to Y Growth Comparison by Source, 2025-2035
  • Figure 48: Western Europe Market Attractiveness Analysis by Source
  • Figure 49: Western Europe Market Value Share and BPS Analysis by Application, 2025 and 2035
  • Figure 50: Western Europe Market Y to o to Y Growth Comparison by Application, 2025-2035
  • Figure 51: Western Europe Market Attractiveness Analysis by Application
  • Figure 52: Eastern Europe Market Value Share and BPS Analysis by Country, 2025 and 2035
  • Figure 53: Eastern Europe Market Value Share and BPS Analysis by Product Type , 2025 and 2035
  • Figure 54: Eastern Europe Market Y to o to Y Growth Comparison by Product Type , 2025-2035
  • Figure 55: Eastern Europe Market Attractiveness Analysis by Product Type
  • Figure 56: Eastern Europe Market Value Share and BPS Analysis by Source, 2025 and 2035
  • Figure 57: Eastern Europe Market Y to o to Y Growth Comparison by Source, 2025-2035
  • Figure 58: Eastern Europe Market Attractiveness Analysis by Source
  • Figure 59: Eastern Europe Market Value Share and BPS Analysis by Application, 2025 and 2035
  • Figure 60: Eastern Europe Market Y to o to Y Growth Comparison by Application, 2025-2035
  • Figure 61: Eastern Europe Market Attractiveness Analysis by Application
  • Figure 62: East Asia Market Value Share and BPS Analysis by Country, 2025 and 2035
  • Figure 63: East Asia Market Value Share and BPS Analysis by Product Type , 2025 and 2035
  • Figure 64: East Asia Market Y to o to Y Growth Comparison by Product Type , 2025-2035
  • Figure 65: East Asia Market Attractiveness Analysis by Product Type
  • Figure 66: East Asia Market Value Share and BPS Analysis by Source, 2025 and 2035
  • Figure 67: East Asia Market Y to o to Y Growth Comparison by Source, 2025-2035
  • Figure 68: East Asia Market Attractiveness Analysis by Source
  • Figure 69: East Asia Market Value Share and BPS Analysis by Application, 2025 and 2035
  • Figure 70: East Asia Market Y to o to Y Growth Comparison by Application, 2025-2035
  • Figure 71: East Asia Market Attractiveness Analysis by Application
  • Figure 72: South Asia and Pacific Market Value Share and BPS Analysis by Country, 2025 and 2035
  • Figure 73: South Asia and Pacific Market Value Share and BPS Analysis by Product Type , 2025 and 2035
  • Figure 74: South Asia and Pacific Market Y to o to Y Growth Comparison by Product Type , 2025-2035
  • Figure 75: South Asia and Pacific Market Attractiveness Analysis by Product Type
  • Figure 76: South Asia and Pacific Market Value Share and BPS Analysis by Source, 2025 and 2035
  • Figure 77: South Asia and Pacific Market Y to o to Y Growth Comparison by Source, 2025-2035
  • Figure 78: South Asia and Pacific Market Attractiveness Analysis by Source
  • Figure 79: South Asia and Pacific Market Value Share and BPS Analysis by Application, 2025 and 2035
  • Figure 80: South Asia and Pacific Market Y to o to Y Growth Comparison by Application, 2025-2035
  • Figure 81: South Asia and Pacific Market Attractiveness Analysis by Application
  • Figure 82: Middle East & Africa Market Value Share and BPS Analysis by Country, 2025 and 2035
  • Figure 83: Middle East & Africa Market Value Share and BPS Analysis by Product Type , 2025 and 2035
  • Figure 84: Middle East & Africa Market Y to o to Y Growth Comparison by Product Type , 2025-2035
  • Figure 85: Middle East & Africa Market Attractiveness Analysis by Product Type
  • Figure 86: Middle East & Africa Market Value Share and BPS Analysis by Source, 2025 and 2035
  • Figure 87: Middle East & Africa Market Y to o to Y Growth Comparison by Source, 2025-2035
  • Figure 88: Middle East & Africa Market Attractiveness Analysis by Source
  • Figure 89: Middle East & Africa Market Value Share and BPS Analysis by Application, 2025 and 2035
  • Figure 90: Middle East & Africa Market Y to o to Y Growth Comparison by Application, 2025-2035
  • Figure 91: Middle East & Africa Market Attractiveness Analysis by Application
  • Figure 92: Global Market - Tier Structure Analysis
  • Figure 93: Global Market - Company Share Analysis
Dashboard
Dashboard
Dashboard
Dashboard
Dashboard
Dashboard

Full Research Suite comprises of:

Market outlook & trends analysis

Market outlook & trends analysis

Interviews & case studies

Interviews & case studies

Strategic recommendations

Strategic recommendations

Vendor profiles & capabilities analysis

Vendor profiles & capabilities analysis

5-year forecasts

5-year forecasts

8 regions and 60+ country-level data splits

8 regions and 60+ country-level data splits

Market segment data splits

Market segment data splits

12 months of continuous data updates

12 months of continuous data updates

DELIVERED AS:

PDF EXCEL ONLINE

Full Research Suite


$5000

$7500

$10000

Buy Report Now
Similar Industry Reports

Similar Industry Reports

Mining Remanufacturing Component Market

Mining Remanufacturing Component Market Forecast Outlook 2025 to 2035

Mining Hose Market
Mining Hose Market

Mining Hose Market Size and Share Forecast Outlook 2025 to 2035

Mining Equipment Industry Analysis in Latin America

Mining Equipment Industry Analysis in Latin America Size and Share Forecast Outlook 2025 to 2035

Mining Tester Market

Mining Tester Market Size and Share Forecast Outlook 2025 to 2035

Mining Pneumatic Saw Market

Mining Pneumatic Saw Market Size and Share Forecast Outlook 2025 to 2035

Mining Drilling Service Market

Mining Drilling Service Market Size and Share Forecast Outlook 2025 to 2035

Mining Trucks Market

Mining Trucks Market Size and Share Forecast Outlook 2025 to 2035

Mining Dump Trucks Market

Mining Dump Trucks Market Size and Share Forecast Outlook 2025 to 2035

Mining Shovel Market

Mining Shovel Market Analysis - Size, Share, and Forecast Outlook 2025 to 2035

Mining Flotation Chemicals Market

Mining Flotation Chemicals Market Size, Growth, and Forecast 2025 to 2035

Mining Drill Market
Mining Drill Market

Mining Drill Market Growth – Trends & Forecast 2025 to 2035

Mining Explosives Consumables Market

Mining Explosives Consumables Market Growth – Trends & Forecast 2025 to 2035

Mining and Construction Drilling Tools Market

Mining & Construction Drilling Tools Market Growth – Trends & Forecast 2024-2034

Mining Locomotive Market

Mining Locomotive Market

Mining Vehicle AC Kits Market

Mining Vehicle AC Kits Market

Mining Collectors Market

Mining Collectors Market Size & Demand 2022 to 2032

Demining Tool Kits Market

Demining Tool Kits Market Size and Share Forecast Outlook 2025 to 2035

Lead Mining Software Market

Lead Mining Software Market Size and Share Forecast Outlook 2025 to 2035

Smart Mining Technologies Market

Smart Mining Technologies Market Size and Share Forecast Outlook 2025 to 2035

Large Mining Shovel Market

Large Mining Shovel Market Size and Share Forecast Outlook 2025 to 2035

Future Market Insights

Mining Lubricant Market

Chat With MaRIA

Chat With

MaRIA

Hi There, I am MaRIA, Your Market Research Intelligence Assistant. How may I help you?