Millimeter Wave Technology Market Outlook (2022 to 2032)

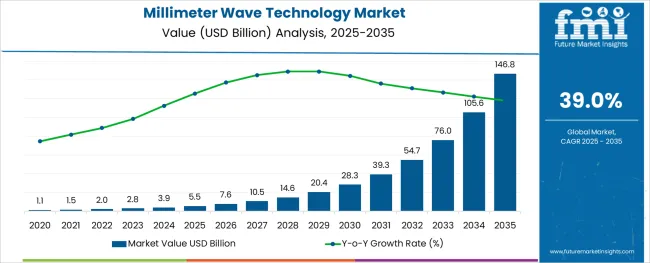
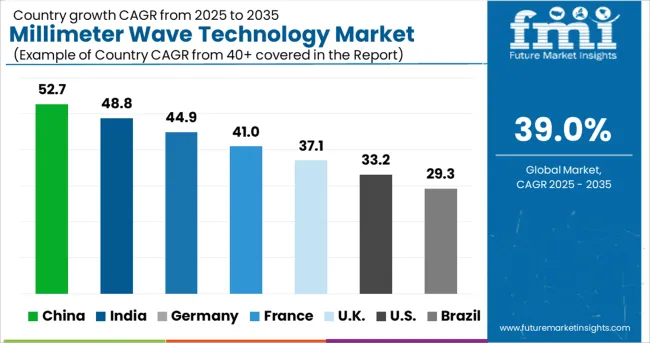
The millimeter wave technology market is anticipated to have a prodigious CAGR of 39.0% during the period of 2022 to 2032. According to FMI, the millimeter wave technology market is expected to grow from USD 2.03 Billion in 2021 to USD 76.58 billion by 2032.

Expanding R&D initiatives in millimeter wave technology and continuously rising demand for the product from the telecommunications sector are anticipated to drive the global market.

Attributes Details
The Millimeter Wave Technology Market CAGR (2022 to 2032) 39.0%
The Millimeter Wave Technology Market Size (2022) USD 2.03 billion
The Millimeter Wave Technology Market Size (2032) USD 76.58 billion

Millimeter waves are anticipated to be a key component in the advancement of fifth-generation technology, due to the necessity for greater bandwidths. The millimeter wave technology market is therefore predicted to increase significantly throughout the forecast period, as the market is seeing a transition toward the use of fifth-generation technology.

The market demand for millimeter wave technology is anticipated to grow as a result of the rising demand for millimeter wave scanners for security purposes. As people are becoming more aware of security precautions, growing markets in the Asia Pacific and South America & MEA areas are anticipated to be those with the ability to provide the technology with significant growth opportunities in the millimeter wave technology market.

Broadband and mobile speed increases, a surge in millimeter wave utilization in small-cell backhaul networks, and a significant demand for millimeter wave technology in radar and security applications are some of the drivers propelling this market's expansion.

Standards for 5G technology are still being developed at this time. However, 5G has been implemented in a few industrialized countries, including early 5G technologies that use millimeter wave technology to provide low-latency, high-capacity fixed wireless broadband networks.

What Factors Contribute to the Growth of the Millimeter Wave Technology Market?

The millimeter wave technology market is also developing as a result of the expanding infrastructure deployments for faster access to data, voice, videos, and services, as well as the rising demand for high-speed networks for accessing smart systems at the household and commercial levels.

Demand for millimeter wave technology is also anticipated to increase throughout the anticipated time, due to the increased adoption of internet services, e-governance services, and cloud computing.

What are the Opportunities in the Millimeter Wave Technology Market?

Numerous industries, including telecommunication, military & defense, security, automotive, and healthcare, employ millimeter wave technology significantly. The increased demand for millimeter wave technology originating from all these commercial and industrial sectors is also anticipated to accelerate market growth.

Over the following five years, wireless networks would experience severe congestion due to the availability of equipment that allows high bandwidth. This would accelerate the transition from the current 3G and 4G technologies to 5G, opening up a range of options for the key stakeholders in millimeter wave technology.

What are the Challenges in the Millimeter Wave Technology Market?

Being a form of line-of-sight communication, the technology might encounter a few more challenges as it develops without interruption. Around the world, significant R&D efforts are being made to remove obstacles and other limitations impeding the development of the millimeter wave technology sector.

Segmentation Outlook

Which Product is Leading in the Millimeter Wave Technology Market?

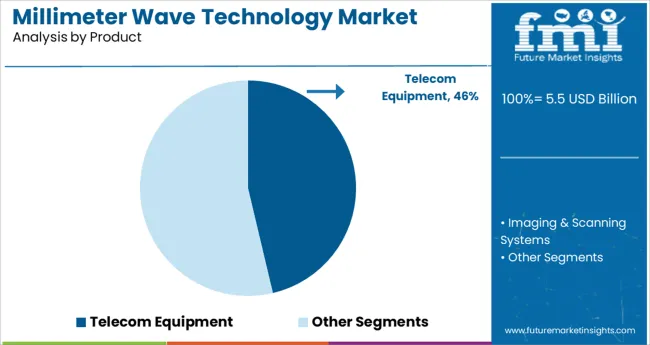
Due to the expanded telecom sector, the telecommunication equipment segment had the biggest millimeter wave technology market share in 2021, exceeding 58.15%. Millimeter wave technology is increasingly being used in imaging and scanning systems, improving their properties by bringing stability and dependability.

Additionally, the use of technology in scanners improves the accuracy of security systems. A nation's national security is not complete without radio and satellite communication technologies.

Security systems have improved in effectiveness and dependability with the adoption of millimeter wave technology in radar and satellite communication, upgrading defensive strategies.

Which Component Holds the Largest Millimeter Wave Technology Market Share?

The antennas and transceivers segment holds the greatest market share in 2021 and generated the most revenue, according to FMI's analysis of the millimeter wave technology market. In 2021, this market category had a share of 41.59%.

Due to the widespread use of the products in sectors like security and telecommunications, the market is anticipated to maintain its dominance during the projected. The global telecommunication and defense industries are both booming, and as a result, these industries' demand is anticipated to increase dramatically over the next few years.

Which Application has the Highest Potential in the Millimeter Wave Technology Market?

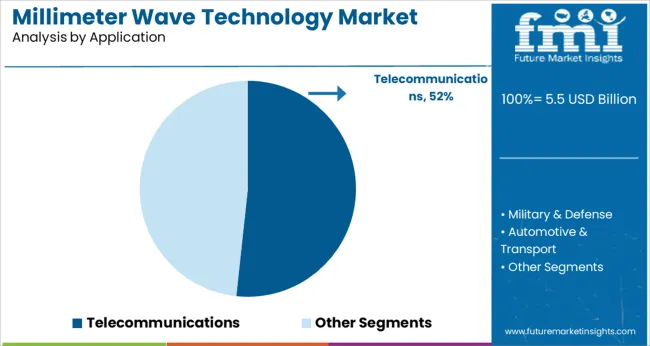
Due to the expanding need for high-speed data transfer and communication from the residential and commercial sectors, such as data centers and IT offices, the telecommunications category is expected to hold the largest millimeter wave technology market share of over 49.18% in 2021.

Due to the introduction of 5G technology, telecommunications applications are anticipated to expand rapidly throughout the projection period. The 5G network is a good fit for millimeter wave technology. Worldwide, international airport authorities are implementing millimeter-wave scanners due to their popularity.
Region-wise Outlook

Which is the Leading Region in the Millimeter Wave Technology Market?

As technology is more widely accepted in the region, the millimeter wave technology market in North America had the highest size during the projection period. Early adopters of cutting-edge and new technologies include nations like the USA and Canada. As a result, the elements are opening doors for millimeter wave technology in a variety of applications.

What is the Asia Pacific Analysis of the Millimeter Wave Technology Market?

During the projection period, it is predicted that the millimeter wave technology market in the Asia Pacific and Rest of the World (RoW) regions would expand significantly. With the expected CAGR of 44% throughout the projection period, the Asia Pacific region is expected to grow at the greatest rate.

The renovations and developments being made to its telecom infrastructures are responsible for the region's rapid technological growth. Additionally, it is anticipated that the installation of new telecom equipment based on millimeter wave technology is significantly accelerating the market growth throughout the region.
Key players

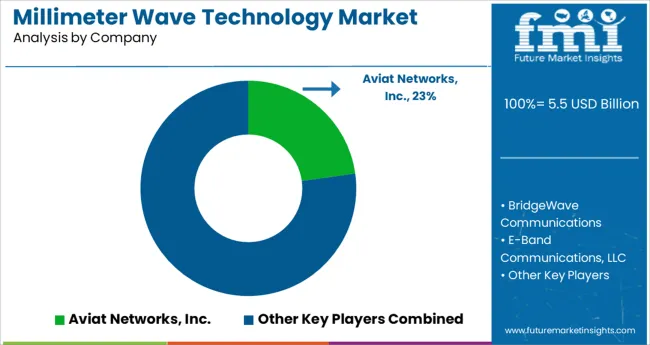
  • Aviat Networks, Inc.
  • Siklu Communication Ltd.
  • E-band Communications LLC
  • Sage Millimeter, Inc.
  • Bridgewave Communications, Inc.

Key segments

By Product:

  • Telecom Equipment
  • Imaging & Scanning Systems

By Application:

  • Telecommunications
  • Military & Defense
  • Automotive & Transport
  • Healthcare
  • Electronics & Semiconductor
  • Security

By Frequency Band:

  • V-Band
  • E-Band
  • Other Frequency Bands

By Component:

  • Antennas & Transceivers
  • Amplifiers
  • Oscillators
  • Control Devices
  • Frequency Converters
  • Passive Components
  • Others

By Region:

  • North America
  • Latin America
  • Europe
  • Asia Pacific
  • MEA

Table of Content

  • 1. Executive Summary
  • 2. Market Overview
  • 3. Market Background
  • 4. Global Market Analysis 2017 to 2021 and Forecast, 2022 to 2032
  • 5. Global Market Analysis 2017 to 2021 and Forecast 2022 to 2032, By Product
    • 5.1. Telecommunication Equipment
    • 5.2. Imaging & Scanning Systems
    • 5.3. Radar & Satellite Communication Systems
  • 6. Global Market Analysis 2017 to 2021 and Forecast 2022 to 2032, By Component
    • 6.1. Antennas & Transceivers
    • 6.2. Amplifiers
    • 6.3. Oscillators
    • 6.4. Control Devices
    • 6.5. Frequency Converters
    • 6.6. Passive Components
    • 6.7. Others (Ferrite Devices, Radiometers, etc.)
  • 7. Global Market Analysis 2017 to 2021 and Forecast 2022 to 2032, By Application
    • 7.1. Telecommunications
    • 7.2. Military & Defense
    • 7.3. Automotive & Transport
    • 7.4. Healthcare
    • 7.5. Electronics & Semiconductor
    • 7.6. Security
  • 8. Global Market Analysis 2017 to 2021 and Forecast 2022 to 2032, By Frequency Band
    • 8.1. V-Band
    • 8.2. E-Band
    • 8.3. Other Frequency Bands
  • 9. Global Market Analysis 2017 to 2021 and Forecast 2022 to 2032, By Region
    • 9.1. North America
    • 9.2. Latin America
    • 9.3. Europe
    • 9.4. Asia Pacific
    • 9.5. MEA
  • 10. North America Market Analysis 2017 to 2021 and Forecast 2022 to 2032, By Country
  • 11. Latin America Market Analysis 2017 to 2021 and Forecast 2022 to 2032, By Country
  • 12. Europe Market Analysis 2017 to 2021 and Forecast 2022 to 2032, By Country
  • 13. Asia Pacific Market Analysis 2017 to 2021 and Forecast 2022 to 2032, By Country
  • 14. MEA Market Analysis 2017 to 2021 and Forecast 2022 to 2032, By Country
  • 15. Key Countries Market Analysis
  • 16. Market Structure Analysis
  • 17. Competition Analysis
    • 17.1. Aviat Networks, Inc.
    • 17.2. BridgeWave Communications
    • 17.3. E-Band Communications, LLC
    • 17.4. Farran Technology
    • 17.5. Keysight Technologies
    • 17.6. Millitech, Inc.
    • 17.7. NEC Corporation
    • 17.8. QuinStar Technology, Inc.
    • 17.9. SAGE Millimeter, Inc.
    • 17.10. Siklu Communication Ltd.
    • 17.11. Trex Enterprises Corporation
  • 18. Assumptions & Acronyms Used
  • 19. Research Methodology

List of Tables

Table 1: Global Market Value (US$ Mn) Forecast by Region, 2017-2032

Table 2: Global Market Volume (Units) Forecast by Region, 2017-2032

Table 3: Global Market Value (US$ Mn) Forecast by Product, 2017-2032

Table 4: Global Market Volume (Units) Forecast by Product, 2017-2032

Table 5: Global Market Value (US$ Mn) Forecast by Component, 2017-2032

Table 6: Global Market Volume (Units) Forecast by Component, 2017-2032

Table 7: Global Market Value (US$ Mn) Forecast by Application, 2017-2032

Table 8: Global Market Volume (Units) Forecast by Application, 2017-2032

Table 9: Global Market Value (US$ Mn) Forecast by Frequency Band, 2017-2032

Table 10: Global Market Volume (Units) Forecast by Frequency Band, 2017-2032

Table 11: North America Market Value (US$ Mn) Forecast by Country, 2017-2032

Table 12: North America Market Volume (Units) Forecast by Country, 2017-2032

Table 13: North America Market Value (US$ Mn) Forecast by Product, 2017-2032

Table 14: North America Market Volume (Units) Forecast by Product, 2017-2032

Table 15: North America Market Value (US$ Mn) Forecast by Component, 2017-2032

Table 16: North America Market Volume (Units) Forecast by Component, 2017-2032

Table 17: North America Market Value (US$ Mn) Forecast by Application, 2017-2032

Table 18: North America Market Volume (Units) Forecast by Application, 2017-2032

Table 19: North America Market Value (US$ Mn) Forecast by Frequency Band, 2017-2032

Table 20: North America Market Volume (Units) Forecast by Frequency Band, 2017-2032

Table 21: Latin America Market Value (US$ Mn) Forecast by Country, 2017-2032

Table 22: Latin America Market Volume (Units) Forecast by Country, 2017-2032

Table 23: Latin America Market Value (US$ Mn) Forecast by Product, 2017-2032

Table 24: Latin America Market Volume (Units) Forecast by Product, 2017-2032

Table 25: Latin America Market Value (US$ Mn) Forecast by Component, 2017-2032

Table 26: Latin America Market Volume (Units) Forecast by Component, 2017-2032

Table 27: Latin America Market Value (US$ Mn) Forecast by Application, 2017-2032

Table 28: Latin America Market Volume (Units) Forecast by Application, 2017-2032

Table 29: Latin America Market Value (US$ Mn) Forecast by Frequency Band, 2017-2032

Table 30: Latin America Market Volume (Units) Forecast by Frequency Band, 2017-2032

Table 31: Europe Market Value (US$ Mn) Forecast by Country, 2017-2032

Table 32: Europe Market Volume (Units) Forecast by Country, 2017-2032

Table 33: Europe Market Value (US$ Mn) Forecast by Product, 2017-2032

Table 34: Europe Market Volume (Units) Forecast by Product, 2017-2032

Table 35: Europe Market Value (US$ Mn) Forecast by Component, 2017-2032

Table 36: Europe Market Volume (Units) Forecast by Component, 2017-2032

Table 37: Europe Market Value (US$ Mn) Forecast by Application, 2017-2032

Table 38: Europe Market Volume (Units) Forecast by Application, 2017-2032

Table 39: Europe Market Value (US$ Mn) Forecast by Frequency Band, 2017-2032

Table 40: Europe Market Volume (Units) Forecast by Frequency Band, 2017-2032

Table 41: Asia Pacific Market Value (US$ Mn) Forecast by Country, 2017-2032

Table 42: Asia Pacific Market Volume (Units) Forecast by Country, 2017-2032

Table 43: Asia Pacific Market Value (US$ Mn) Forecast by Product, 2017-2032

Table 44: Asia Pacific Market Volume (Units) Forecast by Product, 2017-2032

Table 45: Asia Pacific Market Value (US$ Mn) Forecast by Component, 2017-2032

Table 46: Asia Pacific Market Volume (Units) Forecast by Component, 2017-2032

Table 47: Asia Pacific Market Value (US$ Mn) Forecast by Application, 2017-2032

Table 48: Asia Pacific Market Volume (Units) Forecast by Application, 2017-2032

Table 49: Asia Pacific Market Value (US$ Mn) Forecast by Frequency Band, 2017-2032

Table 50: Asia Pacific Market Volume (Units) Forecast by Frequency Band, 2017-2032

Table 51: MEA Market Value (US$ Mn) Forecast by Country, 2017-2032

Table 52: MEA Market Volume (Units) Forecast by Country, 2017-2032

Table 53: MEA Market Value (US$ Mn) Forecast by Product, 2017-2032

Table 54: MEA Market Volume (Units) Forecast by Product, 2017-2032

Table 55: MEA Market Value (US$ Mn) Forecast by Component, 2017-2032

Table 56: MEA Market Volume (Units) Forecast by Component, 2017-2032

Table 57: MEA Market Value (US$ Mn) Forecast by Application, 2017-2032

Table 58: MEA Market Volume (Units) Forecast by Application, 2017-2032

Table 59: MEA Market Value (US$ Mn) Forecast by Frequency Band, 2017-2032

Table 60: MEA Market Volume (Units) Forecast by Frequency Band, 2017-2032

List of Figures

Figure 1: Global Market Value (US$ Mn) by Product, 2022-2032

Figure 2: Global Market Value (US$ Mn) by Component, 2022-2032

Figure 3: Global Market Value (US$ Mn) by Application, 2022-2032

Figure 4: Global Market Value (US$ Mn) by Frequency Band, 2022-2032

Figure 5: Global Market Value (US$ Mn) by Region, 2022-2032

Figure 6: Global Market Value (US$ Mn) Analysis by Region, 2017-2032

Figure 7: Global Market Volume (Units) Analysis by Region, 2017-2032

Figure 8: Global Market Value Share (%) and BPS Analysis by Region, 2022-2032

Figure 9: Global Market Y-o-Y Growth (%) Projections by Region, 2022-2032

Figure 10: Global Market Value (US$ Mn) Analysis by Product, 2017-2032

Figure 11: Global Market Volume (Units) Analysis by Product, 2017-2032

Figure 12: Global Market Value Share (%) and BPS Analysis by Product, 2022-2032

Figure 13: Global Market Y-o-Y Growth (%) Projections by Product, 2022-2032

Figure 14: Global Market Value (US$ Mn) Analysis by Component, 2017-2032

Figure 15: Global Market Volume (Units) Analysis by Component, 2017-2032

Figure 16: Global Market Value Share (%) and BPS Analysis by Component, 2022-2032

Figure 17: Global Market Y-o-Y Growth (%) Projections by Component, 2022-2032

Figure 18: Global Market Value (US$ Mn) Analysis by Application, 2017-2032

Figure 19: Global Market Volume (Units) Analysis by Application, 2017-2032

Figure 20: Global Market Value Share (%) and BPS Analysis by Application, 2022-2032

Figure 21: Global Market Y-o-Y Growth (%) Projections by Application, 2022-2032

Figure 22: Global Market Value (US$ Mn) Analysis by Frequency Band, 2017-2032

Figure 23: Global Market Volume (Units) Analysis by Frequency Band, 2017-2032

Figure 24: Global Market Value Share (%) and BPS Analysis by Frequency Band, 2022-2032

Figure 25: Global Market Y-o-Y Growth (%) Projections by Frequency Band, 2022-2032

Figure 26: Global Market Attractiveness by Product, 2022-2032

Figure 27: Global Market Attractiveness by Component, 2022-2032

Figure 28: Global Market Attractiveness by Application, 2022-2032

Figure 29: Global Market Attractiveness by Frequency Band, 2022-2032

Figure 30: Global Market Attractiveness by Region, 2022-2032

Figure 31: North America Market Value (US$ Mn) by Product, 2022-2032

Figure 32: North America Market Value (US$ Mn) by Component, 2022-2032

Figure 33: North America Market Value (US$ Mn) by Application, 2022-2032

Figure 34: North America Market Value (US$ Mn) by Frequency Band, 2022-2032

Figure 35: North America Market Value (US$ Mn) by Country, 2022-2032

Figure 36: North America Market Value (US$ Mn) Analysis by Country, 2017-2032

Figure 37: North America Market Volume (Units) Analysis by Country, 2017-2032

Figure 38: North America Market Value Share (%) and BPS Analysis by Country, 2022-2032

Figure 39: North America Market Y-o-Y Growth (%) Projections by Country, 2022-2032

Figure 40: North America Market Value (US$ Mn) Analysis by Product, 2017-2032

Figure 41: North America Market Volume (Units) Analysis by Product, 2017-2032

Figure 42: North America Market Value Share (%) and BPS Analysis by Product, 2022-2032

Figure 43: North America Market Y-o-Y Growth (%) Projections by Product, 2022-2032

Figure 44: North America Market Value (US$ Mn) Analysis by Component, 2017-2032

Figure 45: North America Market Volume (Units) Analysis by Component, 2017-2032

Figure 46: North America Market Value Share (%) and BPS Analysis by Component, 2022-2032

Figure 47: North America Market Y-o-Y Growth (%) Projections by Component, 2022-2032

Figure 48: North America Market Value (US$ Mn) Analysis by Application, 2017-2032

Figure 49: North America Market Volume (Units) Analysis by Application, 2017-2032

Figure 50: North America Market Value Share (%) and BPS Analysis by Application, 2022-2032

Figure 51: North America Market Y-o-Y Growth (%) Projections by Application, 2022-2032

Figure 52: North America Market Value (US$ Mn) Analysis by Frequency Band, 2017-2032

Figure 53: North America Market Volume (Units) Analysis by Frequency Band, 2017-2032

Figure 54: North America Market Value Share (%) and BPS Analysis by Frequency Band, 2022-2032

Figure 55: North America Market Y-o-Y Growth (%) Projections by Frequency Band, 2022-2032

Figure 56: North America Market Attractiveness by Product, 2022-2032

Figure 57: North America Market Attractiveness by Component, 2022-2032

Figure 58: North America Market Attractiveness by Application, 2022-2032

Figure 59: North America Market Attractiveness by Frequency Band, 2022-2032

Figure 60: North America Market Attractiveness by Country, 2022-2032

Figure 61: Latin America Market Value (US$ Mn) by Product, 2022-2032

Figure 62: Latin America Market Value (US$ Mn) by Component, 2022-2032

Figure 63: Latin America Market Value (US$ Mn) by Application, 2022-2032

Figure 64: Latin America Market Value (US$ Mn) by Frequency Band, 2022-2032

Figure 65: Latin America Market Value (US$ Mn) by Country, 2022-2032

Figure 66: Latin America Market Value (US$ Mn) Analysis by Country, 2017-2032

Figure 67: Latin America Market Volume (Units) Analysis by Country, 2017-2032

Figure 68: Latin America Market Value Share (%) and BPS Analysis by Country, 2022-2032

Figure 69: Latin America Market Y-o-Y Growth (%) Projections by Country, 2022-2032

Figure 70: Latin America Market Value (US$ Mn) Analysis by Product, 2017-2032

Figure 71: Latin America Market Volume (Units) Analysis by Product, 2017-2032

Figure 72: Latin America Market Value Share (%) and BPS Analysis by Product, 2022-2032

Figure 73: Latin America Market Y-o-Y Growth (%) Projections by Product, 2022-2032

Figure 74: Latin America Market Value (US$ Mn) Analysis by Component, 2017-2032

Figure 75: Latin America Market Volume (Units) Analysis by Component, 2017-2032

Figure 76: Latin America Market Value Share (%) and BPS Analysis by Component, 2022-2032

Figure 77: Latin America Market Y-o-Y Growth (%) Projections by Component, 2022-2032

Figure 78: Latin America Market Value (US$ Mn) Analysis by Application, 2017-2032

Figure 79: Latin America Market Volume (Units) Analysis by Application, 2017-2032

Figure 80: Latin America Market Value Share (%) and BPS Analysis by Application, 2022-2032

Figure 81: Latin America Market Y-o-Y Growth (%) Projections by Application, 2022-2032

Figure 82: Latin America Market Value (US$ Mn) Analysis by Frequency Band, 2017-2032

Figure 83: Latin America Market Volume (Units) Analysis by Frequency Band, 2017-2032

Figure 84: Latin America Market Value Share (%) and BPS Analysis by Frequency Band, 2022-2032

Figure 85: Latin America Market Y-o-Y Growth (%) Projections by Frequency Band, 2022-2032

Figure 86: Latin America Market Attractiveness by Product, 2022-2032

Figure 87: Latin America Market Attractiveness by Component, 2022-2032

Figure 88: Latin America Market Attractiveness by Application, 2022-2032

Figure 89: Latin America Market Attractiveness by Frequency Band, 2022-2032

Figure 90: Latin America Market Attractiveness by Country, 2022-2032

Figure 91: Europe Market Value (US$ Mn) by Product, 2022-2032

Figure 92: Europe Market Value (US$ Mn) by Component, 2022-2032

Figure 93: Europe Market Value (US$ Mn) by Application, 2022-2032

Figure 94: Europe Market Value (US$ Mn) by Frequency Band, 2022-2032

Figure 95: Europe Market Value (US$ Mn) by Country, 2022-2032

Figure 96: Europe Market Value (US$ Mn) Analysis by Country, 2017-2032

Figure 97: Europe Market Volume (Units) Analysis by Country, 2017-2032

Figure 98: Europe Market Value Share (%) and BPS Analysis by Country, 2022-2032

Figure 99: Europe Market Y-o-Y Growth (%) Projections by Country, 2022-2032

Figure 100: Europe Market Value (US$ Mn) Analysis by Product, 2017-2032

Figure 101: Europe Market Volume (Units) Analysis by Product, 2017-2032

Figure 102: Europe Market Value Share (%) and BPS Analysis by Product, 2022-2032

Figure 103: Europe Market Y-o-Y Growth (%) Projections by Product, 2022-2032

Figure 104: Europe Market Value (US$ Mn) Analysis by Component, 2017-2032

Figure 105: Europe Market Volume (Units) Analysis by Component, 2017-2032

Figure 106: Europe Market Value Share (%) and BPS Analysis by Component, 2022-2032

Figure 107: Europe Market Y-o-Y Growth (%) Projections by Component, 2022-2032

Figure 108: Europe Market Value (US$ Mn) Analysis by Application, 2017-2032

Figure 109: Europe Market Volume (Units) Analysis by Application, 2017-2032

Figure 110: Europe Market Value Share (%) and BPS Analysis by Application, 2022-2032

Figure 111: Europe Market Y-o-Y Growth (%) Projections by Application, 2022-2032

Figure 112: Europe Market Value (US$ Mn) Analysis by Frequency Band, 2017-2032

Figure 113: Europe Market Volume (Units) Analysis by Frequency Band, 2017-2032

Figure 114: Europe Market Value Share (%) and BPS Analysis by Frequency Band, 2022-2032

Figure 115: Europe Market Y-o-Y Growth (%) Projections by Frequency Band, 2022-2032

Figure 116: Europe Market Attractiveness by Product, 2022-2032

Figure 117: Europe Market Attractiveness by Component, 2022-2032

Figure 118: Europe Market Attractiveness by Application, 2022-2032

Figure 119: Europe Market Attractiveness by Frequency Band, 2022-2032

Figure 120: Europe Market Attractiveness by Country, 2022-2032

Figure 121: Asia Pacific Market Value (US$ Mn) by Product, 2022-2032

Figure 122: Asia Pacific Market Value (US$ Mn) by Component, 2022-2032

Figure 123: Asia Pacific Market Value (US$ Mn) by Application, 2022-2032

Figure 124: Asia Pacific Market Value (US$ Mn) by Frequency Band, 2022-2032

Figure 125: Asia Pacific Market Value (US$ Mn) by Country, 2022-2032

Figure 126: Asia Pacific Market Value (US$ Mn) Analysis by Country, 2017-2032

Figure 127: Asia Pacific Market Volume (Units) Analysis by Country, 2017-2032

Figure 128: Asia Pacific Market Value Share (%) and BPS Analysis by Country, 2022-2032

Figure 129: Asia Pacific Market Y-o-Y Growth (%) Projections by Country, 2022-2032

Figure 130: Asia Pacific Market Value (US$ Mn) Analysis by Product, 2017-2032

Figure 131: Asia Pacific Market Volume (Units) Analysis by Product, 2017-2032

Figure 132: Asia Pacific Market Value Share (%) and BPS Analysis by Product, 2022-2032

Figure 133: Asia Pacific Market Y-o-Y Growth (%) Projections by Product, 2022-2032

Figure 134: Asia Pacific Market Value (US$ Mn) Analysis by Component, 2017-2032

Figure 135: Asia Pacific Market Volume (Units) Analysis by Component, 2017-2032

Figure 136: Asia Pacific Market Value Share (%) and BPS Analysis by Component, 2022-2032

Figure 137: Asia Pacific Market Y-o-Y Growth (%) Projections by Component, 2022-2032

Figure 138: Asia Pacific Market Value (US$ Mn) Analysis by Application, 2017-2032

Figure 139: Asia Pacific Market Volume (Units) Analysis by Application, 2017-2032

Figure 140: Asia Pacific Market Value Share (%) and BPS Analysis by Application, 2022-2032

Figure 141: Asia Pacific Market Y-o-Y Growth (%) Projections by Application, 2022-2032

Figure 142: Asia Pacific Market Value (US$ Mn) Analysis by Frequency Band, 2017-2032

Figure 143: Asia Pacific Market Volume (Units) Analysis by Frequency Band, 2017-2032

Figure 144: Asia Pacific Market Value Share (%) and BPS Analysis by Frequency Band, 2022-2032

Figure 145: Asia Pacific Market Y-o-Y Growth (%) Projections by Frequency Band, 2022-2032

Figure 146: Asia Pacific Market Attractiveness by Product, 2022-2032

Figure 147: Asia Pacific Market Attractiveness by Component, 2022-2032

Figure 148: Asia Pacific Market Attractiveness by Application, 2022-2032

Figure 149: Asia Pacific Market Attractiveness by Frequency Band, 2022-2032

Figure 150: Asia Pacific Market Attractiveness by Country, 2022-2032

Figure 151: MEA Market Value (US$ Mn) by Product, 2022-2032

Figure 152: MEA Market Value (US$ Mn) by Component, 2022-2032

Figure 153: MEA Market Value (US$ Mn) by Application, 2022-2032

Figure 154: MEA Market Value (US$ Mn) by Frequency Band, 2022-2032

Figure 155: MEA Market Value (US$ Mn) by Country, 2022-2032

Figure 156: MEA Market Value (US$ Mn) Analysis by Country, 2017-2032

Figure 157: MEA Market Volume (Units) Analysis by Country, 2017-2032

Figure 158: MEA Market Value Share (%) and BPS Analysis by Country, 2022-2032

Figure 159: MEA Market Y-o-Y Growth (%) Projections by Country, 2022-2032

Figure 160: MEA Market Value (US$ Mn) Analysis by Product, 2017-2032

Figure 161: MEA Market Volume (Units) Analysis by Product, 2017-2032

Figure 162: MEA Market Value Share (%) and BPS Analysis by Product, 2022-2032

Figure 163: MEA Market Y-o-Y Growth (%) Projections by Product, 2022-2032

Figure 164: MEA Market Value (US$ Mn) Analysis by Component, 2017-2032

Figure 165: MEA Market Volume (Units) Analysis by Component, 2017-2032

Figure 166: MEA Market Value Share (%) and BPS Analysis by Component, 2022-2032

Figure 167: MEA Market Y-o-Y Growth (%) Projections by Component, 2022-2032

Figure 168: MEA Market Value (US$ Mn) Analysis by Application, 2017-2032

Figure 169: MEA Market Volume (Units) Analysis by Application, 2017-2032

Figure 170: MEA Market Value Share (%) and BPS Analysis by Application, 2022-2032

Figure 171: MEA Market Y-o-Y Growth (%) Projections by Application, 2022-2032

Figure 172: MEA Market Value (US$ Mn) Analysis by Frequency Band, 2017-2032

Figure 173: MEA Market Volume (Units) Analysis by Frequency Band, 2017-2032

Figure 174: MEA Market Value Share (%) and BPS Analysis by Frequency Band, 2022-2032

Figure 175: MEA Market Y-o-Y Growth (%) Projections by Frequency Band, 2022-2032

Figure 176: MEA Market Attractiveness by Product, 2022-2032

Figure 177: MEA Market Attractiveness by Component, 2022-2032

Figure 178: MEA Market Attractiveness by Application, 2022-2032

Figure 179: MEA Market Attractiveness by Frequency Band, 2022-2032

Figure 180: MEA Market Attractiveness by Country, 2022-2032

Frequently Asked Questions

What is the CAGR of the Millimeter Wave Technology Market?

The millimeter wave technology market is projected to have a CAGR of 39.0% through 2032.

What is the Millimeter Wave Technology Market Size by 2032?

The market size is anticipated to be USD 76.58 billion through 2032.

What is the Present Market size of Millimeter Wave Technology?

The market size is USD 2.03 billion in 2022.

Which Segment Leads the Millimeter Wave Technology Market by Frequency Band?

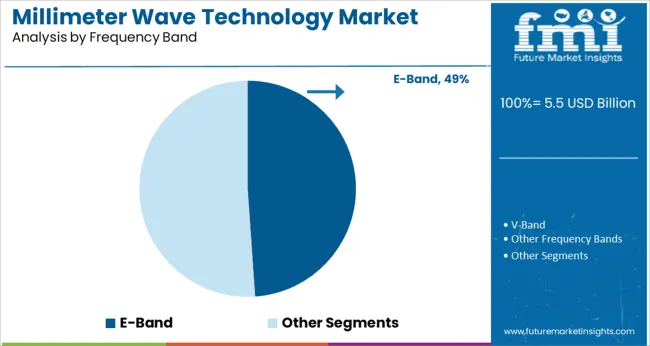
V-Band holds the largest share in the market.

Which Segment Leads the Millimeter Wave Technology Market by Product?

Telecommunication equipment led the market during the forecast period.

Explore Similar Insights

Future Market Insights

Millimeter Wave Technology Market