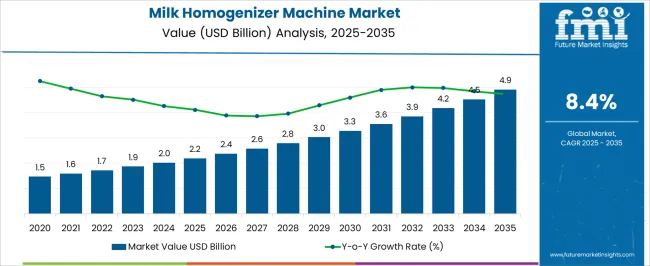
The Milk Homogenizer Machine Market is estimated to be valued at USD 2.2 billion in 2025 and is projected to reach USD 4.9 billion by 2035, registering a compound annual growth rate (CAGR) of 8.4% over the forecast period.
| Metric | Value |
|---|---|
| Milk Homogenizer Machine Market Estimated Value in (2025 E) | USD 2.2 billion |
| Milk Homogenizer Machine Market Forecast Value in (2035 F) | USD 4.9 billion |
| Forecast CAGR (2025 to 2035) | 8.4% |
The milk homogenizer machine market is undergoing consistent growth driven by increasing demand for improved milk quality and extended shelf life across dairy processing industries. Advancements in homogenization technology have enhanced product consistency, fat dispersion, and consumer safety, which are key factors motivating adoption. Industrial dairy processors are prioritizing equipment that ensures operational efficiency while meeting stringent food safety standards.
The push for higher capacity machines and innovation in valve mechanisms is fueling market expansion, particularly in regions with rising dairy consumption. Additionally, the focus on energy-efficient and cost-effective solutions is supporting growth prospects.
Collaborations between equipment manufacturers and dairy producers are fostering customized solutions that meet specific processing needs. Overall, the market trajectory is shaped by evolving consumer preferences for fresh, high-quality dairy products and regulatory requirements that demand precise and reliable homogenization.
The market is segmented by Valve Technology, Capacity, Product, Automation Grade, and Application and region. By Valve Technology, the market is divided into Single-valve and Two-valve. In terms of Capacity, the market is classified into 100-1000 litres/hour, 0-100 litres/hour, 1000-5000 litres/hour, and 1000-10000 litres/hour. Based on Product, the market is segmented into High-pressure Homogenizers, Rotary Homogenizers, and Sonic Disruptors. By Automation Grade, the market is divided into Fully Automatic and Semi-Automatic. By Application, the market is segmented into Processed Milk, Milk Powder, Cream, Cheese, Protein Concentrates, and Yogurt. Regionally, the market is classified into North America, Latin America, Western Europe, Eastern Europe, Balkan & Baltic Countries, Russia & Belarus, Central Asia, East Asia, South Asia & Pacific, and the Middle East & Africa.
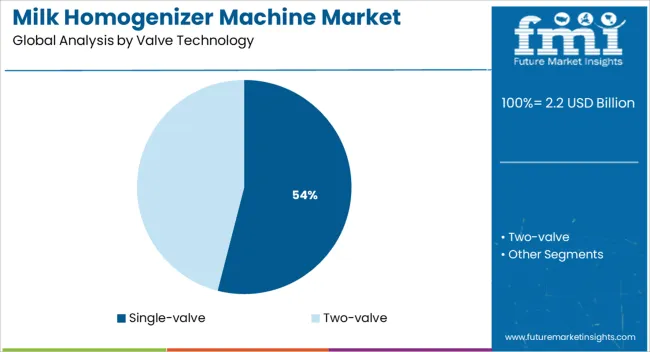
The single valve segment is expected to hold a 54.0% share of the total market revenue in 2025, establishing itself as the leading valve technology. This dominance is driven by its simpler design and ease of maintenance, which reduces downtime and operational costs for dairy processors.
The reliability and efficiency of single valve systems have enabled their widespread adoption, especially in mid-scale dairy plants. Manufacturers have focused on optimizing valve components to enhance pressure control and flow rate consistency, which has improved product quality outcomes.
The operational simplicity allows for easier integration with existing processing lines and reduces training requirements for plant personnel. These factors have collectively contributed to the preference for single valve technology as the primary choice in the milk homogenizer machine market.
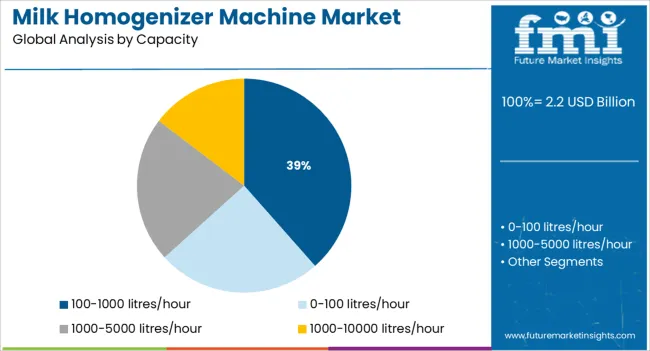
Segmented by capacity, machines with throughput of 100 1000 litres per hour are projected to capture 38.5% of the market revenue in 2025, marking this as the leading capacity range. This segment’s prominence is linked to its suitability for small to medium dairy processors who seek an optimal balance between production volume and investment.
The capacity aligns well with the demands of regional and local dairy supply chains, facilitating efficient processing without excessive capital expenditure. Product offerings within this range have been enhanced to include improved automation and precise pressure control, increasing operational efficiency.
The accessibility of these machines for growing dairy businesses and cooperatives has accelerated their market penetration. Their flexibility and scalability have made them a preferred option, especially in emerging dairy markets.
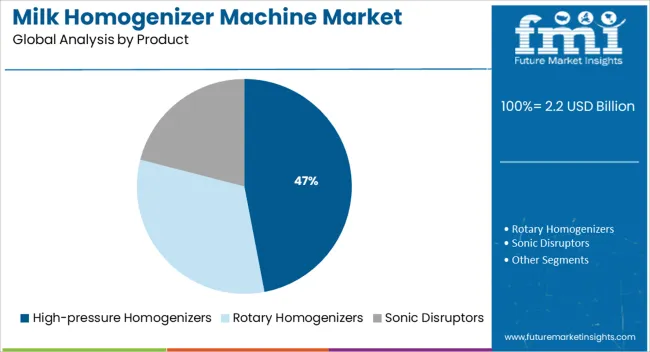
The high pressure homogenizers segment is forecast to hold 47.0% of the market revenue in 2025, positioning it as the top product category. This leadership is attributed to its superior ability to break down fat globules, resulting in improved milk texture and extended shelf life.
The robust design of high pressure homogenizers supports consistent performance even under demanding processing conditions. Dairy producers have increasingly adopted these machines to meet stringent quality standards and consumer expectations for smooth, uniform dairy products.
Technological advancements have also reduced energy consumption while maintaining high throughput, improving cost efficiency. Their proven effectiveness in both fluid milk and value-added dairy product processing has cemented their position as the product segment of choice within the market.
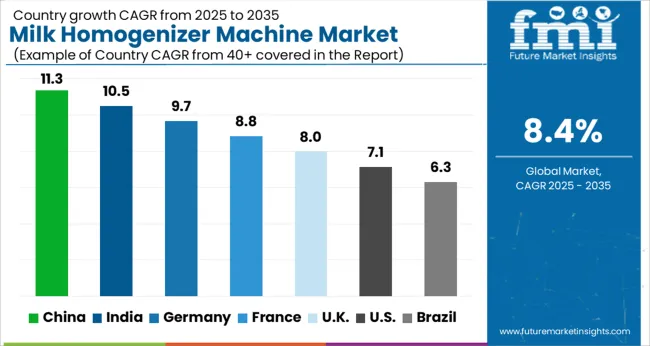
As per FMI, the global milk homogenizer machine market exhibited lucrative growth at a CAGR of 6.3% during the historical period from 2020 to 2025. The market is anticipated to exhibit growth at an astonishing CAGR of 8.4% in the forecast period with rising awareness of health and wellness among consumers worldwide.
Besides, increasing demand for specific cheese varieties, recombined milk products, liquid milk, infant formula, ice creams, and yogurts in emerging economies is projected to drive the global milk homogenizer machine market in the evaluation period. In January 2025, for instance, Organic Garage Ltd., a Canada-based independent organic grocer, declared that Future of Cheese Inc., its plant-based food company, is set to introduce its own e-commerce store.
The store is projected to offer a new range of dairy alternative products across Canada. These new product launches are expected to aid growth in the global milk homogenizer machine market.
A large number of factors are responsible for pushing the milk homogenizer machine market. Apart from providing insights into countries and segments dominating the global market, FMI has also evaluated the lucrative opportunities, growth drivers, and threats that can influence the progression of the milk homogenizer machine market during the forecast period.
The drivers, restraints, opportunities, and threats (DROTs) identified are as follows:
DRIVERS
RESTRAINTS
OPPORTUNITIES
THREATS
Rising Participation in Sports to Fuel Sales of Diary Homogenizers in the USA
The USA milk homogenizer machine market is expected to remain at the forefront in North America during the forecast period. Expansion of the food and beverage and dairy industries across the USA owing to changing lifestyles of consumers is projected to boost the country’s market. The rising inclination of millennials towards sports nutrition products containing organic ingredients is another crucial factor that would propel the USA milk homogenizer machine market.
Initiatives by the Indian Government to Encourage the Production of Milk Homogenizers
Over the forecast period, the Indian milk homogenizer machine market is expected to grow at a rapid pace. Growth can be attributed to rising disposable income and the spending power of consumers. India is expected to account for a sizable revenue share in the Asia Pacific market over the projected period. The government is also taking various initiatives to encourage the production of milk and milk products in the country.
In July 2025, for instance, Indian Prime Minister Narendra Modi inaugurated a milk powder plant and interacted with women cattle-rearers in Sabarkantha district, Gujarat. The Rs 305 crore milk powder plant is developed by the Sabarkantha District Co-operative Milk Producers' Union Ltd. The plant is capable of producing nearly 120 metric tons of milk powder every day.
Rising Consumption of Parmesan Cheese in Italy to Foster Sales of Homogenized Whole Milk
In Italy, homogenization of milk is set to gain immense popularity in the parmesan cheese industry to increase yield (via lower fat losses in the whey), reduce fat leakage during melting, increase the rate of lipid hydrolysis for certain types of cheese (like blue cheese), and permit the use of recombined milk for cheese making.
Since Italy exports large amounts of Parmigiano Reggiano cheese, the use of milk homogenizer machines in industries such as the bakery, confectionery, beverage, coffee products, yogurt, sports nutrition, and ice Cream has increased over the last decade.
Rising Milk Export in Germany to Bolster the Demand for Small-Scale Milk Homogenizers
Germany ranked number one in terms of countries that export milk with exports worth USD 2 Billion in the year 2024. The Netherlands (USD 340 Million), China (USD 282 Million), Italy (USD 190 Million), Denmark (USD 110 Million), and Belgium (USD 96.3 Million) are the top destinations for German milk exports.
With a large number of milk exports and domestic consumption, the demand for milk homogenizer machines has increased at a rapid pace. While Germany’s one of the most trusted homogenizer manufacturers named HST Maschinenbau GmbH caters to domestic demand, it also exports the machines globally.
Homogenizer Machines are to Be Extensively Used by Processed Milk Producing Firms
By application, the processed milk segment is expected to dominate the global milk homogenizer machine market in the next ten years, finds FMI. The launch of innovative and fresh milk by key dairy product manufacturing companies is anticipated to drive the segment in the evaluation period. In March 2025, for instance, Amul launched its new fresh milk and curd products in Vijayawada, India. Farmers can get up to Rs. 75 per liter in the future and it is considered to be the highest ever paid in the procurement industry. Such new initiatives by key companies across the globe are set to propel the processed milk segment.
From 2020 to 2025, the majority of the key players operating in the global milk homogenizer machine market adopted mergers and acquisitions. The strategy accounted for nearly 44% of the share out of all the other strategic growth initiatives.
These strategies were primarily implemented by leading milk homogenizer machine manufacturing companies in order to expand their global reach and strengthen their product portfolios. Some of the prominent milk homogenizer machine manufacturers such as NETZSCH GmbH & Co. Holding KG] (Germany)Krones AG (Germany), and Netzsch Group [Erich, GEA Group (Germany) have embraced these tactics.
To keep up with changing consumer demands and needs, businesses are nowadays spending on research & development to introduce new products. They are striving to compete with their rivals in the highly fragmented market.
For instance:
Get The Perfect Milk Consistency with Milk Homogenizer Machine by GEA Group, Krones AG, and Ekato Holding GmbH
Companies are using milk homogenizer machines for various purposes, such as to create fat-free and lactose-free milk alternatives for those with dairy allergies and sensitivities. Additionally, numerous companies use milk homogenizer machines to make high-quality milk like organic, skimmed, and soy milk. GEA Group, Krones AG, and Ekato Holding GmbH are innovating and developing new products.
GEA Group AG is a German firm located in Düsseldorf, Germany, that primarily operates in the food and beverage sectors. GEA is a global systems provider for the food, beverage, and pharmaceutical industries. Machinery and plants are part of the company's portfolio, as are modern process technologies, components, and complete services. GEA strives to serve its clients with long-term value creation and ideas for future success.
GEA Group offers its customers a modular product family for filling machines with different levels of automation. They also offer an ultra-high speed filling machine, which can fill up to 200 liters per minute. Another recent development is that they are introducing their latest generation of manual filling equipment.
In August 2024, GEA recently expanded its line of homogenizers for the dairy, beverage, food, pharmaceutical, chemical, and cosmetics sectors with the GEA Ariete Homogenizer 3160 and the GEA TriplexPanda Lab Homogenizer.
Another prominent player is Krones Group, located in Neutraubling, Germany, which designs, develops, and produces machines and complete lines for process, filling, and packaging technologies. Its product line is complemented by information technology, plant planning, and goods from Krones' businesses, such as intralogistics, valve manufacture, etc.
HST Maschinenbau GmbH, a Krones Group company since 2014, has decades of expertise in developing and producing high-pressure homogenizers and piston pumps. These products provide a critical process step to Krones' process technology portfolio, allowing it to produce milk, milk-based beverages, dairy products, juices, and other foods at all required throughput ranges.
In 2020, the 355-kW HL8, which can handle 55,000 liters per hour at a homogenizing pressure of 200 bar, was successfully introduced by HST as their most powerful high-pressure homogenizer.
Additionally, EKATO Group is the industry leader in stirring and mixing technology, providing mixers and agitators for complex mixing processes.
Ekato Holding GmbH, the German-based milk homogenizer machine manufacturer, announced it would focus on its product offerings and innovation efforts. The company is actively developing new technology for quality control measures for manufacturing milk products. The company also works to implement innovative engineering solutions for its customers to help them grow their businesses through productivity, cost savings, and sustainability improvements.
| Attribute | Details |
|---|---|
| Estimated Market Size (2025) | USD 2.2 billion |
| Projected Market Valuation (2035) | USD 4.9 billion |
| Value-based CAGR (2025 to 2035) | 8.4% |
| Forecast Period | 2025 to 2035 |
| Historical Data Available for | 2020 to 2025 |
| Market Analysis | Value (USD Million) |
| Key Regions Covered | North America; Latin America; Europe; South Asia; East Asia; Oceania; Middle East and Africa (MEA) |
| Key Countries Covered | USA, Canada, Mexico, Germany, UK, France, Italy, Spain, China, Japan, India, South Korea, Australia, Brazil, Argentina, South Africa, UAE |
| Key Segments Covered | Product, Valve Technology, Application, Automation Grade, Region |
| Key Companies Profiled | ROSS Mixers; IKA; PerMix North America; STK MAKINA; Bertolli; Avestin Inc.; Ekato Holding GmbH; GEA Group; Simes SA; SPX Flow; HST Maschinenbau GmbH; KADY International; Frain Industries, Inc.; JBT Corporation; Admix, Inc. |
| Report Coverage | Market Forecast, Company Share Analysis, Competitive Landscape, Drivers, Restraints, Opportunities and Threats Analysis, Market Dynamics and Challenges, and Strategic Growth Initiatives |
The global milk homogenizer machine market is estimated to be valued at USD 2.2 billion in 2025.
The market size for the milk homogenizer machine market is projected to reach USD 4.9 billion by 2035.
The milk homogenizer machine market is expected to grow at a 8.4% CAGR between 2025 and 2035.
The key product types in milk homogenizer machine market are single-valve and two-valve.
In terms of capacity, 100-1000 litres/hour segment to command 38.5% share in the milk homogenizer machine market in 2025.


Our Research Products

The "Full Research Suite" delivers actionable market intel, deep dives on markets or technologies, so clients act faster, cut risk, and unlock growth.

The Leaderboard benchmarks and ranks top vendors, classifying them as Established Leaders, Leading Challengers, or Disruptors & Challengers.

Locates where complements amplify value and substitutes erode it, forecasting net impact by horizon

We deliver granular, decision-grade intel: market sizing, 5-year forecasts, pricing, adoption, usage, revenue, and operational KPIs—plus competitor tracking, regulation, and value chains—across 60 countries broadly.

Spot the shifts before they hit your P&L. We track inflection points, adoption curves, pricing moves, and ecosystem plays to show where demand is heading, why it is changing, and what to do next across high-growth markets and disruptive tech

Real-time reads of user behavior. We track shifting priorities, perceptions of today’s and next-gen services, and provider experience, then pace how fast tech moves from trial to adoption, blending buyer, consumer, and channel inputs with social signals (#WhySwitch, #UX).

Partner with our analyst team to build a custom report designed around your business priorities. From analysing market trends to assessing competitors or crafting bespoke datasets, we tailor insights to your needs.
Supplier Intelligence
Discovery & Profiling
Capacity & Footprint
Performance & Risk
Compliance & Governance
Commercial Readiness
Who Supplies Whom
Scorecards & Shortlists
Playbooks & Docs
Category Intelligence
Definition & Scope
Demand & Use Cases
Cost Drivers
Market Structure
Supply Chain Map
Trade & Policy
Operating Norms
Deliverables
Buyer Intelligence
Account Basics
Spend & Scope
Procurement Model
Vendor Requirements
Terms & Policies
Entry Strategy
Pain Points & Triggers
Outputs
Pricing Analysis
Benchmarks
Trends
Should-Cost
Indexation
Landed Cost
Commercial Terms
Deliverables
Brand Analysis
Positioning & Value Prop
Share & Presence
Customer Evidence
Go-to-Market
Digital & Reputation
Compliance & Trust
KPIs & Gaps
Outputs
Full Research Suite comprises of:
Market outlook & trends analysis
Interviews & case studies
Strategic recommendations
Vendor profiles & capabilities analysis
5-year forecasts
8 regions and 60+ country-level data splits
Market segment data splits
12 months of continuous data updates
DELIVERED AS:
PDF EXCEL ONLINE
Milk Sterilizer Machine Market Size and Share Forecast Outlook 2025 to 2035
Cow Milking Machine Market Size and Share Forecast Outlook 2025 to 2035
Milk Pasteurization Machines Market Size and Share Forecast Outlook 2025 to 2035
Milk Powder Packaging Machines Market Size and Share Forecast Outlook 2025 to 2035
Electric Milkshake Machine Market Size and Share Forecast Outlook 2025 to 2035
Ultrasonic Homogenizer Machines Market Size and Share Forecast Outlook 2025 to 2035
Milk Froth Thermometer Market Size and Share Forecast Outlook 2025 to 2035
Machine Glazed Paper Market Size and Share Forecast Outlook 2025 to 2035
Machine Glazed Kraft Paper Market Forecast and Outlook 2025 to 2035
Machine Condition Monitoring Market Size and Share Forecast Outlook 2025 to 2035
Homogenizer Market Forecast and Outlook 2025 to 2035
Milk Carton Market Size and Share Forecast Outlook 2025 to 2035
Machine Glazed Paper Industry Analysis in Asia Pacific Forecast Outlook 2025 to 2035
Milking Automation Market Size and Share Forecast Outlook 2025 to 2035
Machine Vision Camera Market Size and Share Forecast Outlook 2025 to 2035
Machine Tool Oils Market Size and Share Forecast Outlook 2025 to 2035
Machine Vision System And Services Market Size and Share Forecast Outlook 2025 to 2035
Machine Glazed Paper Industry Analysis in Western Europe Size and Share Forecast Outlook 2025 to 2035
Machine Glazed Paper Industry Analysis in Korea Size and Share Forecast Outlook 2025 to 2035
Machine Glazed Paper Industry Analysis in Japan Size and Share Forecast Outlook 2025 to 2035

Thank you!
You will receive an email from our Business Development Manager. Please be sure to check your SPAM/JUNK folder too.
Chat With
MaRIA