Microduct Market Outlook (2023 to 2033)

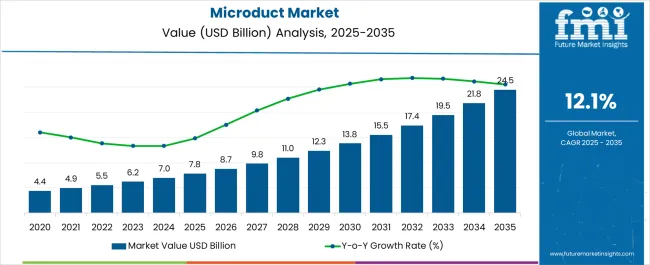
As per the recent research reports published by FMI, the global microduct market is expected to cross the mark of US$ 17.36 billion by 2033. In 2023, the market size is projected to be at US$ 5.54 billion. The CAGR is anticipated to be at a sturdy 12.1% from 2023 to 2033.

Key factors that might surge the market growth are

Surging cloud computing market.

The ability to provide better installation routes.

The much-needed flexibility is to be pushed into existing conduits.

One of the key benefits provided by the microducts is that these massively reduce capital expenditure and provide maximum utilization. These also act as a protective cover for micro-cables and fiber optic cables. This enhances the life cycle of the wiring. Such factors are expected to surge the demand for microduct during the forecast period.

The stakeholders from the Information Technology market are quite convinced of their capacity to act like cable management systems. The size of the tube varies depending on the requirement of the wiring, as a result of which the connection is seamless. These microducts are made of steel or plastic, and owing to their smooth internal surfaces, their installation is very easy. These might well increase the sales of microduct in the future.

The investors are impressed with the ability of the microducts to offer an economical solution, as these aid in network building, construction and reducing installation costs. These provide an economical alternative to rebuild, enhance, and improve data pathways for increased data demand. A lot of businesses have started preferring microducts over conventional wiring, which can be attributed to their ability to provide enhanced ruggedness and robust installation.

Most importantly, the lifecycle associated with microducts is very long as these are expandable and help in adding new users. These also assist in increasing network capacity. Moreover, rising urbanization is also a key factor, as infrastructural development may ultimately lead to better electronics and communication capabilities.

Microducts support micro trenching, which reduces construction costs and interference during installation. With so much to provide, the adoption of microduct is expected to skyrocket. However, the market might experience certain challenges owing to fluctuating prices of raw materials. Moreover, when the system is made to undergo servicing, the application of certain equipment can damage the hardware, which leads to high maintenance costs.

Asia Pacific is expected to hold the leading market share during the forecast period. Swift urbanization, coupled with the upgradation of telecommunication technology, is expected to surge market growth. The growth is further enhanced by the rapid adoption of the broadband network. North America is also expected to be one of the significant markets owing to the presence of many key players. Moreover, North America is the primary market for a lot of technological innovations, which leads to the early adoption of these technologies as compared to other regions.

Attributes Value
Microduct Market Value (2022) US$ 5.01 billion
Microduct Market Expected Value (2023) US$ 5.54 billion
Microduct Market Forecast Value (2033) US$ 17.36 billion
Microduct Market Expected CAGR (2023 to 2033) 12.1%

Don't pay for what you don't need

Customize your report by selecting specific countries or regions and save 30%!

Comparing the Historical CAGR (2017 to 2022) with the Anticipated CAGR (2023 to 2033)

The evolution of telecommunication and information technology is expected to increase the demand for microduct during the forecast period. Moreover, telecom market investors invest huge amounts of money in fiber optic cables. The microduct is used in tandem with the fiber optic cables to increase data transmission efficiency. Thus, the massive growth of the US$ 1 trillion worth of the telecom market presents mighty prospects for the microduct market. Considering all the above factors, the FMI researchers believe that the CAGR might steeply surge during the forecast period. While the historical CAGR for the market was 10.5%, the anticipated CAGR is 12.1%.

Short-term (2023 to 2026): During this period, we might see increased adoption of microducts in the cloud computing market. The microducts are used in the servers, which are used in cloud computing for storing, managing, and processing critical data.

Medium-term (2026 to 2029): During this period, the market may surge due to microduct fiber optic cable innovations. The ruggedized microduct, used for fulfilling the last mile needs, can support aerial, direct bury, and inside plant requirements.

Long-term (2029 to 2033): This is when we may witness a lot of innovations in the microduct market. Certain key players in the current times are working to develop an all-dielectric miniaturized loose tube microduct cable, which is specially designed for microduct applications. This is expected to increase the transmission speed by seventy per cent.
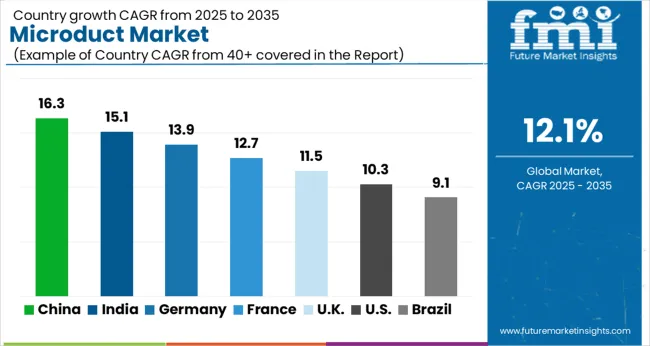
Country-wise Insights

The United States: Massive Information Technology Market Means Business

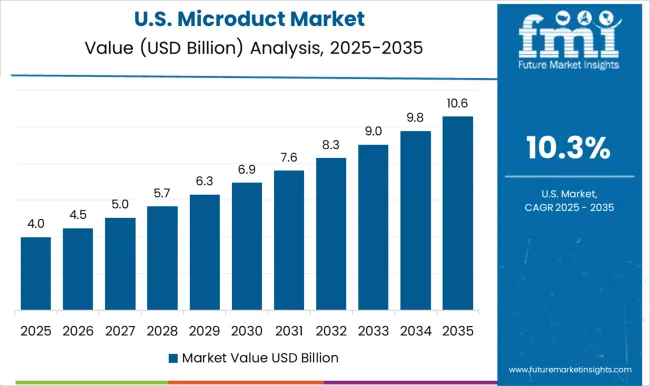
The United States is the hub of the information technology market. According to the research, the United States information technology market is expected to surpass US$ 850 billion by 2029. Microducts are one of the most important components of information technology solutions. These enable fiber optic cable networks to operate at higher speeds.

The market is also meant for the presence of certain dominant players. This makes the services quite affordable in the region. Moreover, owing to highly sophisticated technological infrastructure, the country might easily get accustomed to product innovations.
Europe: Implementation of Work from Home Policies to Propel Growth

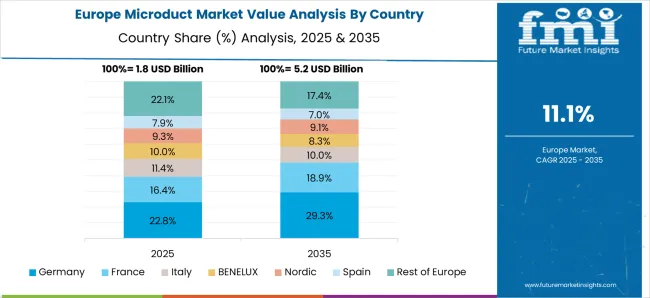
After the COVID-19 pandemic, many organizations across Europe decided to implement work from a home policy permanently. Implementing work from the home policy has resulted in the surging adoption of cloud computing services. Cloud computing services have enabled storing data that can be accessed from anywhere, and the capacity for storing the data is quite high. The microducts are adopted by cloud computing companies as these help in data security and compliance requirements as well. The most important benefit is the fact that these play a pivotal role in Faster Data Recovery (FDR).

Japan: Telecom Market Holds the Key

Japan is home to some famous telecom players, and despite being a very small nation, the telecom market was valued at US$ 123.7 billion in 2022. The telecom players are investing in microducts because they can assist in the easy gradual deployment of cable networks. Moreover, the technicians may find it easier to fit the microducts owing to their longer installation sections, fewer joints, and storage bins. The most crucial benefit of the microduct is that it helps accommodate a bunch of optical fibers, ultimately providing more space.

South Korea: Huge Fiber Optical Cable Market presents Lucrative Opportunities

South Korea is meant to produce top-quality fiber optic cables. The fiber optic cable market in South Korea was valued at US$ 723 million in 2022. The market is expected to grow rapidly owing to technological advancements in the telecom sector. The rollout of 5G is expected to speed up the adoption rate. The microducts, when employed for the operation of the fiber optic cables, increase the system's robustness and reduce the installation cost. The amazing ability to increase the deployment speed has surged the market growth, and investors are pouring millions of dollars into microducts.

Sudip Saha
Sudip Saha

Principal Consultant

Talk to Analyst

Find your sweet spots for generating winning opportunities in this market.

Segmentation Insights

Which Type is expected to hold High Market Share?

Based on the type, the flame retardant is expected to hold the dominant share during the forecast period. An increased demand for FTTX applications, coupled with the increased application in the data center, is expected to increase the market size. The stakeholders are also adopting flame retardants as these are environment-friendly and help achieve sustainability goals. These are also user-friendly and easy to install, which helps in higher operational efficiency.

Based on the application, which Segment is expected to Lead the Market?

The FTTX segment is expected to hold the leading market share during the forecast period. Increasing household usage owing to fiber optic-based broadband data networks is expected to surge the growth. The key players operating in the fiber optic cable network market are implementing projects to provide cost-effective and reliable network connections across regions.

The data center segment is expected to grow at a considerable CAGR due to increasing data center infrastructure demand. Artificial Intelligence's emergence is expected to propel the market growth during the forecast period further.

Start-ups Take Calculated Risks: Focus on Bandwidth Improvement

The start-ups operating in the market are providing mode multiplexers and light converters to improve the bandwidth and data transmission speed. The operation is based on MPLC technology, which also assists in light reshaping. With so much to offer, start-ups provide services to local networks, telecommunications, defence, aeronautics, etc.

Ubicquia: The start-up was founded in 2014. It has been providing smart street lighting solutions. They have provided a plug-and-play network and IoT router, replacing the streetlight photocell. In September 2020, Ubicquia raised funding of US$ 30 million in a Series C round. Florida-based Fuel Venture Capital and the existing investors led the funding.
Get the data you need at a Fraction of the cost

Personalize your report by choosing insights you need
and save 40%!

With a Slew of Appointments, Key Players focus on Devising Profitable Strategies

The key players are aware of using the right channel in order to spread relevant information about the manufactured products. This has led to a lot of investors focusing on choosing the right person to lead the sales and marketing department. The idea is to get on-board the veterans who have helped a lot of other companies achieve targets, and record higher profit margins.

Significant developments in the market

  • In June 2022, Emtelle appointed Paul MacLaurin as its new Chief Operating Officer.
  • In September 2022, Hexatronic launched its new Stingray product with 24 fibers to the market. It was the world’s slimmest 24 fiber air-blown cable.

Dominant players in the market

Company Description
Hexatronic Hexatronic has been enabling non-stop connectivity among regions. The company has been catering customers across four continents, and offering leading edge fiber technology. The group consists of 49 operational entities, and employees more than 1300+ workers. The company was founded in 1993 in Sweden. Hexatronic has been offering a range of passive fiber optic infrastructure. Owning the complete production chain has been giving the company greater flexibility, which has allowed Hexatronic to respond quickly.
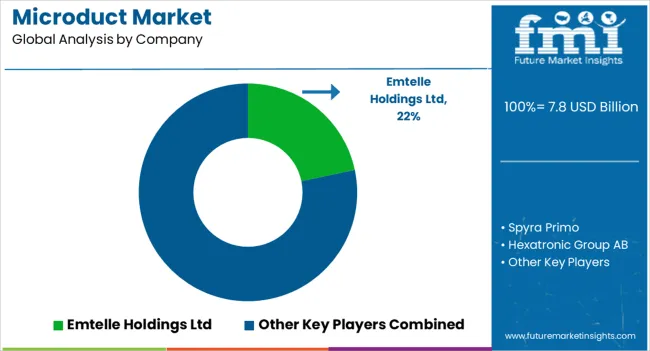
Emtelle Emtelle has been committing itself to work closely with its customers for delivering high-quality solutions and high-class technical support. The company is recognized in the global market as a full solution provider which goes the extra mile from concept to completion. Emtelle has been working tirelessly to reduce impact on climate change by sourcing environmentally friendly materials and sustaining the resources. By serving over 100 countries from 4 manufacturing sites, Emtelle has always been the suppliers choice for FTTX network deployments.
Egeplast Egeplast is a highly motivated manufacturer that has been raising the bars since decades in the production of plastic pipe systems. With customers in more than 30 countries, the company has been providing quality products and consulting solutions. The focus has always been on intelligent pipe systems for the modern, trenchless pipe installation, and restructuring processes. Established in 1908, Egeplast continues to be family-owned, and operated by the fourth generation. The highly qualified and motivated employees strive daily to satisfy the customers.

Other companies profiled: Primo, Prysmian Group, Datwyler Holding Inc., Clearfield Inc., Spur A.S., GM Plast A/S, Belden Inc.

Microduct Market Segmentation

By Type:

  • Direct Install
  • Direct Burial
  • Flame Retardant

By Application:

  • FTTX Networks
  • Other Access Networks
  • Backbone Networks
  • Data Center Application
  • Others

By Region:

  • North America
  • Latin America
  • Asia Pacific
  • The Middle East and Africa
  • Europe

Frequently Asked Questions

What is the Microduct Market Value in 2023?

The market is valued at US$ 5.54 billion in 2023.

What is the Growth Forecast for the Microduct Market?

The market is forecasted to register a CAGR of 12.1% through 2033.

How Big will be the Microduct Market by 2033?

The market is estimated to reach US$ 17.36 billion by 2033.

How was the Historical Performance of the Market?

The market registered a 10.5% CAGR from 2017 to 2022.

Which will be the Key Segment by Type?

Flame retardant will remain preferred in the market.

Table of Content
1. Executive Summary | Microduct Market
    1.1. Global Market Outlook
    1.2. Demand-side Trends
    1.3. Supply-side Trends
    1.4. Technology Roadmap Analysis
    1.5. Analysis and Recommendations
2. Market Overview
    2.1. Market Coverage / Taxonomy
    2.2. Market Definition / Scope / Limitations
3. Market Background
    3.1. Market Dynamics
        3.1.1. Drivers
        3.1.2. Restraints
        3.1.3. Opportunity
        3.1.4. Trends
    3.2. Scenario Forecast
        3.2.1. Demand in Optimistic Scenario
        3.2.2. Demand in Likely Scenario
        3.2.3. Demand in Conservative Scenario
    3.3. Opportunity Map Analysis
    3.4. Product Life Cycle Analysis
    3.5. Supply Chain Analysis
        3.5.1. Supply Side Participants and their Roles
            3.5.1.1. Producers
            3.5.1.2. Mid-Level Participants (Traders/ Agents/ Brokers)
            3.5.1.3. Wholesalers and Distributors
        3.5.2. Value Added and Value Created at Node in the Supply Chain
        3.5.3. List of Raw Material Suppliers
        3.5.4. List of Existing and Potential Buyer’s
    3.6. Investment Feasibility Matrix
    3.7. Value Chain Analysis
        3.7.1. Profit Margin Analysis
        3.7.2. Wholesalers and Distributors
        3.7.3. Retailers
    3.8. PESTLE and Porter’s Analysis
    3.9. Regulatory Landscape
        3.9.1. By Key Regions
        3.9.2. By Key Countries
    3.10. Regional Parent Market Outlook
    3.11. Production and Consumption Statistics
    3.12. Import and Export Statistics
4. Global Market Analysis 2018 to 2022 and Forecast, 2023 to 2033
    4.1. Historical Market Size Value (US$ Million) & Volume (Meter) Analysis, 2018 to 2022
    4.2. Current and Future Market Size Value (US$ Million) & Volume (Meter) Projections, 2023 to 2033
        4.2.1. Y-o-Y Growth Trend Analysis
        4.2.2. Absolute $ Opportunity Analysis
5. Global Market Analysis 2018 to 2022 and Forecast 2023 to 2033, By Type
    5.1. Introduction / Key Findings
    5.2. Historical Market Size Value (US$ Million) & Volume (Meter) Analysis By Type, 2018 to 2022
    5.3. Current and Future Market Size Value (US$ Million) & Volume (Meter) Analysis and Forecast By Type, 2023 to 2033
        5.3.1. 2-Way Microduct
        5.3.2. 3-Way Microduct
        5.3.3. 3-Way Flat Microduct
        5.3.4. 4-Way Microduct
        5.3.5. 4-Way Flat Microduct
        5.3.6. 7-Way Microduct
    5.4. Y-o-Y Growth Trend Analysis By Type, 2018 to 2022
    5.5. Absolute $ Opportunity Analysis By Type, 2023 to 2033
6. Global Market Analysis 2018 to 2022 and Forecast 2023 to 2033, By Installation Type
    6.1. Introduction / Key Findings
    6.2. Historical Market Size Value (US$ Million) & Volume (Meter) Analysis By Installation Type, 2018 to 2022
    6.3. Current and Future Market Size Value (US$ Million) & Volume (Meter) Analysis and Forecast By Installation Type, 2023 to 2033
        6.3.1. Direct Burial
        6.3.2. Direct Install
        6.3.3. Flame Retardant
    6.4. Y-o-Y Growth Trend Analysis By Installation Type, 2018 to 2022
    6.5. Absolute $ Opportunity Analysis By Installation Type, 2023 to 2033
7. Global Market Analysis 2018 to 2022 and Forecast 2023 to 2033, By Application
    7.1. Introduction / Key Findings
    7.2. Historical Market Size Value (US$ Million) & Volume (Meter) Analysis By Application, 2018 to 2022
    7.3. Current and Future Market Size Value (US$ Million) & Volume (Meter) Analysis and Forecast By Application, 2023 to 2033
        7.3.1. FTTX Networks
        7.3.2. Other Access Networks
        7.3.3. Backbone Networks
        7.3.4. Data Center Applications
    7.4. Y-o-Y Growth Trend Analysis By Application, 2018 to 2022
    7.5. Absolute $ Opportunity Analysis By Application, 2023 to 2033
8. Global Market Analysis 2018 to 2022 and Forecast 2023 to 2033, By Region
    8.1. Introduction
    8.2. Historical Market Size Value (US$ Million) & Volume (Meter) Analysis By Region, 2018 to 2022
    8.3. Current Market Size Value (US$ Million) & Volume (Meter) Analysis and Forecast By Region, 2023 to 2033
        8.3.1. North America
        8.3.2. Latin America
        8.3.3. Europe
        8.3.4. Asia Pacific
        8.3.5. MEA
    8.4. Market Attractiveness Analysis By Region
9. North America Market Analysis 2018 to 2022 and Forecast 2023 to 2033, By Country
    9.1. Historical Market Size Value (US$ Million) & Volume (Meter) Trend Analysis By Market Taxonomy, 2018 to 2022
    9.2. Market Size Value (US$ Million) & Volume (Meter) Forecast By Market Taxonomy, 2023 to 2033
        9.2.1. By Country
            9.2.1.1. USA
            9.2.1.2. Canada
        9.2.2. By Type
        9.2.3. By Installation Type
        9.2.4. By Application
    9.3. Market Attractiveness Analysis
        9.3.1. By Country
        9.3.2. By Type
        9.3.3. By Installation Type
        9.3.4. By Application
    9.4. Key Takeaways
10. Latin America Market Analysis 2018 to 2022 and Forecast 2023 to 2033, By Country
    10.1. Historical Market Size Value (US$ Million) & Volume (Meter) Trend Analysis By Market Taxonomy, 2018 to 2022
    10.2. Market Size Value (US$ Million) & Volume (Meter) Forecast By Market Taxonomy, 2023 to 2033
        10.2.1. By Country
            10.2.1.1. Brazil
            10.2.1.2. Mexico
            10.2.1.3. Rest of Latin America
        10.2.2. By Type
        10.2.3. By Installation Type
        10.2.4. By Application
    10.3. Market Attractiveness Analysis
        10.3.1. By Country
        10.3.2. By Type
        10.3.3. By Installation Type
        10.3.4. By Application
    10.4. Key Takeaways
11. Europe Market Analysis 2018 to 2022 and Forecast 2023 to 2033, By Country
    11.1. Historical Market Size Value (US$ Million) & Volume (Meter) Trend Analysis By Market Taxonomy, 2018 to 2022
    11.2. Market Size Value (US$ Million) & Volume (Meter) Forecast By Market Taxonomy, 2023 to 2033
        11.2.1. By Country
            11.2.1.1. Germany
            11.2.1.2. United kingdom
            11.2.1.3. France
            11.2.1.4. Spain
            11.2.1.5. Italy
            11.2.1.6. Rest of Europe
        11.2.2. By Type
        11.2.3. By Installation Type
        11.2.4. By Application
    11.3. Market Attractiveness Analysis
        11.3.1. By Country
        11.3.2. By Type
        11.3.3. By Installation Type
        11.3.4. By Application
    11.4. Key Takeaways
12. Asia Pacific Market Analysis 2018 to 2022 and Forecast 2023 to 2033, By Country
    12.1. Historical Market Size Value (US$ Million) & Volume (Meter) Trend Analysis By Market Taxonomy, 2018 to 2022
    12.2. Market Size Value (US$ Million) & Volume (Meter) Forecast By Market Taxonomy, 2023 to 2033
        12.2.1. By Country
            12.2.1.1. China
            12.2.1.2. Japan
            12.2.1.3. South Korea
            12.2.1.4. Singapore
            12.2.1.5. Thailand
            12.2.1.6. Indonesia
            12.2.1.7. Australia
            12.2.1.8. New Zealand
            12.2.1.9. Rest of Asia Pacific
        12.2.2. By Type
        12.2.3. By Installation Type
        12.2.4. By Application
    12.3. Market Attractiveness Analysis
        12.3.1. By Country
        12.3.2. By Type
        12.3.3. By Installation Type
        12.3.4. By Application
    12.4. Key Takeaways
13. MEA Market Analysis 2018 to 2022 and Forecast 2023 to 2033, By Country
    13.1. Historical Market Size Value (US$ Million) & Volume (Meter) Trend Analysis By Market Taxonomy, 2018 to 2022
    13.2. Market Size Value (US$ Million) & Volume (Meter) Forecast By Market Taxonomy, 2023 to 2033
        13.2.1. By Country
            13.2.1.1. GCC Countries
            13.2.1.2. South Africa
            13.2.1.3. Israel
            13.2.1.4. Rest of MEA
        13.2.2. By Type
        13.2.3. By Installation Type
        13.2.4. By Application
    13.3. Market Attractiveness Analysis
        13.3.1. By Country
        13.3.2. By Type
        13.3.3. By Installation Type
        13.3.4. By Application
    13.4. Key Takeaways
14. Key Countries Market Analysis
    14.1. USA
        14.1.1. Pricing Analysis
        14.1.2. Market Share Analysis, 2022
            14.1.2.1. By Type
            14.1.2.2. By Installation Type
            14.1.2.3. By Application
    14.2. Canada
        14.2.1. Pricing Analysis
        14.2.2. Market Share Analysis, 2022
            14.2.2.1. By Type
            14.2.2.2. By Installation Type
            14.2.2.3. By Application
    14.3. Brazil
        14.3.1. Pricing Analysis
        14.3.2. Market Share Analysis, 2022
            14.3.2.1. By Type
            14.3.2.2. By Installation Type
            14.3.2.3. By Application
    14.4. Mexico
        14.4.1. Pricing Analysis
        14.4.2. Market Share Analysis, 2022
            14.4.2.1. By Type
            14.4.2.2. By Installation Type
            14.4.2.3. By Application
    14.5. Germany
        14.5.1. Pricing Analysis
        14.5.2. Market Share Analysis, 2022
            14.5.2.1. By Type
            14.5.2.2. By Installation Type
            14.5.2.3. By Application
    14.6. United kingdom
        14.6.1. Pricing Analysis
        14.6.2. Market Share Analysis, 2022
            14.6.2.1. By Type
            14.6.2.2. By Installation Type
            14.6.2.3. By Application
    14.7. France
        14.7.1. Pricing Analysis
        14.7.2. Market Share Analysis, 2022
            14.7.2.1. By Type
            14.7.2.2. By Installation Type
            14.7.2.3. By Application
    14.8. Spain
        14.8.1. Pricing Analysis
        14.8.2. Market Share Analysis, 2022
            14.8.2.1. By Type
            14.8.2.2. By Installation Type
            14.8.2.3. By Application
    14.9. Italy
        14.9.1. Pricing Analysis
        14.9.2. Market Share Analysis, 2022
            14.9.2.1. By Type
            14.9.2.2. By Installation Type
            14.9.2.3. By Application
    14.10. China
        14.10.1. Pricing Analysis
        14.10.2. Market Share Analysis, 2022
            14.10.2.1. By Type
            14.10.2.2. By Installation Type
            14.10.2.3. By Application
    14.11. Japan
        14.11.1. Pricing Analysis
        14.11.2. Market Share Analysis, 2022
            14.11.2.1. By Type
            14.11.2.2. By Installation Type
            14.11.2.3. By Application
    14.12. South Korea
        14.12.1. Pricing Analysis
        14.12.2. Market Share Analysis, 2022
            14.12.2.1. By Type
            14.12.2.2. By Installation Type
            14.12.2.3. By Application
    14.13. Singapore
        14.13.1. Pricing Analysis
        14.13.2. Market Share Analysis, 2022
            14.13.2.1. By Type
            14.13.2.2. By Installation Type
            14.13.2.3. By Application
    14.14. Thailand
        14.14.1. Pricing Analysis
        14.14.2. Market Share Analysis, 2022
            14.14.2.1. By Type
            14.14.2.2. By Installation Type
            14.14.2.3. By Application
    14.15. Indonesia
        14.15.1. Pricing Analysis
        14.15.2. Market Share Analysis, 2022
            14.15.2.1. By Type
            14.15.2.2. By Installation Type
            14.15.2.3. By Application
    14.16. Australia
        14.16.1. Pricing Analysis
        14.16.2. Market Share Analysis, 2022
            14.16.2.1. By Type
            14.16.2.2. By Installation Type
            14.16.2.3. By Application
    14.17. New Zealand
        14.17.1. Pricing Analysis
        14.17.2. Market Share Analysis, 2022
            14.17.2.1. By Type
            14.17.2.2. By Installation Type
            14.17.2.3. By Application
    14.18. GCC Countries
        14.18.1. Pricing Analysis
        14.18.2. Market Share Analysis, 2022
            14.18.2.1. By Type
            14.18.2.2. By Installation Type
            14.18.2.3. By Application
    14.19. South Africa
        14.19.1. Pricing Analysis
        14.19.2. Market Share Analysis, 2022
            14.19.2.1. By Type
            14.19.2.2. By Installation Type
            14.19.2.3. By Application
    14.20. Israel
        14.20.1. Pricing Analysis
        14.20.2. Market Share Analysis, 2022
            14.20.2.1. By Type
            14.20.2.2. By Installation Type
            14.20.2.3. By Application
15. Market Structure Analysis
    15.1. Competition Dashboard
    15.2. Competition Benchmarking
    15.3. Market Share Analysis of Top Players
        15.3.1. By Regional
        15.3.2. By Type
        15.3.3. By Installation Type
        15.3.4. By Application
16. Competition Analysis
    16.1. Competition Deep Dive
        16.1.1. Emtelle Holdings Ltd
            16.1.1.1. Overview
            16.1.1.2. Product Portfolio
            16.1.1.3. Profitability by Market Segments
            16.1.1.4. Sales Footprint
            16.1.1.5. Strategy Overview
                16.1.1.5.1. Marketing Strategy
                16.1.1.5.2. Product Strategy
                16.1.1.5.3. Channel Strategy
        16.1.2. Spyra Primo
            16.1.2.1. Overview
            16.1.2.2. Product Portfolio
            16.1.2.3. Profitability by Market Segments
            16.1.2.4. Sales Footprint
            16.1.2.5. Strategy Overview
                16.1.2.5.1. Marketing Strategy
                16.1.2.5.2. Product Strategy
                16.1.2.5.3. Channel Strategy
        16.1.3. Hexatronic Group AB
            16.1.3.1. Overview
            16.1.3.2. Product Portfolio
            16.1.3.3. Profitability by Market Segments
            16.1.3.4. Sales Footprint
            16.1.3.5. Strategy Overview
                16.1.3.5.1. Marketing Strategy
                16.1.3.5.2. Product Strategy
                16.1.3.5.3. Channel Strategy
        16.1.4. Prysmian Group
            16.1.4.1. Overview
            16.1.4.2. Product Portfolio
            16.1.4.3. Profitability by Market Segments
            16.1.4.4. Sales Footprint
            16.1.4.5. Strategy Overview
                16.1.4.5.1. Marketing Strategy
                16.1.4.5.2. Product Strategy
                16.1.4.5.3. Channel Strategy
        16.1.5. Datwyler Holding Inc.
            16.1.5.1. Overview
            16.1.5.2. Product Portfolio
            16.1.5.3. Profitability by Market Segments
            16.1.5.4. Sales Footprint
            16.1.5.5. Strategy Overview
                16.1.5.5.1. Marketing Strategy
                16.1.5.5.2. Product Strategy
                16.1.5.5.3. Channel Strategy
        16.1.6. Egeplast International GmbH
            16.1.6.1. Overview
            16.1.6.2. Product Portfolio
            16.1.6.3. Profitability by Market Segments
            16.1.6.4. Sales Footprint
            16.1.6.5. Strategy Overview
                16.1.6.5.1. Marketing Strategy
                16.1.6.5.2. Product Strategy
                16.1.6.5.3. Channel Strategy
        16.1.7. Clearfield Inc
            16.1.7.1. Overview
            16.1.7.2. Product Portfolio
            16.1.7.3. Profitability by Market Segments
            16.1.7.4. Sales Footprint
            16.1.7.5. Strategy Overview
                16.1.7.5.1. Marketing Strategy
                16.1.7.5.2. Product Strategy
                16.1.7.5.3. Channel Strategy
        16.1.8. Spur A.S.
            16.1.8.1. Overview
            16.1.8.2. Product Portfolio
            16.1.8.3. Profitability by Market Segments
            16.1.8.4. Sales Footprint
            16.1.8.5. Strategy Overview
                16.1.8.5.1. Marketing Strategy
                16.1.8.5.2. Product Strategy
                16.1.8.5.3. Channel Strategy
        16.1.9. Fibrain Group
            16.1.9.1. Overview
            16.1.9.2. Product Portfolio
            16.1.9.3. Profitability by Market Segments
            16.1.9.4. Sales Footprint
            16.1.9.5. Strategy Overview
                16.1.9.5.1. Marketing Strategy
                16.1.9.5.2. Product Strategy
                16.1.9.5.3. Channel Strategy
        16.1.10. Draka Communications
            16.1.10.1. Overview
            16.1.10.2. Product Portfolio
            16.1.10.3. Profitability by Market Segments
            16.1.10.4. Sales Footprint
            16.1.10.5. Strategy Overview
                16.1.10.5.1. Marketing Strategy
                16.1.10.5.2. Product Strategy
                16.1.10.5.3. Channel Strategy
17. Assumptions & Acronyms Used
18. Research Methodology
Recommendations

Technology

Cloud Computing Market

May 2023

REP-GB-14488

315 pages

Technology

Fiber Optic Connectivity Market

May 2023

REP-GB-14463

342 pages

Explore Technology Insights

View Reports
Future Market Insights

Microduct Market

Schedule a Call