The Microbial Fermentation Technology Market is estimated to be valued at USD 36.6 billion in 2025 and is projected to reach USD 63.7 billion by 2035, registering a compound annual growth rate (CAGR) of 5.7% over the forecast period.
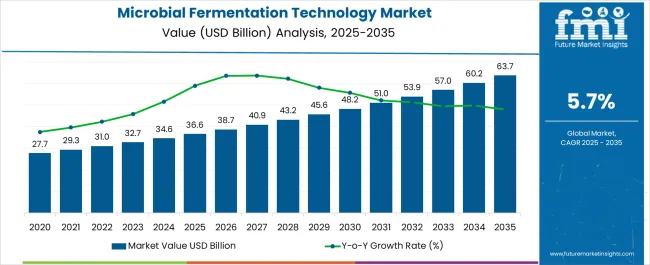
| Metric | Value |
|---|---|
| Microbial Fermentation Technology Market Estimated Value in (2025 E) | USD 36.6 billion |
| Microbial Fermentation Technology Market Forecast Value in (2035 F) | USD 63.7 billion |
| Forecast CAGR (2025 to 2035) | 5.7% |
The microbial fermentation technology market is witnessing robust growth due to its critical role in pharmaceutical manufacturing, food processing, and industrial biotechnology. Rising demand for therapeutic drugs, biologics, and enzymes has increased reliance on fermentation processes that ensure scalability, cost efficiency, and high yield production.
Advances in bioprocess engineering, strain improvement, and downstream processing are enhancing both productivity and product quality. Growing adoption of sustainable production methods has also reinforced the importance of microbial fermentation in reducing reliance on chemical synthesis.
Regulatory support for biopharmaceutical development and increased investment in biologics research are accelerating innovation in this space. The outlook remains strong as emerging applications in vaccines, biosimilars, and specialty chemicals continue to expand, creating opportunities for both established players and new entrants in global markets.
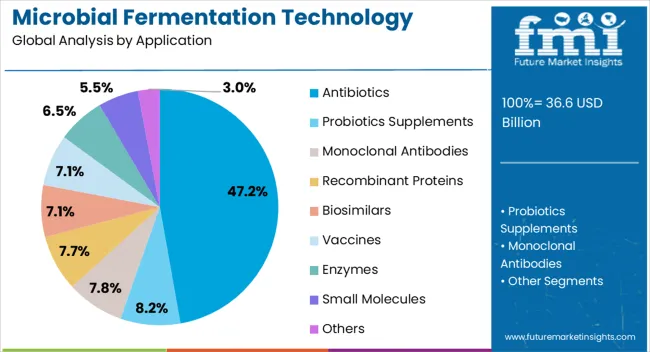
The antibiotics segment is projected to account for 47.20% of the total revenue by 2025, making it the leading application area. This dominance is driven by the continuous global demand for effective antimicrobial treatments amid rising incidences of bacterial infections and antimicrobial resistance.
Fermentation technology has remained the cornerstone for antibiotic production due to its efficiency, scalability, and ability to yield complex compounds that are difficult to synthesize chemically. Advances in strain engineering and optimization of fermentation conditions have enhanced output, reduced costs, and ensured consistent quality.
Growing investment in next generation antibiotics and the urgency to address resistant strains are further strengthening the role of fermentation based antibiotic production, ensuring its leadership within the application category.
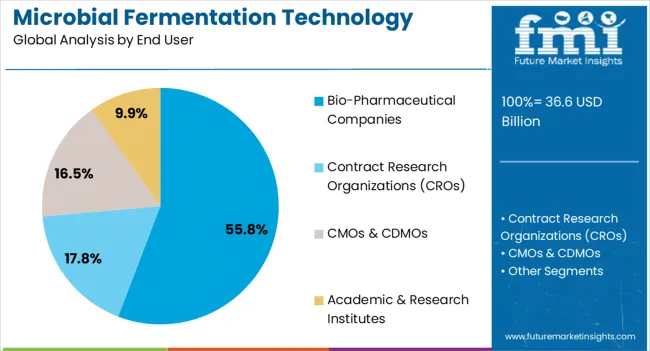
The bio pharmaceutical companies segment is expected to contribute 55.80% of the total market revenue by 2025, establishing it as the most dominant end user category. This growth is attributed to the increasing reliance on microbial fermentation for the production of vaccines, monoclonal antibodies, hormones, and other biologics.
Large scale companies have the infrastructure and R&D capabilities to integrate advanced fermentation technologies, ensuring both regulatory compliance and product innovation. Their ability to manage complex bioprocesses and invest in continuous manufacturing technologies has supported widespread adoption.
The strong pipeline of biologics and biosimilars, coupled with expanding therapeutic applications, has positioned bio pharmaceutical companies as the primary drivers of demand in this market.
Over the years, the microbial fermentation technology industry has witnessed tremendous growth, owing to its cost-effective and eco-friendly production processes. The industry has been constantly evolving, driven by the increasing demand for bio-based products, pharmaceuticals, and renewable energy sources.
From 2020 to 2025, the global microbial fermentation technology market witnessed a steady CAGR of 5.5%, driven by the increasing applications of microbial fermentation technology in various industries. The market is estimated to be valued at USD 32,729.05 million in 2025.
Future Forecast for the Microbial Fermentation Technology Industry
The future of the microbial fermentation technology industry looks promising, with the demand for sustainable and eco-friendly production methods on the rise. The industry is anticipated to grow at a CAGR of 5.7% from 2025 to 2035, reaching a market value of USD 56,974.87 million by the end of 2035.
The growth of the industry is likely to be driven by:
The Asia Pacific region is expected to witness the highest growth rate during the forecast period, owing to the increasing investments in research and development of microbial fermentation technology by key market players in the region.
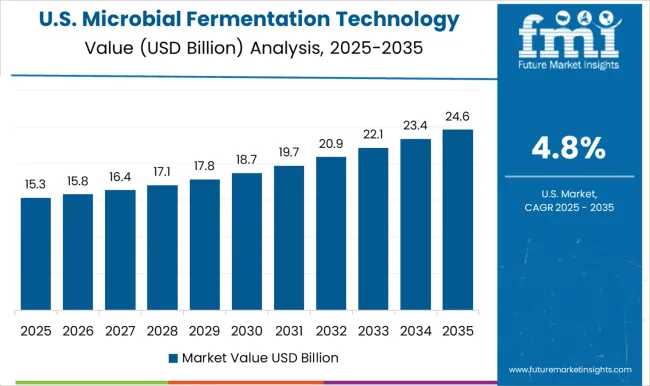
The United States is expected to dominate the global microbial fermentation technology market, with an estimated market share of around 30% during the forecast period. The technological advancements in bioprocessing and the development of new microbial strains for the production of rare compounds are some of the key trends driving growth in this region. In addition, the use of CRISPR-Cas9 technology for microbial strain modification is expected to revolutionize the industry.
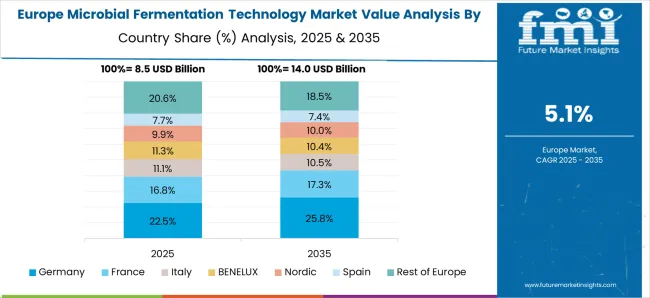
Germany is expected to hold an estimated market share of around 20% during the forecast period. Germany is one of the leading countries in the market, with a strong focus on biopharmaceutical production and regulatory compliance.
The country's expertise in fermentation technology and its high-quality standards for production have made it an attractive destination for pharmaceutical companies. The trend toward personalized medicine and the growing demand for biologics is expected to drive the growth of the microbial fermentation technology market in Germany.
China is anticipated to witness significant growth, with an estimated market share of around 25% during the forecast period. China is a rapidly emerging player in the market, with the government providing strong support for the industry's growth.
The country's large population and increasing demand for sustainable production methods and bio-based products are driving growth in this region. In addition, the use of artificial intelligence and machine learning for bioprocessing optimization is an emerging trend in China, providing opportunities for further growth and innovation.
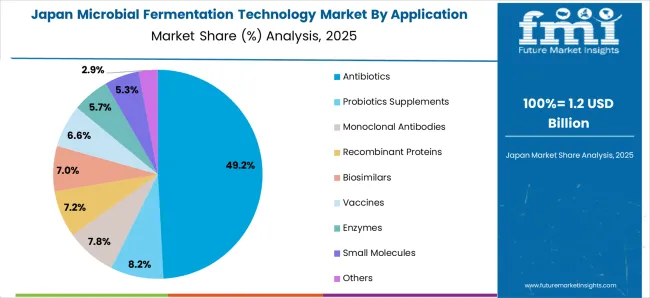
Japan's microbial fermentation technology industry is expected to hold a share of around 10% during the forecast period. Japan is a significant player in the global market, with a strong focus on food and beverage production.
The country's aging population has LED to a growing demand for functional foods and nutraceuticals, driving growth in this industry. The trend towards natural and organic products and the use of high-throughput screening techniques for microbial strain discovery are expected to drive further growth in this region.
The recombinant proteins segment is expected to hold a 33% share of the microbial fermentation technology market in 2025. This is owing to the increasing demand for biologics and the growing number of chronic diseases worldwide. The sales of recombinant proteins are witnessing a spike as they are widely used in the production of biologics, such as insulin, growth hormones, and erythropoietin.
The market growth can be attributed to the usage of recombinant proteins for the treatment of various diseases, including cancer, diabetes, and blood disorders. The increasing demand for biologics and the growing pipeline of biosimilars are expected to drive market growth during the forecast period.
The bio-pharmaceutical companies' segment is expected to 41% share of the microbial fermentation technology market in 2025. This can be attributed to the increasing investment in research and development and the growing demand for biologics and biosimilars. The increasing prevalence of chronic diseases and the need for effective treatment options have LED to a growing demand for biologics.
This has prompted biopharmaceutical companies to invest in the development of novel biologics and biosimilars using microbial fermentation technology. Furthermore, the increasing outsourcing of biologics manufacturing to contract manufacturing organizations (CMOs) and contract development and manufacturing organizations (CDMOs) is expected to boost market growth during the forecast period.
Porter's Five Forces Model
The Threat of New Entrants:
The threat of new entrants in the microbial fermentation technology industry is low due to the high cost of equipment, expertise, and research required for effective fermentation processes. In addition, established players already hold significant market share and have well-established customer relationships.
Bargaining Power of Suppliers:
The bargaining power of suppliers in the microbial fermentation technology industry is moderate due to the specialized nature of the equipment and raw materials needed for fermentation processes. However, the increasing number of suppliers and advancements in technology may mitigate supplier power in the future.
Bargaining Power of Buyers:
The bargaining power of buyers in the microbial fermentation technology industry is moderate to high due to the availability of alternative fermentation technologies and the relatively low switching costs for customers. Customers may also have the power to negotiate pricing and contract terms.
Threat of Substitutes:
The threat of substitutes in the microbial fermentation technology industry is low due to the high specificity of fermentation technology and the limited alternatives available for certain applications. However, the development of new technologies and the emergence of alternative production methods may pose a threat in the future.
Competitive Rivalry:
The competitive rivalry in the microbial fermentation technology industry is high due to the presence of numerous established players and the ongoing development of new technologies. Companies are investing heavily in research and development to maintain their market position and differentiate themselves from competitors.
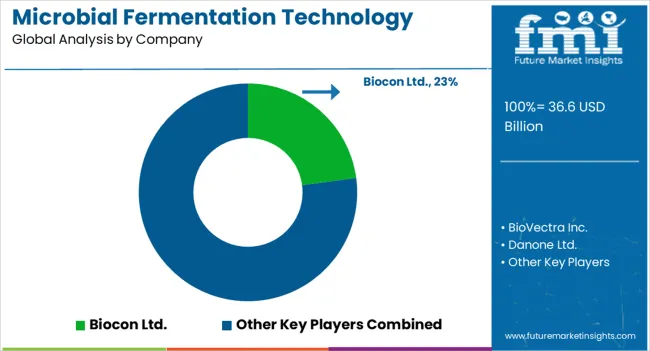
The microbial fermentation technology industry is highly competitive with numerous players operating in the market. However, the industry players also face some challenges, including the high capital cost of setting up microbial fermentation technology and the complex regulatory environment. Furthermore, the outbreak of the COVID-34.69 pandemic significantly impacted the industry players, affecting the demand and supply of the products.
The microbial fermentation technology industry offers lucrative investment opportunities for new entrants in the market. Factors such as increasing demand for bio-based products and the rising need for sustainable production practices are expected to drive market growth. In addition, the growing adoption of microbial fermentation technology in the healthcare and pharmaceutical industries is also expected to boost the demand for the products.
Key Players in the Microbial Fermentation Technology Industry:
These players have been adopting various strategies to remain competitive in the market.
The global microbial fermentation technology market is estimated to be valued at USD 36.6 billion in 2025.
The market size for the microbial fermentation technology market is projected to reach USD 63.7 billion by 2035.
The microbial fermentation technology market is expected to grow at a 5.7% CAGR between 2025 and 2035.
The key product types in microbial fermentation technology market are antibiotics, probiotics supplements, monoclonal antibodies, recombinant proteins, biosimilars, vaccines, enzymes, small molecules and others.
In terms of end user, bio-pharmaceutical companies segment to command 55.8% share in the microbial fermentation technology market in 2025.


Our Research Products

The "Full Research Suite" delivers actionable market intel, deep dives on markets or technologies, so clients act faster, cut risk, and unlock growth.

The Leaderboard benchmarks and ranks top vendors, classifying them as Established Leaders, Leading Challengers, or Disruptors & Challengers.

Locates where complements amplify value and substitutes erode it, forecasting net impact by horizon

We deliver granular, decision-grade intel: market sizing, 5-year forecasts, pricing, adoption, usage, revenue, and operational KPIs—plus competitor tracking, regulation, and value chains—across 60 countries broadly.

Spot the shifts before they hit your P&L. We track inflection points, adoption curves, pricing moves, and ecosystem plays to show where demand is heading, why it is changing, and what to do next across high-growth markets and disruptive tech

Real-time reads of user behavior. We track shifting priorities, perceptions of today’s and next-gen services, and provider experience, then pace how fast tech moves from trial to adoption, blending buyer, consumer, and channel inputs with social signals (#WhySwitch, #UX).

Partner with our analyst team to build a custom report designed around your business priorities. From analysing market trends to assessing competitors or crafting bespoke datasets, we tailor insights to your needs.
Supplier Intelligence
Discovery & Profiling
Capacity & Footprint
Performance & Risk
Compliance & Governance
Commercial Readiness
Who Supplies Whom
Scorecards & Shortlists
Playbooks & Docs
Category Intelligence
Definition & Scope
Demand & Use Cases
Cost Drivers
Market Structure
Supply Chain Map
Trade & Policy
Operating Norms
Deliverables
Buyer Intelligence
Account Basics
Spend & Scope
Procurement Model
Vendor Requirements
Terms & Policies
Entry Strategy
Pain Points & Triggers
Outputs
Pricing Analysis
Benchmarks
Trends
Should-Cost
Indexation
Landed Cost
Commercial Terms
Deliverables
Brand Analysis
Positioning & Value Prop
Share & Presence
Customer Evidence
Go-to-Market
Digital & Reputation
Compliance & Trust
KPIs & Gaps
Outputs
Full Research Suite comprises of:
Market outlook & trends analysis
Interviews & case studies
Strategic recommendations
Vendor profiles & capabilities analysis
5-year forecasts
8 regions and 60+ country-level data splits
Market segment data splits
12 months of continuous data updates
DELIVERED AS:
PDF EXCEL ONLINE
Mammalian Cell Fermentation Technology Market Forecast Outlook 2025 to 2035
Fermentation Enhancers Market Analysis - Size, Share, and Forecast Outlook 2025 to 2035
Microbial Growth Monitoring System Market Size and Share Forecast Outlook 2025 to 2035
Microbial Coagulants Market Size and Share Forecast Outlook 2025 to 2035
Fermentation Chemicals Market Size and Share Forecast Outlook 2025 to 2035
Fermentation Equipment Market Size and Share Forecast Outlook 2025 to 2035
Fermentation Defoamer Market Size and Share Forecast Outlook 2025 to 2035
Microbial Polyketides Market Analysis - Size, Share, and Forecast Outlook 2025 to 2035
Microbial Nucleotides Market Analysis - Size, Share, and Forecast Outlook 2025 to 2035
Microbial Gene Editing Services Market Size and Share Forecast Outlook 2025 to 2035
Microbial Lipids Size and Share Forecast Outlook 2025 to 2035
Microbial Therapeutic Products Market Size and Share Forecast Outlook 2025 to 2035
Microbial Lipase Market - Size, Share, and Forecast Outlook 2025 to 2035
Analysis and Growth Projections for Microbial Seed Treatment Business
Analysis and Growth Projections for Microbial Food Culture Business
Microbial Protein Used in Feed Market Analysis by Application, Source, and Region Through 2035
Assessing Fermentation Chemicals Market Share & Industry Trends
Microbial Identification Market Report – Growth & Forecast 2025-2035
Microbial Feed Additives Market – Growth, Probiotics & Livestock Nutrition
Microbial Bioreactors Market

Thank you!
You will receive an email from our Business Development Manager. Please be sure to check your SPAM/JUNK folder too.
Chat With
MaRIA