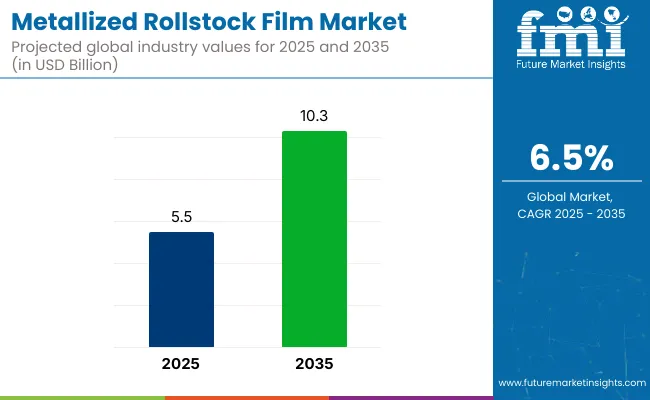
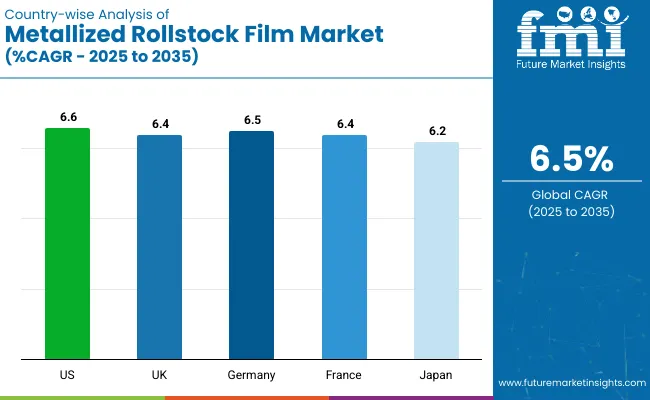
The global metallized rollstock film market size is expected to be valued at US$ 4.8 billion in 2023. Thriving food & beverage industry, bolsters the overall scope for metallized rollstock film market, which is projected to grow at a CAGR of 7.0% between 2023 and 2033, totaling around US$ 9.4 billion by 2033.
Data Points | Key Statistics |
---|---|
Metallized Rollstock Film Market Value 2023 | US$ 4.8 billion |
Metallized Rollstock Film Market Projected Value (2033) | US$ 9.4 billion |
Metallized Rollstock Film Market CAGR (2023 to 2033) | 7.0% |
The growing popularity of flexible packaging is a significant factor driving the increased demand for metallized rollstock films. Flexible packaging has become increasingly preferred by manufacturers and consumers alike due to its numerous advantages over traditional rigid packaging formats.
Flexible packaging, including metallized rollstock films, is typically lighter than rigid alternatives, such as glass or metal containers. The lightweight nature reduces transportation costs and environmental impact during shipping, making it an attractive option for businesses looking to optimize their supply chain and reduce overall packaging costs.
Flexible packaging takes up less space compared to rigid packaging, enabling more products to be transported and stored in the same amount of space. The space efficiency translates to cost savings in warehousing and transportation, making it a preferred choice for manufacturers and retailers.
Metallized rollstock films are designed to provide excellent barrier properties against oxygen, moisture, light, and other external factors that can degrade the quality of the packaged goods. The films help extend the shelf life of perishable products like food and pharmaceuticals, reducing food waste and enhancing product freshness, by creating a protective barrier.
Flexible packaging offers a wide range of design possibilities and customization options, allowing brands to create visually appealing packaging that aligns with their brand identity. Metallized rollstock films, with their shiny and metallic appearance, add a premium and eye-catching appeal to the packaging, making products stand out on store shelves.
Don't pay for what you don't need
Customize your report by selecting specific countries or regions and save 30%!
The global demand for metallized rollstock film is projected to increase at a CAGR of 3.3% during the forecast period between 2018 and 2022, reaching a total of US$ 9.4 billion in 2033.
According to Future Market Insights, a market research and competitive intelligence provider, the metallized rollstock film market was valued at US$ 4.5 billion in 2022.
The shift towards high-barrier packaging is a crucial trend that is boosting the demand for metallized rollstock films in various industries. Perishable and sensitive products, such as food items, pharmaceuticals, and electronics, require packaging solutions that can effectively protect them from external elements that can compromise their quality, safety, and shelf life.
Metallized rollstock films are engineered to provide exceptional barrier properties, making them an ideal choice for industries seeking enhanced protection for their products. Oxygen and moisture are two of the most significant factors that can lead to product spoilage, degradation, and loss of freshness.
Metallized rollstock films act as an effective barrier against these elements, reducing the risk of oxidation and moisture absorption within the packaged products. The preservation of freshness is crucial for perishable items like fruits, vegetables, and bakery products, as well as sensitive products like certain pharmaceuticals.
Metallized rollstock films contribute to extending the shelf life of products, by minimizing the exposure to external factors. The prolonged shelf life not only benefits manufacturers by reducing waste and inventory management costs but also offers consumers the assurance of buying products with longer freshness and efficacy.
Electronics and electronic components are highly sensitive to moisture and oxygen. Metallized rollstock films with excellent barrier properties safeguard these products during storage, transportation, and handling. The protection is particularly crucial for sensitive electronic devices, circuit boards, and semiconductor components.
Technological Advancements in Metallization is Likely to be Beneficial for Market Growth
Technological advancements in metallization have significantly contributed to the improvement of metallized rollstock films, making them more effective and versatile for various packaging applications. The metallization process involves depositing a thin layer of metal, typically aluminum, onto a plastic film substrate to create a barrier that protects the packaged contents from external elements such as moisture, oxygen, and light.
Vacuum metallization is a widely used technique in the production of metallized rollstock films. The process involves placing the plastic film and a metal source (usually aluminum wire) inside a vacuum chamber. The chamber is then evacuated to create a low-pressure environment, and the metal source is heated until it evaporates and condenses onto the film surface. Technological advancements in vacuum metallization have led to more precise and controlled deposition of the metal layer, resulting in uniform and consistent coatings with improved barrier properties.
Plasma coating is another advanced technique used in metallization. It involves introducing a gas, such as argon or nitrogen, into the vacuum chamber and ionizing it with electrical energy to create a plasma. The plasma interacts with the metal vapor, enhancing the adhesion of the metal to the plastic film surface. The process enables the production of metallized rollstock films with enhanced mechanical strength and improved resistance to delamination, ensuring that the metal layer remains securely bonded to the film.
Technological advancements have enabled the production of thinner metal coatings on the film substrate. Thin film metallization not only reduces the overall weight of the packaging but also optimizes material usage and cost-efficiency. Despite the thinner metal layer, these advanced films can offer excellent barrier performance, making them suitable for a wide range of packaging applications.
E-Commerce Packaging Requirements to Fuel the Market Growth
The rapid growth of the e-commerce industry has revolutionized the way products are packaged and delivered to customers. The demand for efficient and effective e-commerce packaging solutions has surged, as online shopping becomes increasingly popular. Metallized rollstock films have emerged as a favored choice for e-commerce packaging due to their unique properties that cater to the specific requirements of this fast-paced and competitive market.
One of the primary concerns in e-commerce packaging is ensuring that products arrive at their destination in pristine condition. Metallized rollstock films provide an additional layer of protection due to their barrier properties. The thin layer of metal, typically aluminum, serves as a reliable barrier against moisture, oxygen, and other external factors that could potentially damage the contents of the package during transit. The films help maintain product quality and extend shelf life, by safeguarding products from environmental elements.
E-commerce packages often go through a series of handling and transportation stages before reaching the customer. Metallized rollstock films offer excellent impact resistance and strength, protecting the contents from shocks and bumps during shipping. The durability ensures that delicate or fragile items remain intact, reducing the likelihood of returns and customer dissatisfaction.
Packaging plays a significant role in shaping the customer's perception of a product and the brand. Metallized rollstock films offer a premium appearance and eye-catching aesthetics, elevating the unboxing experience for customers. The reflective and metallic sheen of the film imparts a sense of luxury and sophistication, creating a memorable first impression for the customer. The premium appearance enhances the perceived value of the product, contributing to positive customer experiences and brand loyalty.
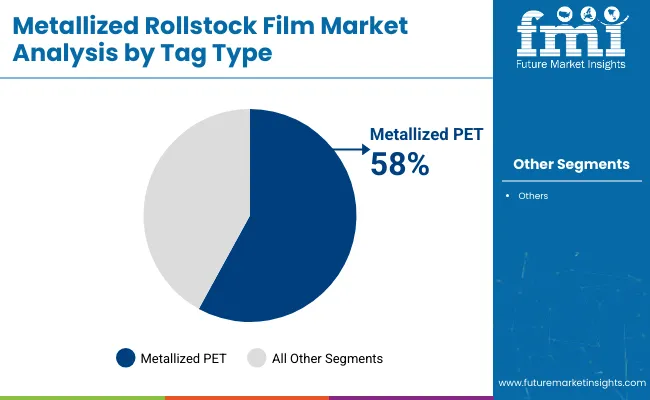
Metallized PET to Take the Lion’s Share
By tag type, metallized PET segment is estimated to be the leading segment at a CAGR of 6.9% during the forecast period.
Metallized PET tags offer excellent barrier properties against oxygen, moisture, and other external elements. The tags help in preserving the freshness and quality of fresh produce, extending their shelf life during transportation and storage.
Metallized PET tags have a glossy and metallic appearance that enhances the visual appeal of the fresh produce trays. The reflective surface of the tags catches the light, making the products more eye-catching and attractive to consumers.
The metallized PET tags provide a smooth surface for printing brand logos, product information, and marketing messages. Retailers and growers can leverage this space to promote their brand and create a strong visual identity for their fresh produce.
Metallized PET is a recyclable material, making it an environmentally-friendly choice for fresh produce tags. Consumers and retailers are increasingly conscious of sustainable packaging options, and using recyclable materials can positively impact the brand's image.
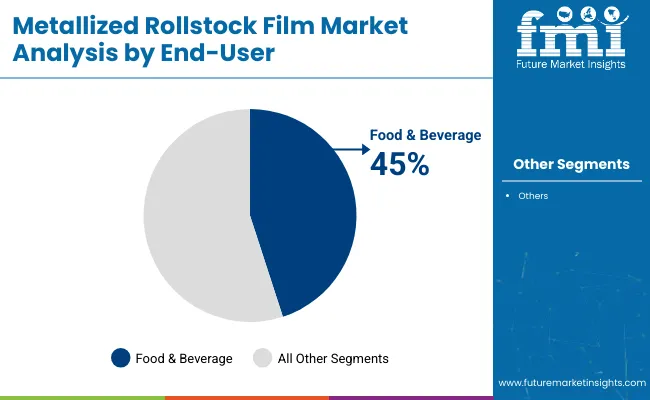
Food & Beverage to Take the Lion’s Share
Based on the end-use, the food & beverage segment holds the largest share of the market. The segment is expected to hold a CAGR of 6.9% during the forecast period.
The rising global population and increasing awareness of the importance of a healthy diet are driving the demand for fresh fruits and vegetables. There is a growing need for efficient and sustainable packaging solutions like fresh produce trays to protect and preserve the quality of these perishable items.
The expansion of retail and supermarket chains worldwide has led to an increase in the volume of fresh produce being transported and displayed. Fresh produce trays play a crucial role in organizing and presenting these items attractively to consumers, leading to a higher demand for such packaging solutions.
Food safety is a critical concern for consumers and retailers alike. Fresh produce trays offer a hygienic and secure packaging option, preventing contamination and damage during transit. The adoption of reliable packaging solutions like fresh produce trays is expected to grow, as food safety regulations become more stringent.
The United States is home to some of the world’s largest food processing and foodservice companies that are looking for packaging solutions that can enhance the shelf life of their products. The factor is expected to drive the metallized rollstock film market in the North American region. The region is expected to hold a CAGR of 6.9% over the analysis period. A similar trend is supposed to be followed by the European countries led by Germany, Italy, the United Kingdom, France, and Spain.
There is a high demand for processed food among people. India and China are the growth engines of the Asia Pacific region, and also, due to the continuous rise in industrialization, the demand for metallized rollstock films market is expected to attain growth prospects. Latin America and the Middle East and Africa region are expected to witness average growth in the metallized rollstock film market during the forecast period.
Get the data you need at a Fraction of the cost
Personalize your report by choosing insights you need
and save 40%!
Key players in the metallized rollstock film market are strongly focusing on profit generation from their existing product portfolios along while exploring potential new applications. The players are emphasizing on increasing their metallized rollstock film production capacities, to cater to the demand from numerous end use industries. Prominent players are also pushing for geographical expansion to decrease the dependency on imported metallized rollstock film.
Recent Developments:
Attribute | Details |
---|---|
Forecast Period | 2023 to 2033 |
Historical Data Available for | 2018 to 2022 |
Market Analysis | USD Billion for value and Tons for Volume |
Key Regions Covered | North America, Latin America, Western Europe, Eastern Europe, South Asia & Pacific, East Asia, and Middle East & Africa |
Key Countries Covered | United States, Canada, Brazil, Mexico, Germany, United Kingdom, France, Spain, Italy, Poland, Russia, Czech Republic, Romania, India, Bangladesh, Australia, New Zealand, China, Japan, South Korea, GCC Countries, South Africa, Israel. |
Key Segments Covered | Material, Thickness, End Use, Region |
Key Companies Profiled |
|
Report Coverage | Market Forecast, brand share analysis, competition intelligence, DROT analysis, Market Dynamics and Challenges, Strategic Growth Initiatives |
Customization & Pricing | Available upon Request |
From 2018 to 2022, the market registered a CAGR of 3.3%.
The market is estimated to reach US$ 9.4 billion by 2033.
The food & beverages hold high revenue potential.
The United States, Canada, and Germany dominate the global market.
The market is forecast to register a CAGR of 7% through 2033.
1. Executive Summary
1.1. Global Market Outlook
1.2. Demand-side Trends
1.3. Supply-side Trends
1.4. Technology Roadmap Analysis
1.5. Analysis and Recommendations
2. Market Overview
2.1. Market Coverage / Taxonomy
2.2. Market Definition / Scope / Limitations
3. Market Background
3.1. Market Dynamics
3.1.1. Drivers
3.1.2. Restraints
3.1.3. Opportunity
3.1.4. Trends
3.2. Scenario Forecast
3.2.1. Demand in Optimistic Scenario
3.2.2. Demand in Likely Scenario
3.2.3. Demand in Conservative Scenario
3.3. Opportunity Map Analysis
3.4. Product Life Cycle Analysis
3.5. Supply Chain Analysis
3.5.1. Supply Side Participants and their Roles
3.5.1.1. Producers
3.5.1.2. Mid-Level Participants (Traders/ Agents/ Brokers)
3.5.1.3. Wholesalers and Distributors
3.5.2. Value Added and Value Created at Node in the Supply Chain
3.5.3. List of Raw Material Suppliers
3.5.4. List of Existing and Potential Buyer’s
3.6. Investment Feasibility Matrix
3.7. Value Chain Analysis
3.7.1. Profit Margin Analysis
3.7.2. Wholesalers and Distributors
3.7.3. Retailers
3.8. PESTLE and Porter’s Analysis
3.9. Regulatory Landscape
3.9.1. By Key Regions
3.9.2. By Key Countries
3.10. Regional Parent Market Outlook
3.11. Production and Consumption Statistics
3.12. Import and Export Statistics
4. Global Market Analysis 2018 to 2022 and Forecast, 2023 to 2033
4.1. Historical Market Size Value (US$ Million) & Volume (Tons) Analysis, 2018 to 2022
4.2. Current and Future Market Size Value (US$ Million) & Volume (Tons) Projections, 2023 to 2033
4.2.1. Y-o-Y Growth Trend Analysis
4.2.2. Absolute $ Opportunity Analysis
5. Global Market Analysis 2018 to 2022 and Forecast 2023 to 2033, By Material
5.1. Introduction / Key Findings
5.2. Historical Market Size Value (US$ Million) & Volume (Tons) Analysis By Material, 2018 to 2022
5.3. Current and Future Market Size Value (US$ Million) & Volume (Tons) Analysis and Forecast By Material, 2023 to 2033
5.3.1. Metallized PP
5.3.2. Metallized PET
5.4. Y-o-Y Growth Trend Analysis By Material, 2018 to 2022
5.5. Absolute $ Opportunity Analysis By Material, 2023 to 2033
6. Global Market Analysis 2018 to 2022 and Forecast 2023 to 2033, By Thickness
6.1. Introduction / Key Findings
6.2. Historical Market Size Value (US$ Million) & Volume (Tons) Analysis By Thickness, 2018 to 2022
6.3. Current and Future Market Size Value (US$ Million) & Volume (Tons) Analysis and Forecast By Thickness, 2023 to 2033
6.3.1. Less than 50 Micron
6.3.2. 50-100 Microns
6.3.3. 101-150 Micron
6.3.4. Above 150 Micron
6.4. Y-o-Y Growth Trend Analysis By Thickness, 2018 to 2022
6.5. Absolute $ Opportunity Analysis By Thickness, 2023 to 2033
7. Global Market Analysis 2018 to 2022 and Forecast 2023 to 2033, By End Use
7.1. Introduction / Key Findings
7.2. Historical Market Size Value (US$ Million) & Volume (Tons) Analysis By End Use, 2018 to 2022
7.3. Current and Future Market Size Value (US$ Million) & Volume (Tons) Analysis and Forecast By End Use, 2023 to 2033
7.3.1. Food & Beverage
7.3.2. Pharmaceuticals
7.3.3. Chemical & Fertilizers
7.3.4. Cosmetic & Personal Care
7.3.5. Homecare
7.4. Y-o-Y Growth Trend Analysis By End Use, 2018 to 2022
7.5. Absolute $ Opportunity Analysis By End Use, 2023 to 2033
8. Global Market Analysis 2018 to 2022 and Forecast 2023 to 2033, By Region
8.1. Introduction
8.2. Historical Market Size Value (US$ Million) & Volume (Tons) Analysis By Region, 2018 to 2022
8.3. Current Market Size Value (US$ Million) & Volume (Tons) Analysis and Forecast By Region, 2023 to 2033
8.3.1. North America
8.3.2. Latin America
8.3.3. Western Europe
8.3.4. Eastern Europe
8.3.5. South Asia and Pacific
8.3.6. East Asia
8.3.7. Middle East and Africa
8.4. Market Attractiveness Analysis By Region
9. North America Market Analysis 2018 to 2022 and Forecast 2023 to 2033, By Country
9.1. Historical Market Size Value (US$ Million) & Volume (Tons) Trend Analysis By Market Taxonomy, 2018 to 2022
9.2. Market Size Value (US$ Million) & Volume (Tons) Forecast By Market Taxonomy, 2023 to 2033
9.2.1. By Country
9.2.1.1. The USA
9.2.1.2. Canada
9.2.2. By Material
9.2.3. By Thickness
9.2.4. By End Use
9.3. Market Attractiveness Analysis
9.3.1. By Country
9.3.2. By Material
9.3.3. By Thickness
9.3.4. By End Use
9.4. Key Takeaways
10. Latin America Market Analysis 2018 to 2022 and Forecast 2023 to 2033, By Country
10.1. Historical Market Size Value (US$ Million) & Volume (Tons) Trend Analysis By Market Taxonomy, 2018 to 2022
10.2. Market Size Value (US$ Million) & Volume (Tons) Forecast By Market Taxonomy, 2023 to 2033
10.2.1. By Country
10.2.1.1. Brazil
10.2.1.2. Mexico
10.2.1.3. Rest of Latin America
10.2.2. By Material
10.2.3. By Thickness
10.2.4. By End Use
10.3. Market Attractiveness Analysis
10.3.1. By Country
10.3.2. By Material
10.3.3. By Thickness
10.3.4. By End Use
10.4. Key Takeaways
11. Western Europe Market Analysis 2018 to 2022 and Forecast 2023 to 2033, By Country
11.1. Historical Market Size Value (US$ Million) & Volume (Tons) Trend Analysis By Market Taxonomy, 2018 to 2022
11.2. Market Size Value (US$ Million) & Volume (Tons) Forecast By Market Taxonomy, 2023 to 2033
11.2.1. By Country
11.2.1.1. Germany
11.2.1.2. United Kingdom
11.2.1.3. France
11.2.1.4. Spain
11.2.1.5. Italy
11.2.1.6. Rest of Western Europe
11.2.2. By Material
11.2.3. By Thickness
11.2.4. By End Use
11.3. Market Attractiveness Analysis
11.3.1. By Country
11.3.2. By Material
11.3.3. By Thickness
11.3.4. By End Use
11.4. Key Takeaways
12. Eastern Europe Market Analysis 2018 to 2022 and Forecast 2023 to 2033, By Country
12.1. Historical Market Size Value (US$ Million) & Volume (Tons) Trend Analysis By Market Taxonomy, 2018 to 2022
12.2. Market Size Value (US$ Million) & Volume (Tons) Forecast By Market Taxonomy, 2023 to 2033
12.2.1. By Country
12.2.1.1. Poland
12.2.1.2. Russia
12.2.1.3. Czech Republic
12.2.1.4. Romania
12.2.1.5. Rest of Eastern Europe
12.2.2. By Material
12.2.3. By Thickness
12.2.4. By End Use
12.3. Market Attractiveness Analysis
12.3.1. By Country
12.3.2. By Material
12.3.3. By Thickness
12.3.4. By End Use
12.4. Key Takeaways
13. South Asia and Pacific Market Analysis 2018 to 2022 and Forecast 2023 to 2033, By Country
13.1. Historical Market Size Value (US$ Million) & Volume (Tons) Trend Analysis By Market Taxonomy, 2018 to 2022
13.2. Market Size Value (US$ Million) & Volume (Tons) Forecast By Market Taxonomy, 2023 to 2033
13.2.1. By Country
13.2.1.1. India
13.2.1.2. Bangladesh
13.2.1.3. Australia
13.2.1.4. New Zealand
13.2.1.5. Rest of South Asia and Pacific
13.2.2. By Material
13.2.3. By Thickness
13.2.4. By End Use
13.3. Market Attractiveness Analysis
13.3.1. By Country
13.3.2. By Material
13.3.3. By Thickness
13.3.4. By End Use
13.4. Key Takeaways
14. East Asia Market Analysis 2018 to 2022 and Forecast 2023 to 2033, By Country
14.1. Historical Market Size Value (US$ Million) & Volume (Tons) Trend Analysis By Market Taxonomy, 2018 to 2022
14.2. Market Size Value (US$ Million) & Volume (Tons) Forecast By Market Taxonomy, 2023 to 2033
14.2.1. By Country
14.2.1.1. China
14.2.1.2. Japan
14.2.1.3. South Korea
14.2.2. By Material
14.2.3. By Thickness
14.2.4. By End Use
14.3. Market Attractiveness Analysis
14.3.1. By Country
14.3.2. By Material
14.3.3. By Thickness
14.3.4. By End Use
14.4. Key Takeaways
15. Middle East and Africa Market Analysis 2018 to 2022 and Forecast 2023 to 2033, By Country
15.1. Historical Market Size Value (US$ Million) & Volume (Tons) Trend Analysis By Market Taxonomy, 2018 to 2022
15.2. Market Size Value (US$ Million) & Volume (Tons) Forecast By Market Taxonomy, 2023 to 2033
15.2.1. By Country
15.2.1.1. GCC Countries
15.2.1.2. South Africa
15.2.1.3. Israel
15.2.1.4. Rest of MEA
15.2.2. By Material
15.2.3. By Thickness
15.2.4. By End Use
15.3. Market Attractiveness Analysis
15.3.1. By Country
15.3.2. By Material
15.3.3. By Thickness
15.3.4. By End Use
15.4. Key Takeaways
16. Key Countries Market Analysis
16.1. USA
16.1.1. Pricing Analysis
16.1.2. Market Share Analysis, 2022
16.1.2.1. By Material
16.1.2.2. By Thickness
16.1.2.3. By End Use
16.2. Canada
16.2.1. Pricing Analysis
16.2.2. Market Share Analysis, 2022
16.2.2.1. By Material
16.2.2.2. By Thickness
16.2.2.3. By End Use
16.3. Brazil
16.3.1. Pricing Analysis
16.3.2. Market Share Analysis, 2022
16.3.2.1. By Material
16.3.2.2. By Thickness
16.3.2.3. By End Use
16.4. Mexico
16.4.1. Pricing Analysis
16.4.2. Market Share Analysis, 2022
16.4.2.1. By Material
16.4.2.2. By Thickness
16.4.2.3. By End Use
16.5. Germany
16.5.1. Pricing Analysis
16.5.2. Market Share Analysis, 2022
16.5.2.1. By Material
16.5.2.2. By Thickness
16.5.2.3. By End Use
16.6. United Kingdom
16.6.1. Pricing Analysis
16.6.2. Market Share Analysis, 2022
16.6.2.1. By Material
16.6.2.2. By Thickness
16.6.2.3. By End Use
16.7. France
16.7.1. Pricing Analysis
16.7.2. Market Share Analysis, 2022
16.7.2.1. By Material
16.7.2.2. By Thickness
16.7.2.3. By End Use
16.8. Spain
16.8.1. Pricing Analysis
16.8.2. Market Share Analysis, 2022
16.8.2.1. By Material
16.8.2.2. By Thickness
16.8.2.3. By End Use
16.9. Italy
16.9.1. Pricing Analysis
16.9.2. Market Share Analysis, 2022
16.9.2.1. By Material
16.9.2.2. By Thickness
16.9.2.3. By End Use
16.10. Poland
16.10.1. Pricing Analysis
16.10.2. Market Share Analysis, 2022
16.10.2.1. By Material
16.10.2.2. By Thickness
16.10.2.3. By End Use
16.11. Russia
16.11.1. Pricing Analysis
16.11.2. Market Share Analysis, 2022
16.11.2.1. By Material
16.11.2.2. By Thickness
16.11.2.3. By End Use
16.12. Czech Republic
16.12.1. Pricing Analysis
16.12.2. Market Share Analysis, 2022
16.12.2.1. By Material
16.12.2.2. By Thickness
16.12.2.3. By End Use
16.13. Romania
16.13.1. Pricing Analysis
16.13.2. Market Share Analysis, 2022
16.13.2.1. By Material
16.13.2.2. By Thickness
16.13.2.3. By End Use
16.14. India
16.14.1. Pricing Analysis
16.14.2. Market Share Analysis, 2022
16.14.2.1. By Material
16.14.2.2. By Thickness
16.14.2.3. By End Use
16.15. Bangladesh
16.15.1. Pricing Analysis
16.15.2. Market Share Analysis, 2022
16.15.2.1. By Material
16.15.2.2. By Thickness
16.15.2.3. By End Use
16.16. Australia
16.16.1. Pricing Analysis
16.16.2. Market Share Analysis, 2022
16.16.2.1. By Material
16.16.2.2. By Thickness
16.16.2.3. By End Use
16.17. New Zealand
16.17.1. Pricing Analysis
16.17.2. Market Share Analysis, 2022
16.17.2.1. By Material
16.17.2.2. By Thickness
16.17.2.3. By End Use
16.18. China
16.18.1. Pricing Analysis
16.18.2. Market Share Analysis, 2022
16.18.2.1. By Material
16.18.2.2. By Thickness
16.18.2.3. By End Use
16.19. Japan
16.19.1. Pricing Analysis
16.19.2. Market Share Analysis, 2022
16.19.2.1. By Material
16.19.2.2. By Thickness
16.19.2.3. By End Use
16.20. South Korea
16.20.1. Pricing Analysis
16.20.2. Market Share Analysis, 2022
16.20.2.1. By Material
16.20.2.2. By Thickness
16.20.2.3. By End Use
16.21. GCC Countries
16.21.1. Pricing Analysis
16.21.2. Market Share Analysis, 2022
16.21.2.1. By Material
16.21.2.2. By Thickness
16.21.2.3. By End Use
16.22. South Africa
16.22.1. Pricing Analysis
16.22.2. Market Share Analysis, 2022
16.22.2.1. By Material
16.22.2.2. By Thickness
16.22.2.3. By End Use
16.23. Israel
16.23.1. Pricing Analysis
16.23.2. Market Share Analysis, 2022
16.23.2.1. By Material
16.23.2.2. By Thickness
16.23.2.3. By End Use
17. Market Structure Analysis
17.1. Competition Dashboard
17.2. Competition Benchmarking
17.3. Market Share Analysis of Top Players
17.3.1. By Regional
17.3.2. By Material
17.3.3. By Thickness
17.3.4. By End Use
18. Competition Analysis
18.1. Competition Deep Dive
18.1.1. Uflex Ltd
18.1.1.1. Overview
18.1.1.2. Product Portfolio
18.1.1.3. Profitability by Market Segments
18.1.1.4. Sales Footprint
18.1.1.5. Strategy Overview
18.1.1.5.1. Marketing Strategy
18.1.1.5.2. Product Strategy
18.1.1.5.3. Channel Strategy
18.1.2. Jindal Poly Films Limited
18.1.2.1. Overview
18.1.2.2. Product Portfolio
18.1.2.3. Profitability by Market Segments
18.1.2.4. Sales Footprint
18.1.2.5. Strategy Overview
18.1.2.5.1. Marketing Strategy
18.1.2.5.2. Product Strategy
18.1.2.5.3. Channel Strategy
18.1.3. Klockner Pentaplast Europe GmbH & Co. KG
18.1.3.1. Overview
18.1.3.2. Product Portfolio
18.1.3.3. Profitability by Market Segments
18.1.3.4. Sales Footprint
18.1.3.5. Strategy Overview
18.1.3.5.1. Marketing Strategy
18.1.3.5.2. Product Strategy
18.1.3.5.3. Channel Strategy
18.1.4. AR Metallizing N.V.
18.1.4.1. Overview
18.1.4.2. Product Portfolio
18.1.4.3. Profitability by Market Segments
18.1.4.4. Sales Footprint
18.1.4.5. Strategy Overview
18.1.4.5.1. Marketing Strategy
18.1.4.5.2. Product Strategy
18.1.4.5.3. Channel Strategy
18.1.5. Treofan Group
18.1.5.1. Overview
18.1.5.2. Product Portfolio
18.1.5.3. Profitability by Market Segments
18.1.5.4. Sales Footprint
18.1.5.5. Strategy Overview
18.1.5.5.1. Marketing Strategy
18.1.5.5.2. Product Strategy
18.1.5.5.3. Channel Strategy
18.1.6. Cosmo Films Ltd
18.1.6.1. Overview
18.1.6.2. Product Portfolio
18.1.6.3. Profitability by Market Segments
18.1.6.4. Sales Footprint
18.1.6.5. Strategy Overview
18.1.6.5.1. Marketing Strategy
18.1.6.5.2. Product Strategy
18.1.6.5.3. Channel Strategy
18.1.7. Toray Plastics (America) Inc
18.1.7.1. Overview
18.1.7.2. Product Portfolio
18.1.7.3. Profitability by Market Segments
18.1.7.4. Sales Footprint
18.1.7.5. Strategy Overview
18.1.7.5.1. Marketing Strategy
18.1.7.5.2. Product Strategy
18.1.7.5.3. Channel Strategy
18.1.8. DUNMORE Corporation
18.1.8.1. Overview
18.1.8.2. Product Portfolio
18.1.8.3. Profitability by Market Segments
18.1.8.4. Sales Footprint
18.1.8.5. Strategy Overview
18.1.8.5.1. Marketing Strategy
18.1.8.5.2. Product Strategy
18.1.8.5.3. Channel Strategy
18.1.9. SRF Limited
18.1.9.1. Overview
18.1.9.2. Product Portfolio
18.1.9.3. Profitability by Market Segments
18.1.9.4. Sales Footprint
18.1.9.5. Strategy Overview
18.1.9.5.1. Marketing Strategy
18.1.9.5.2. Product Strategy
18.1.9.5.3. Channel Strategy
18.1.10. LPS Industries
18.1.10.1. Overview
18.1.10.2. Product Portfolio
18.1.10.3. Profitability by Market Segments
18.1.10.4. Sales Footprint
18.1.10.5. Strategy Overview
18.1.10.5.1. Marketing Strategy
18.1.10.5.2. Product Strategy
18.1.10.5.3. Channel Strategy
18.1.11. Hua Xian Brother Packaging Co. Ltd.
18.1.11.1. Overview
18.1.11.2. Product Portfolio
18.1.11.3. Profitability by Market Segments
18.1.11.4. Sales Footprint
18.1.11.5. Strategy Overview
18.1.11.5.1. Marketing Strategy
18.1.11.5.2. Product Strategy
18.1.11.5.3. Channel Strategy
19. Assumptions & Acronyms Used
20. Research Methodology
Explore Packaging Insights
View Reports