The metal stampings, forgings, and castings market will be around USD 522,489 million by 2025. It will be around USD 901,234 million with a 5.6% compound annual growth rate (CAGR) by 2035.
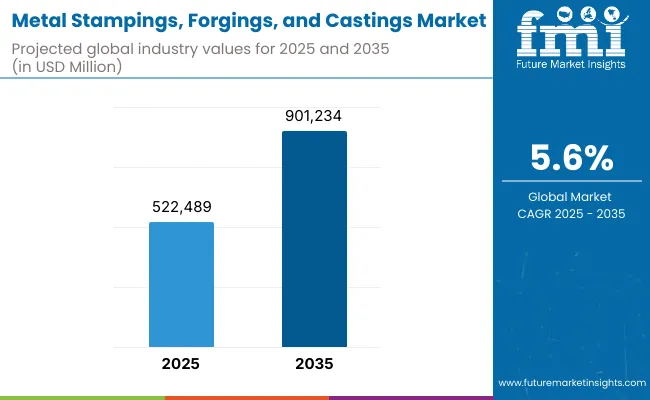
The international market for metal forgings, castings, and metal stampings will grow steadily over the years because demand continues to exist in the machinery, automotive, and aerospace sectors.
Metal-forming operations are taking over the production of precision and long-life parts that will be used on engines, heavy machines, and structural parts. Because industries needed lighter-weight items, high-performance alloys, and advanced production processes, precision metalworking demand grew increasingly crucial.
Demand is addressed by advancements in high-strength material, stamping and forging robots, and the growing use of additive manufacturing to supplement traditional casting operations. The design of electric vehicles, advancements in space technology, and renewable power equipment for infrastructure also create demand for precision-machined metal parts. With industries diversifying and expanding, the metal stampings, forgings, and castings industry charts a steady growth course up to 2035.
North America is a vast market for metal castings, forgings, and stampings with a solid foundation of automotive production, defense expenditures, and aerospace expansion. The United States leads the region with ongoing technological development and shifting towards local production to reduce dependence on global supply chains.
Europe is a pioneer in green manufacturing technology, high-performance vehicle manufacturing, and industrial specification requirements. Germany, the UK, and Italy rank second with their precision metal processing for electric cars, rail transportation, and solar and wind systems.
Asia-Pacific is the fastest-growing region, driven by intensive industrialization, booming automobile and construction sectors, and increasing infrastructure activity. The region is controlled by China, India, Japan, and South Korea, which have governments promoting local industry and foreign capital in metal processing plants. Dominance in regional markets is also achieved through superiority in consumer electronics and heavy machinery.
Challenges: Raw Material Price Volatility, Environmental Regulations, and Lack of Skilled Labor
The steel's specialty alloy, metal casting, forging, and aluminum business also has to contend with raw material price fluctuation in the case of steel, aluminum, and specialty alloys. Environmental regulatory requirements for waste disposal and emissions are more costly to meet. Human resource scarcity in conducting high-level metalworking operations is also prevalent, and companies are therefore at a disadvantage in terms of quality and efficiency.
Opportunities: Aerospace Growth, Automation, and Light Metals
With all these challenges, there is also a positive set of opportunities for growth in the market. Light metals' automobile and aviation usage extends genius to ultra-high-strength alloys and hybrid metallic-composite structures. Roboticized and automated forging and punching lines improve accuracy and lower production costs. Expansion of space flight and commercial airliner flying also continues to drive requirements for precision-fabricated metal components to supply growth in the market.
Demand between 2020 and 2024 was strong as firms overcame supply chain issues and reorganized to achieve the highest manufacturing efficiencies. The automotive industry used light metal parts to reduce fuel consumption, and aerospace firms spent more on high-performance alloys. The years also witnessed more automated stamping and forging machines to achieve the highest production rates.
Between 2025 and 2035, firms will adopt AI-quality control, green metal processing technology, and 3D printing technology. The carbon-neutrization rate will be the major driving force behind the adoption of green metalworking technology, digital twins, and foresight insight to improve accuracy and minimize material wastage. With global development, enterprise demands for metal forging, stamping, and casting will increase step by step to satisfy future generations' transportation, construction, and industry demands.
Market Shifts: A Comparative Analysis 2020 to 2024 vs. 2025 to 2035
| Market Shift | 2020 to 2024 Trends |
|---|---|
| Regulatory Landscape | Adherence to emissions standards and occupational safety regulations. |
| Consumer Trends | Need for light metal parts in automotive and aerospace applications. |
| Industry Adoption | Application in the automotive, aerospace, and heavy equipment industries. |
| Supply Chain and Sourcing | Reliance on traditional steel, aluminum, and iron vendors. |
| Market Competition | Domination by legacy metal forming firms and international foundries. |
| Market Growth Drivers | Driven by industrial growth, vehicle manufacturing, and infrastructure development. |
| Sustainability & Impact | Early efforts at waste minimization and energy conservation. |
| Integration of Technology | Use of CNC machining and robotic welding. |
| Advancements in Design | Standardized metal forming processes with minimal customization. |
| Market Shift | 2025 to 2035 Projections |
|---|---|
| Regulatory Landscape | Stricter carbon footprint policies, increased use of recycled metal, and ESG mandates. |
| Consumer Trends | Growth in electric vehicle (EV) structural components and aerospace additive forging. |
| Industry Adoption | Expansion into renewable energy components, medical implants, and smart infrastructure. |
| Supply Chain and Sourcing | Adoption of green metal procurement and circular economy initiatives. |
| Market Competition | Entry of 3D metal printing firms and AI-driven precision casting specialists. |
| Market Growth Drivers | Driven by high-performance alloys, lightweight materials, and automation in production. |
| Sustainability & Impact | Widespread adoption of closed-loop recycling, net-zero emission forging, and scrap reuse. |
| Integration of Technology | Expansion of AI-driven defect detection, IoT-enabled metal forming, and digital twins. |
| Advancements in Design | Development of ultra-precise castings, hybrid manufacturing, and shape-memory alloys. |
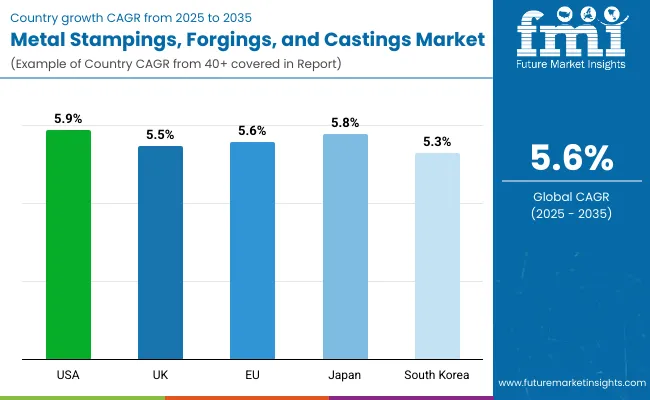
The USA market for metal stampings, forgings, and metal castings is on a solid rebound with unprecedented demand levels across a range of industries, especially aerospace, defense and electric vehicle (EV) manufacturing. The focus on high-strength but lightweight material is increasing demand for high-strength aluminum alloys and titanium, which are growing in applications in aircraft structures as well as EV chassis.
Additionally, federal policies, like the Bipartisan Infrastructure Law, impact local metal manufacturers, which have received government subsidies to increase capacity and ease mounting industrial pressures. As the defense and transportation industries evolve, metalworking companies are investing in new technologies in increasingly sophisticated ways to achieve maximum efficiency and performance of materials.
| Country | CAGR (2025 to 2035) |
|---|---|
| USA | 5.9% |
United Kingdom's metalworking industry is being prompted by increased investment in green manufacturing technology and precision metalworking technology. The increased demand for offshore wind power has created an increased demand for corrosion-resistant metal components capable of tolerating aggressive sea environments.
Domestic defense manufacturing is also subject to increased production, which necessitates defense-grade performance alloys for defense vehicles, warplanes, and warships. Computer system monitoring and automation maximally guarantee production accuracy in an effort to generate enhanced quality. With the UK continuing towards sustainability goals, businesses are spending money on energy-saving technologies such as advanced recycling systems in an effort to eliminate waste and encourage the use of renewable resources.
| Country | CAGR (2025 to 2035) |
|---|---|
| UK | 5.5% |
The European Union metal industry is spurred on by regulatory initiatives promoting green production and recycling technologies. Germany and France, to cite just a couple of them, are at the forefront of the additive manufacturing (3D printing) technologies that produce lightweight automobile and industrial components with less wastage of material.
Stricter green laws drive metal manufacturers to low-emission casting and forging plants, which are in line with the EU's concept of carbon neutrality. Furthermore, substantial investments in research and development have triggered innovation in green metal alloys. Because the country is developing toward a circular economy, metal producers remain efficient and sustainable.
| Country | CAGR (2025 to 2035) |
|---|---|
| EU | 5.6% |
Japan's market for metal stampings, forgings, and castings remains healthy with a focus on precision engineering to robotics, high-speed rail building, and semiconductor-quality castings. The country is leading in developing ultra-lightweight alloys for future electric and hybrid vehicles with enhanced energy efficiency and strength.
Japan's modern manufacturing industry combines high-precision machine finishing and automation with a commitment to delivering highly accurate and durable metal components. Its history of experience in metallurgical research also fuels the creation of high-performance aerospace and electronic-grade materials. With continuous advances in technology, Japanese manufacturers continue to hold their ground and supply critical components for high-tech industries worldwide.
| Country | CAGR (2025 to 2035) |
|---|---|
| Japan | 5.8% |
South Korea's metals working industry is growing fiercely, with the backbone being its leading shipbuilding and automobile industries. South Korea is investing massive amounts of money in AI-casting technology, smart foundries, and metalworking automation to improve output efficiency and prevent defects. Technologies allow for quicker and more precise production of metal components for electric vehicles, high-speed trains, and advanced warships.
Besides, South Korea's strong connections with EV producers fuel demand for sophisticated metal forming processes, which enable the shift to light, high-strength materials. With the nation set to remain dominant in industrial innovation, its metalworking sector is a key part of global supply chains.
| Country | CAGR (2025 to 2035) |
|---|---|
| South Korea | 5.3% |
| By Product | Market Share (2025) |
|---|---|
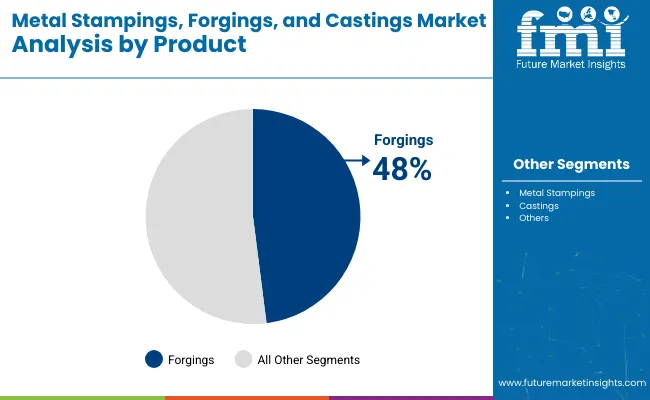
| Forgings | 48% |
Forgings are anticipated to dominate the metal stampings, forgings, and castings business with a 48% share of the total demand by 2025. Their enhanced strength, fatigue life, and high-pressure resistance properties make them invaluable in motor, aerospace, and industrial marking equipment applications.
Major auto producers such as Tesla and Boeing depend on precision-forged elements for structure, efficiency, and performance in electric vehicles and airplanes. In addition, the defense and renewable energy sectors' preference to transition towards light but robust components also keeps demand for forgings growing, especially wind turbine gearboxes and defense products.
| By End-Use Industry | Market Share (2025) |
|---|---|
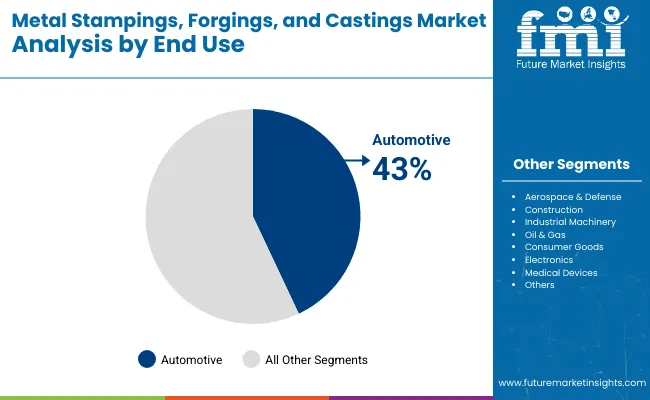
| Automotive | 43% |
Automotive will lead the metal stampings, forgings, and casting market demand at 43% in 2025. Growth of electric vehicles (EVs), fuel economy standards, and demands for high-performance parts are major growth drivers. Forged aluminum and high-strength steel parts are employed by top companies like Volkswagen, Toyota, and Ford to offer maximum car strength with lighter weights.
The demand also increases due to the use of accurate metal stampings in powertrain components and battery enclosures. Moreover, with explosive growth in autonomous and electric mobility, demand will increase for corrosion-resistant, long-lasting, and light metal parts as well, thus making the automotive market the largest.
Growing demand for lightweight automobile parts, high-precision aerospace parts, and industrial equipment has boosted the market for metal castings, forging, and stamping. Companies are adopting advanced forming technology, mechanization, and machine learning-based defect inspection to enhance efficiency and material usage. Industry players are investing in high-strength alloys, near-net-shape manufacturing, and hybrid additive processes to achieve maximum performance with minimum waste.
Market Share Analysis by Company
| Company Name | Estimated Market Share (%) |
|---|---|
| Precision Castparts Corp. | 24-28% |
| Bharat Forge Limited | 18-22% |
| Howmet Aerospace | 14-18% |
| Thyssenkrupp AG | 10-14% |
| Ryerson Holding Corporation | 6-10% |
| Other Companies (combined) | 14-18% |
| Company Name | Key Offerings/Activities |
|---|---|
| Precision Castparts Corp. | Launched titanium-aluminum alloy castings for future-generation aircraft engines in 2024. In 2025, increased its automated forging facilities in North America to address aerospace and defense requirements. |
| Bharat Forge Limited | In 2024, launched electric vehicle (EV) chassis forgings with up to 30% weight reduction. In 2025, created AI-driven forging simulations to maximize metal flow in high-stress parts. |
| Howmet Aerospace | In 2024, improved aluminum die casting capabilities were added to build space exploration modules. In 2025, collaborated with commercial airlines to make low-drag titanium wing brackets for fuel economy. |
| Thyssenkrupp AG | In 2024, smart stamping lines for high-strength steel auto components were introduced. In 2025, increased application of closed-die forging in high-performance turbine components. |
| Ryerson Holding Corporation | In 2024, a recycled metal initiative was initiated to manufacture environmentally friendly stainless steel stampings. In 2025, implemented real-time monitoring in its cast operations to reduce defects. |
Key Company Insights
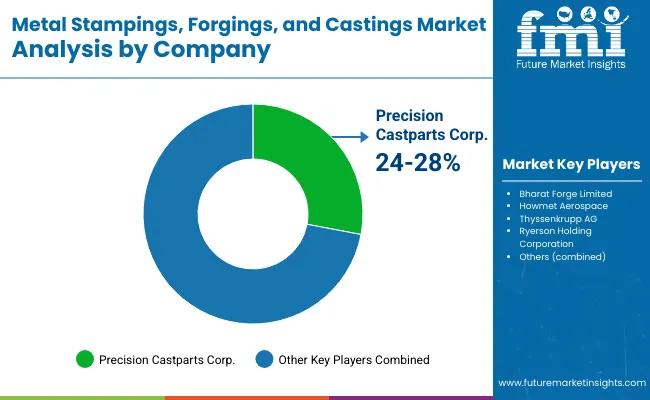
Precision Castparts Corp. (24-28%)
Precision Castparts is the industry-leading provider of casting and forging solutions of the advanced type for aerospace and industry. Its titanium and superalloys capability is a market leader in high-performance segments.
Bharat Forge Limited (18-22%)
Bharat Forge is the worldwide leader in forged components, especially in auto and defence segments. Its metal shaping processes using AI create efficiency in electric vehicles and heavy-load usage.
Howmet Aerospace (14-18%)
Howmet is a solutions leader in light metals, producing precision-cast and forged components to the aerospace and space business units. Its aluminum casting and hybrid forging expertise is the foundation of its structural applications business.
Thyssenkrupp AG (10-14%)
Thyssenkrupp uses its metallurgical expertise to create innovative forgings and stampings for the automotive and energy sectors. Its smart factory strategy and applications of high-strength steel ensure long-term success.
Ryerson Holding Corporation (6-10%)
Ryerson stands out for its focus on process innovation and sustainability in live metal stamping and casting. Its recycled stainless steel program aligns with the industry trend toward environmentally sound manufacturing practices.
Other Key Players (14-18% Combined)
The overall market size for the metal stampings, forgings, and castings market was USD 522,489 million in 2025.
The metal stampings, forgings, and castings market is expected to reach USD 901,234 million in 2035.
The increasing demand from various industries such as automotive, aerospace, construction, and industrial machinery fuels the metal stampings, forgings, and castings market during the forecast period.
The top 5 countries which drive the development of the metal stampings, forgings, and castings market are USA, China, Germany, Japan, and India.
On the basis of application, the automotive sector to command significant share over the forecast period.


Our Research Products

The "Full Research Suite" delivers actionable market intel, deep dives on markets or technologies, so clients act faster, cut risk, and unlock growth.

The Leaderboard benchmarks and ranks top vendors, classifying them as Established Leaders, Leading Challengers, or Disruptors & Challengers.

Locates where complements amplify value and substitutes erode it, forecasting net impact by horizon

We deliver granular, decision-grade intel: market sizing, 5-year forecasts, pricing, adoption, usage, revenue, and operational KPIs—plus competitor tracking, regulation, and value chains—across 60 countries broadly.

Spot the shifts before they hit your P&L. We track inflection points, adoption curves, pricing moves, and ecosystem plays to show where demand is heading, why it is changing, and what to do next across high-growth markets and disruptive tech

Real-time reads of user behavior. We track shifting priorities, perceptions of today’s and next-gen services, and provider experience, then pace how fast tech moves from trial to adoption, blending buyer, consumer, and channel inputs with social signals (#WhySwitch, #UX).

Partner with our analyst team to build a custom report designed around your business priorities. From analysing market trends to assessing competitors or crafting bespoke datasets, we tailor insights to your needs.
Supplier Intelligence
Discovery & Profiling
Capacity & Footprint
Performance & Risk
Compliance & Governance
Commercial Readiness
Who Supplies Whom
Scorecards & Shortlists
Playbooks & Docs
Category Intelligence
Definition & Scope
Demand & Use Cases
Cost Drivers
Market Structure
Supply Chain Map
Trade & Policy
Operating Norms
Deliverables
Buyer Intelligence
Account Basics
Spend & Scope
Procurement Model
Vendor Requirements
Terms & Policies
Entry Strategy
Pain Points & Triggers
Outputs
Pricing Analysis
Benchmarks
Trends
Should-Cost
Indexation
Landed Cost
Commercial Terms
Deliverables
Brand Analysis
Positioning & Value Prop
Share & Presence
Customer Evidence
Go-to-Market
Digital & Reputation
Compliance & Trust
KPIs & Gaps
Outputs
Full Research Suite comprises of:
Market outlook & trends analysis
Interviews & case studies
Strategic recommendations
Vendor profiles & capabilities analysis
5-year forecasts
8 regions and 60+ country-level data splits
Market segment data splits
12 months of continuous data updates
DELIVERED AS:
PDF EXCEL ONLINE
Metallurgical Lighting Market Size and Share Forecast Outlook 2025 to 2035
Metal Evaporation Boat Market Size and Share Forecast Outlook 2025 to 2035
Metal Miniature Bone Plates Market Size and Share Forecast Outlook 2025 to 2035
Metal Pallet Market Size and Share Forecast Outlook 2025 to 2035
Metal Oxide Varistor (MOV) Surge Arresters Market Size and Share Forecast Outlook 2025 to 2035
Metal Straw Market Size and Share Forecast Outlook 2025 to 2035
Metal Can Market Size and Share Forecast Outlook 2025 to 2035
Metal IBC Market Forecast and Outlook 2025 to 2035
Metalized Barrier Film Market Forecast and Outlook 2025 to 2035
Metal Packaging Market Size and Share Forecast Outlook 2025 to 2035
Metal Bellow Market Size and Share Forecast Outlook 2025 to 2035
Metal based Safety Gratings Market Size and Share Forecast Outlook 2025 to 2035
Metal Modifiers Market Size and Share Forecast Outlook 2025 to 2035
Metallic Stearate Market Size and Share Forecast Outlook 2025 to 2035
Metallic Labels Market Size and Share Forecast Outlook 2025 to 2035
Metal Recycling Market Size and Share Forecast Outlook 2025 to 2035
Metal Forming Fluids Market Size and Share Forecast Outlook 2025 to 2035
Metal Removal Fluids Market Size and Share Forecast Outlook 2025 to 2035
Metal Deactivators Market Size and Share Forecast Outlook 2025 to 2035
Metal Film Analog Potentiometers Market Size and Share Forecast Outlook 2025 to 2035

Thank you!
You will receive an email from our Business Development Manager. Please be sure to check your SPAM/JUNK folder too.
Chat With
MaRIA