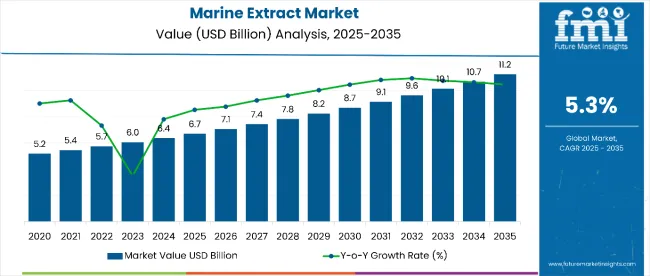
The marine extract market is estimated to be valued at USD 6.7 billion in 2025 and is projected to reach USD 11.2 billion by 2035, registering a CAGR of 5.3% over the forecast period.
| Metric | Value |
|---|---|
| Market Estimated Value (2025E) | USD 6.7 billion |
| Market Forecast Value (2035F) | USD 11.2 billion |
| Forecast CAGR (2025 to 2035) | 5.3% |
The market is expected to add an absolute dollar opportunity of USD 4.5 billion from 2025 to 2035, reflecting a growth in value. This growth will be driven by surging demand for natural and ethically sourced bioactive compounds, expanding functional food & nutraceutical applications, and growing consumer preference for clean-label, eco-friendly products.
By 2030, the market is likely to reach approximately USD 8.7 billion, generating USD 2.0 billion in absolute dollar growth over the first half of the period. The remaining USD 2.5 billion is expected to be added between 2030 and 2035, indicating a moderately back-loaded growth pattern. Demand is increasing due to marine extracts’ strong antioxidant, anti-inflammatory, and antibacterial properties, coupled with their potential in pharmaceuticals, cosmetics, and agriculture.
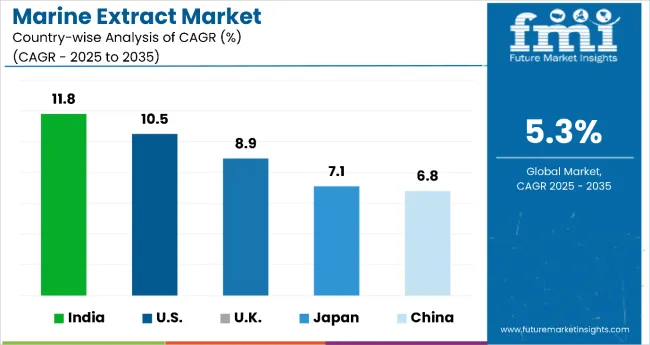
Key companies such as TripleNine Group, Pelagia AS, and FMC Corporation are enhancing competitiveness through eco-friendly sourcing, technological advancements in extraction, and product diversification into high-value sectors. The fastest-growing markets will be India (CAGR 11.8%), U.S. (10.5%), and U.K. (8.9%), supported by the rapid expansion of health & wellness product demand. Market growth will remain anchored in eco-friendly harvesting, high bioactive compound yields, and alignment with global environmental goals.
The market holds approximately 18% of the global functional ingredient market, driven by its high-value bioactives such as omega-3 fatty acids, antioxidants, proteins, and polysaccharides. It accounts for around 22% of the natural antioxidant market, supported by strong applications in nutraceuticals, pharmaceuticals, and functional foods. The market contributes nearly 15% to the marine-derived protein market, particularly for value-added products like fish oil concentrates, algae-based powders, and marine collagen. It holds close to 20% of the omega-3 ingredient market, where marine extracts are valued for their purity, bioavailability, and ethically sourced origins. The share in the clean-label ingredient market reaches about 12%, reflecting rising demand among health-conscious consumers seeking natural and responsibly sourced solutions.
The market’s expansion is driven by eco-friendly harvesting practices, advancements in extraction technology, and innovation in product formulations such as powders, concentrates, and encapsulated marine bioactives. Manufacturers are increasingly focusing on eco-friendly sourcing, organic certification, and high-purity ingredients to cater to the premium nutraceutical, skincare, and functional beverage sectors.
The market is segmented by material, capacity, and region. By material, the market is bifurcated into plastic (polyethylene, polycarbonate, polyethylene terephthalate, polypropylene, and other plastics such as bioplastics, polystyrene, and polyvinyl chloride), and paperboard. Based on capacity, the market is divided into storing up to 50 tubes, storing 51 to 100 tubes, storing 100 to 150 tubes, and storing above 150 tubes. Regionally, the market is classified into North America, Latin America, Western Europe, Eastern Europe, South Asia and Pacific, East Asia, and the Middle East & Africa.
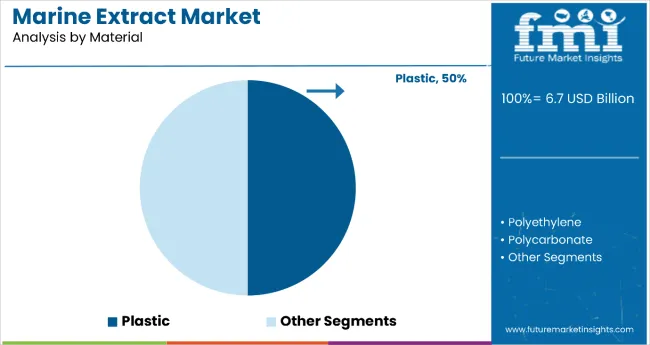
Plastic leads the market by value with an estimated 50% share in 2025 and is set to capture the largest absolute-dollar gains from 2025 to 2035. Its dominance stems from performance, cost advantages for marine bioactives such as PET and PP deliver strong oxygen/moisture barriers, UV protection, chemical inertness with omega-3s, peptides, and polysaccharides, and reliable heat–cold stability for concentrates, powders, and serums. Plastics also enable lightweight logistics and high-speed filling, reducing unit costs versus paperboard while extending shelf lifecritical for clean-label, preservative-light formulations in functional foods, nutraceuticals, and cosmetics.
The plastic segment benefits from ongoing innovations in eco-friendly and bio-based polymers, which are helping it maintain market leadership despite rising environmental scrutiny. Manufacturers are increasingly adopting recycled PET (rPET) and biodegradable plastics, aligning with marine conservation narratives and eco-conscious branding strategies. The scalability of plastic manufacturing, combined with customization options such as tinted barriers, antimicrobial coatings, and portion-control designs, position it as the preferred choice for both established brands and new entrants targeting premium health, wellness, and skincare markets from 2025 to 2035.
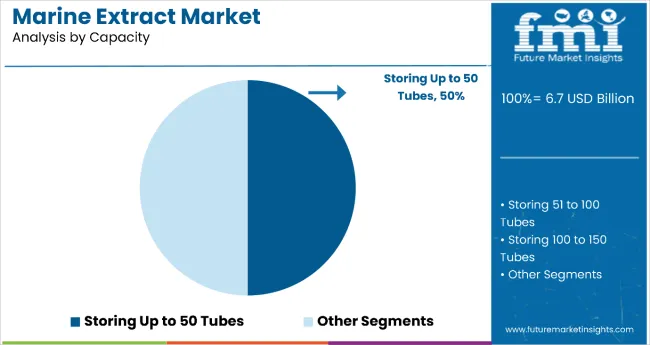
The most lucrative segment by capacity is storing up to 50 tubes, holding a 50.0% market share in 2025. This dominance is attributed to its widespread adoption in research laboratories, pharmaceutical manufacturing, and biotechnology facilities, where small-batch, high-value marine extract samples are handled. The segment benefits from lower infrastructure costs, ease of integration into existing workflows, and suitability for high-precision applications such as nutraceutical formulation, marine-derived cosmetics, and functional food ingredient development.
Growing demand for marine bioactives like omega-3 fatty acids, collagen, and chitos an used in premium health and wellness products further strengthens its position. In addition, small-capacity storage offers better temperature stability, reduced contamination risk, and enhanced sample traceability, aligning with global GMP and ISO standards. With marine extract R&D investments surging in Asia-Pacific, particularly in Japan, China, and India, this segment is expected to maintain its lead, driving consistent profitability for manufacturers.
From 2025 to 2035, nutraceutical, functional food, and pharmaceutical companies increasingly incorporate marine-derived ingredients such as omega-3s, collagen, and bioactive peptides to leverage their proven benefits for heart health, joint support, and skin wellness. This shift positions marine extract suppliers offering sustainably sourced, high-purity, and standardized products as key partners in meeting the rising demand for natural, science-backed health solutions.
Supply, Cost, and Regulatory Barriers Limiting Marine Extract Market Expansion
Despite the strong health and nutritional potential of marine extracts, market growth is hindered by supply chain vulnerabilities, high production expenses, and strict regulatory frameworks. Limited and seasonal availability of marine biomass, coupled with overfishing concerns, can create raw material shortages and affect consistency in product quality. Advanced extraction methods such as supercritical CO₂ or enzymatic processing demand significant capital investment, restricting entry for smaller players. Furthermore, regulatory approvals for use in functional foods, nutraceuticals, and pharmaceuticals often involve lengthy, costly testing to verify safety and efficacy, delaying commercialization timelines. These factors collectively pose challenges to widespread adoption, especially in cost-sensitive markets.
Key Restraints Hindering Growth and Adoption in the Global Marine Extract Market
Despite strong growth prospects, the marine extract market faces challenges related to raw material supply constraints, high production costs, and stringent regulatory requirements. Seasonal fluctuations in marine biomass availability, coupled with overfishing concerns, can disrupt supply chains and limit consistent product quality. Additionally, advanced extraction technologies such as supercritical CO₂ or enzymatic processing require significant capital investment, raising entry barriers for smaller producers. Regulatory approvals for use in pharmaceuticals, nutraceuticals, and cosmetics often involve lengthy, expensive testing to validate safety and efficacy, which can delay product launches. These factors collectively restrain faster market penetration and may limit adoption in price-sensitive segments.
| Countries | CAGR (2025 to 2035) |
|---|---|
| India | 11.8% |
| USA | 10.5% |
| UK | 8.9% |
| Japan | 7.1% |
| China | 6.8% |
In the marine extract market, India stands out with the fastest projected CAGR of 11.8% from 2025 to 2035, driven by abundant coastal resources, government-backed aquaculture expansion, and rising nutraceutical demand. The USA follows at 10.5%, supported by advanced R&D, premium product standards, and strong consumer awareness of marine-based nutrition. The UK is projected at 8.9%, leveraging eco-friendly sourcing, high-value processing, and a robust research ecosystem. Japan’s growth, at 7.1%, reflects its mature yet innovation-driven market, focusing on functional foods, anti-aging cosmetics, and marine-derived health products for its aging population. China, while expanding at 6.8%, benefits from scale, abundant marine resources, and booming e-commerce, though growth is slightly slower than peers due to market maturity in certain product segments.
The report covers an in-depth analysis of 40+ countries; five top-performing OECD countries are highlighted below.
Revenue from marine extracts in India is projected to grow at a remarkable CAGR of 11.8% from 2025 to 2035, driven by surging demand in nutraceuticals, pharmaceuticals, and functional foods. India benefits from vast coastal resources, making it a prime location for high-volume marine extract production. Government initiatives supporting aquaculture and eco-friendly harvesting further strengthen production capacity.
Domestic firms are increasing investments in processing facilities equipped with modern extraction technologies. Rising global interest in omega-3-rich products and marine collagen enhances export opportunities. Collaborations between fisheries and biotech companies are fostering innovation. India’s position as both a high-demand domestic market and a cost-competitive exporter makes it one of the fastest-growing regions in the global marine extract industry.
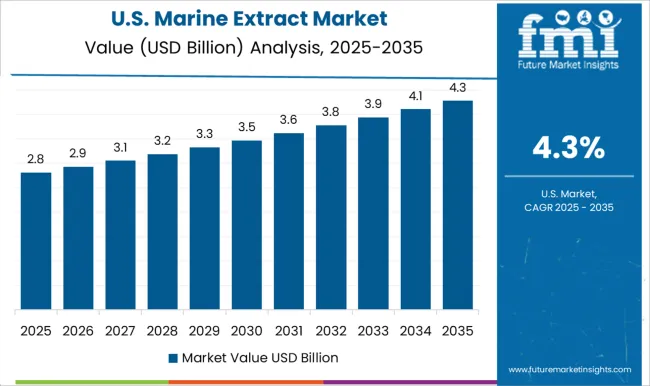
Sales of marine extracts in USA are expected to expand at a CAGR of 10.5% between 2025 and 2035, supported by robust demand in dietary supplements, cosmetics, and pharmaceutical applications. Advanced R&D capabilities and high product quality standards position the USA as a leader in premium-grade marine extract production. Major companies are scaling up capacity to meet both domestic and international demand.
The market benefits from a mature supply chain, cutting-edge extraction technology, and strong consumer awareness about marine-based nutrition. Eco-friendly sourcing practices and certifications enhance competitiveness in export markets. Growth is further driven by rising consumption of functional foods fortified with marine bioactives. With expanding application diversity, the USA continues to strengthen its dominance in the premium marine extract space.
The UK marine extract market is set to grow at a CAGR of 8.9% from 2025 to 2035, driven by increasing demand in functional foods, pharmaceuticals, and personal care products. The country’s strong focus on sustainability and traceable sourcing practices aligns with EU and global quality standards. Companies are investing in advanced marine biotechnology and processing facilities to enhance extraction yields.
The UK’s robust research ecosystem supports product innovation, particularly in high-value collagen and omega-3 applications. Imports of raw marine biomass are supplemented by domestic processing capabilities, catering to both local and export markets. The growing popularity of marine-based dietary supplements is boosting retail sales, further accelerating capacity expansion.
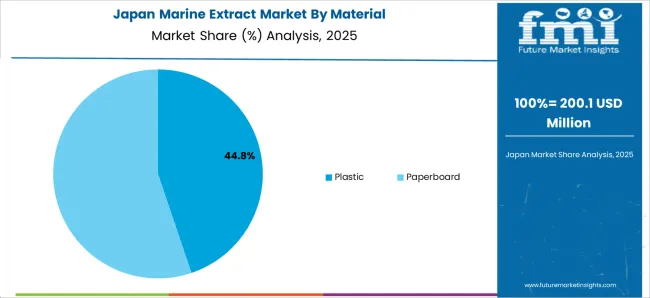
Revenue from marine extract in Japan is experiencing steady growth, projected to expand at a CAGR of 7.1% from 2025 to 2035. This growth is driven by increasing demand for functional foods, nutraceuticals, and cosmetic products enriched with marine-derived ingredients. Rising consumer awareness of health benefits, particularly omega-3 fatty acids and collagen, is fueling consumption. The country’s advanced processing capabilities and strict quality standards make it a key exporter of premium marine extracts in Asia.
Furthermore, Japan’s aging population is boosting demand for products targeting joint health, heart health, and overall wellness. The government’s emphasis on eco-friendly fishing practices also supports market expansion. Strategic partnerships between domestic producers and global nutraceutical brands are expected to enhance product innovation. Overall, Japan remains a stable and mature market with strong growth potential in high-value marine extract applications.
Demand for marine extracts in China is set to grow at a CAGR of 6.8% from 2025 to 2035, fueled by rapid industrialization of aquaculture and increasing investment in marine biotechnology. The country’s large consumer base, rising disposable incomes, and growing interest in health supplements are driving demand. Marine collagen, omega-3, and other marine-derived ingredients are gaining popularity in China’s booming cosmetic and functional food sectors.
Government initiatives to promote marine economy development, along with favorable policies for eco-friendly fishing, are further supporting market growth. Domestic companies are expanding processing capacity and adopting advanced extraction technologies to meet both domestic and export demand. The e-commerce boom in China is also creating new channels for marine extract product distribution.
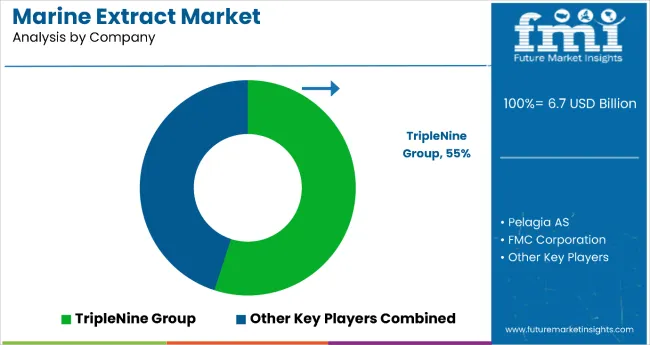
The market is moderately consolidated, with a mix of large-scale producers, specialized nutraceutical ingredient suppliers, and regionally dominant firms leveraging unique access to marine resources. TripleNine Group leads with a commanding 55% share, benefiting from vertically integrated operations, advanced processing technologies, and established supply chains for fishmeal, omega-3s, and other marine-derived ingredients.
Pelagia AS and FMC Corporation focus on value-added marine extracts such as functional lipids, bioactive peptides, and algal-derived ingredients, catering to high-growth sectors like dietary supplements, cosmetics, and pharmaceuticals. Their strengths lie in innovation pipelines, R&D collaborations, and sustainability certifications that appeal to premium markets.
Regional expansion is driven by companies with deep expertise in local sourcing and tailored formulations for domestic nutraceutical and functional food industries, particularly in high-growth markets such as India and the USA Entry barriers remain significant due to the need for eco-friendly harvesting practices, advanced extraction technologies, and compliance with diverse global food and pharmaceutical regulations.
| Item | Value |
|---|---|
| Quantitative Units | USD 6.7 Billion |
| Material | Plastic, (Polyethylene, Polycarbonate, Polyethylene Terephthalate, Polypropylene, Other Plastics), and Paperboard |
| Capacity | Storing Up to 50 Tubes, Storing 51 to 100 Tubes, Storing 100 to 150 Tubes, Storing Above 150 Tubes |
| Regions Covered | North America, Europe, Asia-Pacific, Latin America, Middle East & Africa |
| Country Covered | United States, Canada, United Kingdom, Germany, France, China, Japan, South Korea, Brazil, Australia and 40+ countries |
| Key Companies Profiled | VWR International, LLC, Cole-Parmer Instrument Company, LLC, Isolab Laborgerate GmbH, Bioline Technologies, MTM Molded Products Company, Axil Scientific Pte Ltd, Tarsons, Biotechnology Co., Ltd., Heathrow Scientific, ZHEJIANG RUNLAB TECHNOLOGY CO., LTD |
| Additional Attributes | Dollar sales by material and capacity segment; increasing use in functional foods, nutraceuticals, pharmaceuticals, and cosmetics; rising demand for marine-based ingredients due to sustainability and clean-label trends; advances in extraction and purification technologies improving bioavailability, purity, and compliance with global regulatory standards |
The global marine extract market is estimated to be valued at USD 6.7 billion in 2025.
The market size for the marine extract market is projected to reach USD 11.0 billion by 2035.
The marine extract market is expected to grow at a 5.0% CAGR between 2025 and 2035.
The key product types in marine extract market are plastic, _polyethylene, _polycarbonate, _polyethylene terephthalate, _polypropylene, _other plastics and paperboard.
In terms of capacity, storing 51 to 100 tubes segment to command 36.4% share in the marine extract market in 2025.


Our Research Products

The "Full Research Suite" delivers actionable market intel, deep dives on markets or technologies, so clients act faster, cut risk, and unlock growth.

The Leaderboard benchmarks and ranks top vendors, classifying them as Established Leaders, Leading Challengers, or Disruptors & Challengers.

Locates where complements amplify value and substitutes erode it, forecasting net impact by horizon

We deliver granular, decision-grade intel: market sizing, 5-year forecasts, pricing, adoption, usage, revenue, and operational KPIs—plus competitor tracking, regulation, and value chains—across 60 countries broadly.

Spot the shifts before they hit your P&L. We track inflection points, adoption curves, pricing moves, and ecosystem plays to show where demand is heading, why it is changing, and what to do next across high-growth markets and disruptive tech

Real-time reads of user behavior. We track shifting priorities, perceptions of today’s and next-gen services, and provider experience, then pace how fast tech moves from trial to adoption, blending buyer, consumer, and channel inputs with social signals (#WhySwitch, #UX).

Partner with our analyst team to build a custom report designed around your business priorities. From analysing market trends to assessing competitors or crafting bespoke datasets, we tailor insights to your needs.
Supplier Intelligence
Discovery & Profiling
Capacity & Footprint
Performance & Risk
Compliance & Governance
Commercial Readiness
Who Supplies Whom
Scorecards & Shortlists
Playbooks & Docs
Category Intelligence
Definition & Scope
Demand & Use Cases
Cost Drivers
Market Structure
Supply Chain Map
Trade & Policy
Operating Norms
Deliverables
Buyer Intelligence
Account Basics
Spend & Scope
Procurement Model
Vendor Requirements
Terms & Policies
Entry Strategy
Pain Points & Triggers
Outputs
Pricing Analysis
Benchmarks
Trends
Should-Cost
Indexation
Landed Cost
Commercial Terms
Deliverables
Brand Analysis
Positioning & Value Prop
Share & Presence
Customer Evidence
Go-to-Market
Digital & Reputation
Compliance & Trust
KPIs & Gaps
Outputs
Full Research Suite comprises of:
Market outlook & trends analysis
Interviews & case studies
Strategic recommendations
Vendor profiles & capabilities analysis
5-year forecasts
8 regions and 60+ country-level data splits
Market segment data splits
12 months of continuous data updates
DELIVERED AS:
PDF EXCEL ONLINE
Marine Plankton Extracts Market Analysis - Size and Share Forecast Outlook 2025 to 2035
Natural Rosemarine Extract Market Analysis by Food & Beverage, Pharmaceuticals, Nutraceuticals and Others Through 2035
Marine Nanocoating Market Size and Share Forecast Outlook 2025 to 2035
Marine-grade Polyurethane Market Size and Share Forecast Outlook 2025 to 2035
Marine Electronics Market Size and Share Forecast Outlook 2025 to 2035
Marine Toxin Market Size and Share Forecast and Outlook 2025 to 2035
Marine Thermal Fluid Heaters Market Size and Share Forecast Outlook 2025 to 2035
Marine Nutraceutical Market Size and Share Forecast Outlook 2025 to 2035
Marine Power Battery System Market Size and Share Forecast Outlook 2025 to 2035
Marine Life Raft Market Size and Share Forecast Outlook 2025 to 2035
Marine Trenchers Market Size and Share Forecast Outlook 2025 to 2035
Marine Electronics Tester Market Size and Share Forecast Outlook 2025 to 2035
Marine Steering Systems Market Size and Share Forecast Outlook 2025 to 2035
Marine & Dock Gangways Market Size and Share Forecast Outlook 2025 to 2035
Marine HVAC System Market Size and Share Forecast Outlook 2025 to 2035
Marine Outboard Engines Market Size and Share Forecast Outlook 2025 to 2035
Marine Stabilizers Market Size and Share Forecast Outlook 2025 to 2035
Marine Fuel Injection System Market Size and Share Forecast Outlook 2025 to 2035
Marine Energy Market Size and Share Forecast Outlook 2025 to 2035
Marine Propulsion Engine Market Size and Share Forecast Outlook 2025 to 2035

Thank you!
You will receive an email from our Business Development Manager. Please be sure to check your SPAM/JUNK folder too.
Chat With
MaRIA