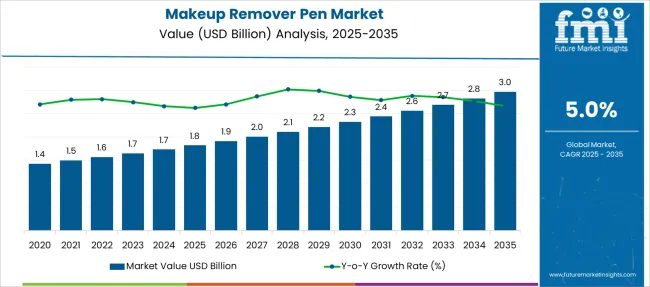
The makeup remover pen market is likely to register a CAGR of 5% during the forecast period and is anticipated to reach a market share of USD 2.57 Billion in 2032, from USD 1.5 Billion in 2021, due to shifting towards organic and natural products.
Attributes | Details |
---|---|
Makeup Remover Pen Market CAGR | 5% |
Makeup Remover Pen Market Size (2021) | USD 1.5 Billion |
Makeup Remover Pen Market Size (2032) | USD 2.57 Billion |
When compared to other makeup remover solutions on the market, demand for makeup remover pens is high due to their user-friendly packaging. Although there are makeup remover liquids on the market, the makeup removal pen is designed to be used as a corrector rather than to remove all of the makeup.
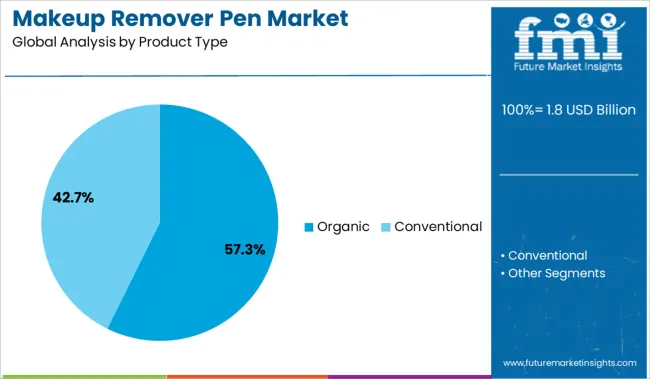
As people are gravitating toward organic and natural products, a few companies are introducing new products with features like the ability to remove waterproof makeup, while also nourishing the face with chamomile flower extract and Vitamin E, promoting the sales of makeup remover pens.
Due to its ease of use and organic and natural components utilized in the product, the makeup remover pen market share is increasing, when compared to other makeup remover liquids and products on the market.
In-depth analysis of parent market trends, macroeconomic data, governing variables, market potential, and demand for makeup remover pen attractiveness by segment are all covered in this report. The study also maps the qualitative impact of major market factors on market segments and geographies, as well as their corresponding effects on sales of makeup remover pens.
Most cosmetic firms are turning to pen-shaped applicators and solid stick formats to offer mess-free on-the-go solutions to help consumers rapidly perfect their look, therefore the demand for makeup remover pens is expected to rise.
As it is easier to apply eyeliner, lip color, and other beauty products with a pen-shaped applicator than with other formats, it is becoming increasingly popular, enhancing the sales of makeup remover pens.
Demand for makeup removal pens is high as a result of their unique ability to easily fix smudged eyeliner or lipstick. Other makeup remover solutions, on the other hand, are primarily used to remove rather than repair makeup, as they are intended to be used with makeup remover pads, which is why makeup removal pens are more efficient. As a result, sales of makeup remover pens have increased over the past few years.
One of the driving factors in the natural and organic makeup remover pen market is the trend for organic and natural products. Furthermore, people are gravitating toward things that can be used quickly and effortlessly, promoting the sales of makeup remover pens.
The personal grooming and cosmetics market in the Asia-Pacific area is expanding. Consumers in the region, notably men, are willing to try new products, which is driving up demand for makeup remover pens in the market.
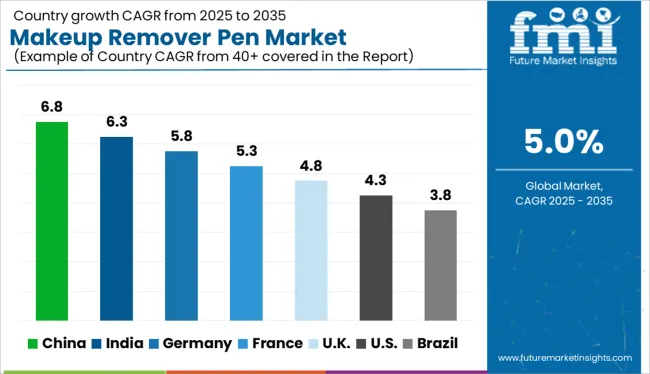
During the projected period, the makeup remover pen market is expected to develop at a healthy rate across all geographies. The sales of makeup remover pens are expected to increase as beauty and personal care products become more popular around the world.
Due to the lucrative growth in the beauty care product business, rising nations are likely to produce significant demand for makeup remover pens. The makeup remover pen market share is predicted to expand at a relatively high rate due to the increasing population and adoption of innovative products among young in South Asia and East Asia as a whole.
The growing markets of China and India are likely to have a favorable impact on the global economy. Furthermore, the Middle East and Africa are expected to grow in terms of demand for makeup remover pens, owing to an increase in the availability of significant brands and an increase in per capita spending.
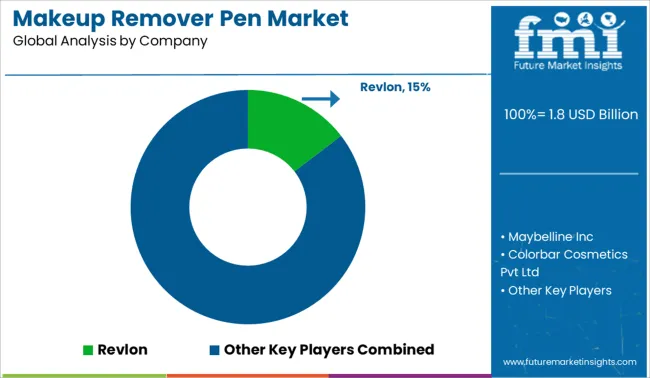
Revlon, Maybelline Inc, Colorbar cosmetics pvt ltd, and Lashfood Group are among the leading participants in the makeup removal pen market, holding a substantial makeup remover pen market share.
The report covers the business landscape, head-to-head competition, marketing and promotional experience, product range, price strategy, and distribution overview, industries, detailed projections, demand for makeup remover pens, total market sales of makeup remover pens, micro- and macroeconomic factors, as well as market valuation interpretations that are likely to influence Global Makeup Remover Pen Market trends.
Report Attribute | Details |
---|---|
Growth rate | CAGR of 5% from 2022 to 2032 |
The base year for estimation | 2021 |
Historical data | 2015 to 2020 |
Forecast period | 2022 to 2032 |
Quantitative units | Revenue in USD billion, volume in kilotons, and CAGR from 2022 to 2032 |
Report Coverage | Revenue forecast, volume forecast, company ranking, competitive landscape, growth factors, and trends, Pricing Analysis |
Segments Covered | Nature, end use, sales channel, region |
Regional scope | North America; Western Europe; Eastern Europe; Middle East; Africa; ASEAN; South Asia; Rest of Asia; Australia; and New Zealand |
Country scope | USA, Canada, Mexico, Germany, United Kingdom, France, Italy, Spain, Russia, Belgium, Poland, Czech Republic, China, India, Japan, Australia, Brazil, Argentina, Colombia, Saudi Arabia, United Arab Emirates(UAE), Iran, South Africa |
Key companies profiled | Revlon; Maybelline Inc; Colorbar cosmetics pvt ltd; and Lashfood Group |
Customization scope | Free report customization (equivalent to up to 8 analysts' working days) with purchase. Addition or alteration to country, regional & segment scope. |
Pricing and purchase options | Avail customized purchase options to meet your exact research needs. |
Table 1: Global Market Value (US$ Million) Forecast by Region, 2017 to 2032
Table 2: Global Market Volume (Units) Forecast by Region, 2017 to 2032
Table 3: Global Market Value (US$ Million) Forecast by Product Type, 2017 to 2032
Table 4: Global Market Volume (Units) Forecast by Product Type, 2017 to 2032
Table 5: Global Market Value (US$ Million) Forecast by End Use, 2017 to 2032
Table 6: Global Market Volume (Units) Forecast by End Use, 2017 to 2032
Table 7: Global Market Value (US$ Million) Forecast by Sales Channels, 2017 to 2032
Table 8: Global Market Volume (Units) Forecast by Sales Channels, 2017 to 2032
Table 9: North America Market Value (US$ Million) Forecast by Country, 2017 to 2032
Table 10: North America Market Volume (Units) Forecast by Country, 2017 to 2032
Table 11: North America Market Value (US$ Million) Forecast by Product Type, 2017 to 2032
Table 12: North America Market Volume (Units) Forecast by Product Type, 2017 to 2032
Table 13: North America Market Value (US$ Million) Forecast by End Use, 2017 to 2032
Table 14: North America Market Volume (Units) Forecast by End Use, 2017 to 2032
Table 15: North America Market Value (US$ Million) Forecast by Sales Channels, 2017 to 2032
Table 16: North America Market Volume (Units) Forecast by Sales Channels, 2017 to 2032
Table 17: Latin America Market Value (US$ Million) Forecast by Country, 2017 to 2032
Table 18: Latin America Market Volume (Units) Forecast by Country, 2017 to 2032
Table 19: Latin America Market Value (US$ Million) Forecast by Product Type, 2017 to 2032
Table 20: Latin America Market Volume (Units) Forecast by Product Type, 2017 to 2032
Table 21: Latin America Market Value (US$ Million) Forecast by End Use, 2017 to 2032
Table 22: Latin America Market Volume (Units) Forecast by End Use, 2017 to 2032
Table 23: Latin America Market Value (US$ Million) Forecast by Sales Channels, 2017 to 2032
Table 24: Latin America Market Volume (Units) Forecast by Sales Channels, 2017 to 2032
Table 25: Europe Market Value (US$ Million) Forecast by Country, 2017 to 2032
Table 26: Europe Market Volume (Units) Forecast by Country, 2017 to 2032
Table 27: Europe Market Value (US$ Million) Forecast by Product Type, 2017 to 2032
Table 28: Europe Market Volume (Units) Forecast by Product Type, 2017 to 2032
Table 29: Europe Market Value (US$ Million) Forecast by End Use, 2017 to 2032
Table 30: Europe Market Volume (Units) Forecast by End Use, 2017 to 2032
Table 31: Europe Market Value (US$ Million) Forecast by Sales Channels, 2017 to 2032
Table 32: Europe Market Volume (Units) Forecast by Sales Channels, 2017 to 2032
Table 33: East Asia Market Value (US$ Million) Forecast by Country, 2017 to 2032
Table 34: East Asia Market Volume (Units) Forecast by Country, 2017 to 2032
Table 35: East Asia Market Value (US$ Million) Forecast by Product Type, 2017 to 2032
Table 36: East Asia Market Volume (Units) Forecast by Product Type, 2017 to 2032
Table 37: East Asia Market Value (US$ Million) Forecast by End Use, 2017 to 2032
Table 38: East Asia Market Volume (Units) Forecast by End Use, 2017 to 2032
Table 39: East Asia Market Value (US$ Million) Forecast by Sales Channels, 2017 to 2032
Table 40: East Asia Market Volume (Units) Forecast by Sales Channels, 2017 to 2032
Table 41: South Asia Market Value (US$ Million) Forecast by Country, 2017 to 2032
Table 42: South Asia Market Volume (Units) Forecast by Country, 2017 to 2032
Table 43: South Asia Market Value (US$ Million) Forecast by Product Type, 2017 to 2032
Table 44: South Asia Market Volume (Units) Forecast by Product Type, 2017 to 2032
Table 45: South Asia Market Value (US$ Million) Forecast by End Use, 2017 to 2032
Table 46: South Asia Market Volume (Units) Forecast by End Use, 2017 to 2032
Table 47: South Asia Market Value (US$ Million) Forecast by Sales Channels, 2017 to 2032
Table 48: South Asia Market Volume (Units) Forecast by Sales Channels, 2017 to 2032
Table 49: Oceania Market Value (US$ Million) Forecast by Country, 2017 to 2032
Table 50: Oceania Market Volume (Units) Forecast by Country, 2017 to 2032
Table 51: Oceania Market Value (US$ Million) Forecast by Product Type, 2017 to 2032
Table 52: Oceania Market Volume (Units) Forecast by Product Type, 2017 to 2032
Table 53: Oceania Market Value (US$ Million) Forecast by End Use, 2017 to 2032
Table 54: Oceania Market Volume (Units) Forecast by End Use, 2017 to 2032
Table 55: Oceania Market Value (US$ Million) Forecast by Sales Channels, 2017 to 2032
Table 56: Oceania Market Volume (Units) Forecast by Sales Channels, 2017 to 2032
Table 57: MEA Market Value (US$ Million) Forecast by Country, 2017 to 2032
Table 58: MEA Market Volume (Units) Forecast by Country, 2017 to 2032
Table 59: MEA Market Value (US$ Million) Forecast by Product Type, 2017 to 2032
Table 60: MEA Market Volume (Units) Forecast by Product Type, 2017 to 2032
Table 61: MEA Market Value (US$ Million) Forecast by End Use, 2017 to 2032
Table 62: MEA Market Volume (Units) Forecast by End Use, 2017 to 2032
Table 63: MEA Market Value (US$ Million) Forecast by Sales Channels, 2017 to 2032
Table 64: MEA Market Volume (Units) Forecast by Sales Channels, 2017 to 2032
Figure 1: Global Market Value (US$ Million) by Product Type, 2022 to 2032
Figure 2: Global Market Value (US$ Million) by End Use, 2022 to 2032
Figure 3: Global Market Value (US$ Million) by Sales Channels, 2022 to 2032
Figure 4: Global Market Value (US$ Million) by Region, 2022 to 2032
Figure 5: Global Market Value (US$ Million) Analysis by Region, 2017 to 2032
Figure 6: Global Market Volume (Units) Analysis by Region, 2017 to 2032
Figure 7: Global Market Value Share (%) and BPS Analysis by Region, 2022 to 2032
Figure 8: Global Market Y-o-Y Growth (%) Projections by Region, 2022 to 2032
Figure 9: Global Market Value (US$ Million) Analysis by Product Type, 2017 to 2032
Figure 10: Global Market Volume (Units) Analysis by Product Type, 2017 to 2032
Figure 11: Global Market Value Share (%) and BPS Analysis by Product Type, 2022 to 2032
Figure 12: Global Market Y-o-Y Growth (%) Projections by Product Type, 2022 to 2032
Figure 13: Global Market Value (US$ Million) Analysis by End Use, 2017 to 2032
Figure 14: Global Market Volume (Units) Analysis by End Use, 2017 to 2032
Figure 15: Global Market Value Share (%) and BPS Analysis by End Use, 2022 to 2032
Figure 16: Global Market Y-o-Y Growth (%) Projections by End Use, 2022 to 2032
Figure 17: Global Market Value (US$ Million) Analysis by Sales Channels, 2017 to 2032
Figure 18: Global Market Volume (Units) Analysis by Sales Channels, 2017 to 2032
Figure 19: Global Market Value Share (%) and BPS Analysis by Sales Channels, 2022 to 2032
Figure 20: Global Market Y-o-Y Growth (%) Projections by Sales Channels, 2022 to 2032
Figure 21: Global Market Attractiveness by Product Type, 2022 to 2032
Figure 22: Global Market Attractiveness by End Use, 2022 to 2032
Figure 23: Global Market Attractiveness by Sales Channels, 2022 to 2032
Figure 24: Global Market Attractiveness by Region, 2022 to 2032
Figure 25: North America Market Value (US$ Million) by Product Type, 2022 to 2032
Figure 26: North America Market Value (US$ Million) by End Use, 2022 to 2032
Figure 27: North America Market Value (US$ Million) by Sales Channels, 2022 to 2032
Figure 28: North America Market Value (US$ Million) by Country, 2022 to 2032
Figure 29: North America Market Value (US$ Million) Analysis by Country, 2017 to 2032
Figure 30: North America Market Volume (Units) Analysis by Country, 2017 to 2032
Figure 31: North America Market Value Share (%) and BPS Analysis by Country, 2022 to 2032
Figure 32: North America Market Y-o-Y Growth (%) Projections by Country, 2022 to 2032
Figure 33: North America Market Value (US$ Million) Analysis by Product Type, 2017 to 2032
Figure 34: North America Market Volume (Units) Analysis by Product Type, 2017 to 2032
Figure 35: North America Market Value Share (%) and BPS Analysis by Product Type, 2022 to 2032
Figure 36: North America Market Y-o-Y Growth (%) Projections by Product Type, 2022 to 2032
Figure 37: North America Market Value (US$ Million) Analysis by End Use, 2017 to 2032
Figure 38: North America Market Volume (Units) Analysis by End Use, 2017 to 2032
Figure 39: North America Market Value Share (%) and BPS Analysis by End Use, 2022 to 2032
Figure 40: North America Market Y-o-Y Growth (%) Projections by End Use, 2022 to 2032
Figure 41: North America Market Value (US$ Million) Analysis by Sales Channels, 2017 to 2032
Figure 42: North America Market Volume (Units) Analysis by Sales Channels, 2017 to 2032
Figure 43: North America Market Value Share (%) and BPS Analysis by Sales Channels, 2022 to 2032
Figure 44: North America Market Y-o-Y Growth (%) Projections by Sales Channels, 2022 to 2032
Figure 45: North America Market Attractiveness by Product Type, 2022 to 2032
Figure 46: North America Market Attractiveness by End Use, 2022 to 2032
Figure 47: North America Market Attractiveness by Sales Channels, 2022 to 2032
Figure 48: North America Market Attractiveness by Country, 2022 to 2032
Figure 49: Latin America Market Value (US$ Million) by Product Type, 2022 to 2032
Figure 50: Latin America Market Value (US$ Million) by End Use, 2022 to 2032
Figure 51: Latin America Market Value (US$ Million) by Sales Channels, 2022 to 2032
Figure 52: Latin America Market Value (US$ Million) by Country, 2022 to 2032
Figure 53: Latin America Market Value (US$ Million) Analysis by Country, 2017 to 2032
Figure 54: Latin America Market Volume (Units) Analysis by Country, 2017 to 2032
Figure 55: Latin America Market Value Share (%) and BPS Analysis by Country, 2022 to 2032
Figure 56: Latin America Market Y-o-Y Growth (%) Projections by Country, 2022 to 2032
Figure 57: Latin America Market Value (US$ Million) Analysis by Product Type, 2017 to 2032
Figure 58: Latin America Market Volume (Units) Analysis by Product Type, 2017 to 2032
Figure 59: Latin America Market Value Share (%) and BPS Analysis by Product Type, 2022 to 2032
Figure 60: Latin America Market Y-o-Y Growth (%) Projections by Product Type, 2022 to 2032
Figure 61: Latin America Market Value (US$ Million) Analysis by End Use, 2017 to 2032
Figure 62: Latin America Market Volume (Units) Analysis by End Use, 2017 to 2032
Figure 63: Latin America Market Value Share (%) and BPS Analysis by End Use, 2022 to 2032
Figure 64: Latin America Market Y-o-Y Growth (%) Projections by End Use, 2022 to 2032
Figure 65: Latin America Market Value (US$ Million) Analysis by Sales Channels, 2017 to 2032
Figure 66: Latin America Market Volume (Units) Analysis by Sales Channels, 2017 to 2032
Figure 67: Latin America Market Value Share (%) and BPS Analysis by Sales Channels, 2022 to 2032
Figure 68: Latin America Market Y-o-Y Growth (%) Projections by Sales Channels, 2022 to 2032
Figure 69: Latin America Market Attractiveness by Product Type, 2022 to 2032
Figure 70: Latin America Market Attractiveness by End Use, 2022 to 2032
Figure 71: Latin America Market Attractiveness by Sales Channels, 2022 to 2032
Figure 72: Latin America Market Attractiveness by Country, 2022 to 2032
Figure 73: Europe Market Value (US$ Million) by Product Type, 2022 to 2032
Figure 74: Europe Market Value (US$ Million) by End Use, 2022 to 2032
Figure 75: Europe Market Value (US$ Million) by Sales Channels, 2022 to 2032
Figure 76: Europe Market Value (US$ Million) by Country, 2022 to 2032
Figure 77: Europe Market Value (US$ Million) Analysis by Country, 2017 to 2032
Figure 78: Europe Market Volume (Units) Analysis by Country, 2017 to 2032
Figure 79: Europe Market Value Share (%) and BPS Analysis by Country, 2022 to 2032
Figure 80: Europe Market Y-o-Y Growth (%) Projections by Country, 2022 to 2032
Figure 81: Europe Market Value (US$ Million) Analysis by Product Type, 2017 to 2032
Figure 82: Europe Market Volume (Units) Analysis by Product Type, 2017 to 2032
Figure 83: Europe Market Value Share (%) and BPS Analysis by Product Type, 2022 to 2032
Figure 84: Europe Market Y-o-Y Growth (%) Projections by Product Type, 2022 to 2032
Figure 85: Europe Market Value (US$ Million) Analysis by End Use, 2017 to 2032
Figure 86: Europe Market Volume (Units) Analysis by End Use, 2017 to 2032
Figure 87: Europe Market Value Share (%) and BPS Analysis by End Use, 2022 to 2032
Figure 88: Europe Market Y-o-Y Growth (%) Projections by End Use, 2022 to 2032
Figure 89: Europe Market Value (US$ Million) Analysis by Sales Channels, 2017 to 2032
Figure 90: Europe Market Volume (Units) Analysis by Sales Channels, 2017 to 2032
Figure 91: Europe Market Value Share (%) and BPS Analysis by Sales Channels, 2022 to 2032
Figure 92: Europe Market Y-o-Y Growth (%) Projections by Sales Channels, 2022 to 2032
Figure 93: Europe Market Attractiveness by Product Type, 2022 to 2032
Figure 94: Europe Market Attractiveness by End Use, 2022 to 2032
Figure 95: Europe Market Attractiveness by Sales Channels, 2022 to 2032
Figure 96: Europe Market Attractiveness by Country, 2022 to 2032
Figure 97: East Asia Market Value (US$ Million) by Product Type, 2022 to 2032
Figure 98: East Asia Market Value (US$ Million) by End Use, 2022 to 2032
Figure 99: East Asia Market Value (US$ Million) by Sales Channels, 2022 to 2032
Figure 100: East Asia Market Value (US$ Million) by Country, 2022 to 2032
Figure 101: East Asia Market Value (US$ Million) Analysis by Country, 2017 to 2032
Figure 102: East Asia Market Volume (Units) Analysis by Country, 2017 to 2032
Figure 103: East Asia Market Value Share (%) and BPS Analysis by Country, 2022 to 2032
Figure 104: East Asia Market Y-o-Y Growth (%) Projections by Country, 2022 to 2032
Figure 105: East Asia Market Value (US$ Million) Analysis by Product Type, 2017 to 2032
Figure 106: East Asia Market Volume (Units) Analysis by Product Type, 2017 to 2032
Figure 107: East Asia Market Value Share (%) and BPS Analysis by Product Type, 2022 to 2032
Figure 108: East Asia Market Y-o-Y Growth (%) Projections by Product Type, 2022 to 2032
Figure 109: East Asia Market Value (US$ Million) Analysis by End Use, 2017 to 2032
Figure 110: East Asia Market Volume (Units) Analysis by End Use, 2017 to 2032
Figure 111: East Asia Market Value Share (%) and BPS Analysis by End Use, 2022 to 2032
Figure 112: East Asia Market Y-o-Y Growth (%) Projections by End Use, 2022 to 2032
Figure 113: East Asia Market Value (US$ Million) Analysis by Sales Channels, 2017 to 2032
Figure 114: East Asia Market Volume (Units) Analysis by Sales Channels, 2017 to 2032
Figure 115: East Asia Market Value Share (%) and BPS Analysis by Sales Channels, 2022 to 2032
Figure 116: East Asia Market Y-o-Y Growth (%) Projections by Sales Channels, 2022 to 2032
Figure 117: East Asia Market Attractiveness by Product Type, 2022 to 2032
Figure 118: East Asia Market Attractiveness by End Use, 2022 to 2032
Figure 119: East Asia Market Attractiveness by Sales Channels, 2022 to 2032
Figure 120: East Asia Market Attractiveness by Country, 2022 to 2032
Figure 121: South Asia Market Value (US$ Million) by Product Type, 2022 to 2032
Figure 122: South Asia Market Value (US$ Million) by End Use, 2022 to 2032
Figure 123: South Asia Market Value (US$ Million) by Sales Channels, 2022 to 2032
Figure 124: South Asia Market Value (US$ Million) by Country, 2022 to 2032
Figure 125: South Asia Market Value (US$ Million) Analysis by Country, 2017 to 2032
Figure 126: South Asia Market Volume (Units) Analysis by Country, 2017 to 2032
Figure 127: South Asia Market Value Share (%) and BPS Analysis by Country, 2022 to 2032
Figure 128: South Asia Market Y-o-Y Growth (%) Projections by Country, 2022 to 2032
Figure 129: South Asia Market Value (US$ Million) Analysis by Product Type, 2017 to 2032
Figure 130: South Asia Market Volume (Units) Analysis by Product Type, 2017 to 2032
Figure 131: South Asia Market Value Share (%) and BPS Analysis by Product Type, 2022 to 2032
Figure 132: South Asia Market Y-o-Y Growth (%) Projections by Product Type, 2022 to 2032
Figure 133: South Asia Market Value (US$ Million) Analysis by End Use, 2017 to 2032
Figure 134: South Asia Market Volume (Units) Analysis by End Use, 2017 to 2032
Figure 135: South Asia Market Value Share (%) and BPS Analysis by End Use, 2022 to 2032
Figure 136: South Asia Market Y-o-Y Growth (%) Projections by End Use, 2022 to 2032
Figure 137: South Asia Market Value (US$ Million) Analysis by Sales Channels, 2017 to 2032
Figure 138: South Asia Market Volume (Units) Analysis by Sales Channels, 2017 to 2032
Figure 139: South Asia Market Value Share (%) and BPS Analysis by Sales Channels, 2022 to 2032
Figure 140: South Asia Market Y-o-Y Growth (%) Projections by Sales Channels, 2022 to 2032
Figure 141: South Asia Market Attractiveness by Product Type, 2022 to 2032
Figure 142: South Asia Market Attractiveness by End Use, 2022 to 2032
Figure 143: South Asia Market Attractiveness by Sales Channels, 2022 to 2032
Figure 144: South Asia Market Attractiveness by Country, 2022 to 2032
Figure 145: Oceania Market Value (US$ Million) by Product Type, 2022 to 2032
Figure 146: Oceania Market Value (US$ Million) by End Use, 2022 to 2032
Figure 147: Oceania Market Value (US$ Million) by Sales Channels, 2022 to 2032
Figure 148: Oceania Market Value (US$ Million) by Country, 2022 to 2032
Figure 149: Oceania Market Value (US$ Million) Analysis by Country, 2017 to 2032
Figure 150: Oceania Market Volume (Units) Analysis by Country, 2017 to 2032
Figure 151: Oceania Market Value Share (%) and BPS Analysis by Country, 2022 to 2032
Figure 152: Oceania Market Y-o-Y Growth (%) Projections by Country, 2022 to 2032
Figure 153: Oceania Market Value (US$ Million) Analysis by Product Type, 2017 to 2032
Figure 154: Oceania Market Volume (Units) Analysis by Product Type, 2017 to 2032
Figure 155: Oceania Market Value Share (%) and BPS Analysis by Product Type, 2022 to 2032
Figure 156: Oceania Market Y-o-Y Growth (%) Projections by Product Type, 2022 to 2032
Figure 157: Oceania Market Value (US$ Million) Analysis by End Use, 2017 to 2032
Figure 158: Oceania Market Volume (Units) Analysis by End Use, 2017 to 2032
Figure 159: Oceania Market Value Share (%) and BPS Analysis by End Use, 2022 to 2032
Figure 160: Oceania Market Y-o-Y Growth (%) Projections by End Use, 2022 to 2032
Figure 161: Oceania Market Value (US$ Million) Analysis by Sales Channels, 2017 to 2032
Figure 162: Oceania Market Volume (Units) Analysis by Sales Channels, 2017 to 2032
Figure 163: Oceania Market Value Share (%) and BPS Analysis by Sales Channels, 2022 to 2032
Figure 164: Oceania Market Y-o-Y Growth (%) Projections by Sales Channels, 2022 to 2032
Figure 165: Oceania Market Attractiveness by Product Type, 2022 to 2032
Figure 166: Oceania Market Attractiveness by End Use, 2022 to 2032
Figure 167: Oceania Market Attractiveness by Sales Channels, 2022 to 2032
Figure 168: Oceania Market Attractiveness by Country, 2022 to 2032
Figure 169: MEA Market Value (US$ Million) by Product Type, 2022 to 2032
Figure 170: MEA Market Value (US$ Million) by End Use, 2022 to 2032
Figure 171: MEA Market Value (US$ Million) by Sales Channels, 2022 to 2032
Figure 172: MEA Market Value (US$ Million) by Country, 2022 to 2032
Figure 173: MEA Market Value (US$ Million) Analysis by Country, 2017 to 2032
Figure 174: MEA Market Volume (Units) Analysis by Country, 2017 to 2032
Figure 175: MEA Market Value Share (%) and BPS Analysis by Country, 2022 to 2032
Figure 176: MEA Market Y-o-Y Growth (%) Projections by Country, 2022 to 2032
Figure 177: MEA Market Value (US$ Million) Analysis by Product Type, 2017 to 2032
Figure 178: MEA Market Volume (Units) Analysis by Product Type, 2017 to 2032
Figure 179: MEA Market Value Share (%) and BPS Analysis by Product Type, 2022 to 2032
Figure 180: MEA Market Y-o-Y Growth (%) Projections by Product Type, 2022 to 2032
Figure 181: MEA Market Value (US$ Million) Analysis by End Use, 2017 to 2032
Figure 182: MEA Market Volume (Units) Analysis by End Use, 2017 to 2032
Figure 183: MEA Market Value Share (%) and BPS Analysis by End Use, 2022 to 2032
Figure 184: MEA Market Y-o-Y Growth (%) Projections by End Use, 2022 to 2032
Figure 185: MEA Market Value (US$ Million) Analysis by Sales Channels, 2017 to 2032
Figure 186: MEA Market Volume (Units) Analysis by Sales Channels, 2017 to 2032
Figure 187: MEA Market Value Share (%) and BPS Analysis by Sales Channels, 2022 to 2032
Figure 188: MEA Market Y-o-Y Growth (%) Projections by Sales Channels, 2022 to 2032
Figure 189: MEA Market Attractiveness by Product Type, 2022 to 2032
Figure 190: MEA Market Attractiveness by End Use, 2022 to 2032
Figure 191: MEA Market Attractiveness by Sales Channels, 2022 to 2032
Figure 192: MEA Market Attractiveness by Country, 2022 to 2032
The makeup removal pen market is anticipated to register a CAGR of 5% during the forecast period.
The makeup removal pen market share is anticipated to reach USD 2.57 Billion in 2032.
Demand for makeup removal pens is likely to rise, due to shifts towards organic and natural products.
Explore Similar Insights
Thank you!
You will receive an email from our Business Development Manager. Please be sure to check your SPAM/JUNK folder too.