The Magnetic Sensor Market is estimated to be valued at USD 2.6 billion in 2025 and is projected to reach USD 4.2 billion by 2035, registering a compound annual growth rate (CAGR) of 4.9% over the forecast period.
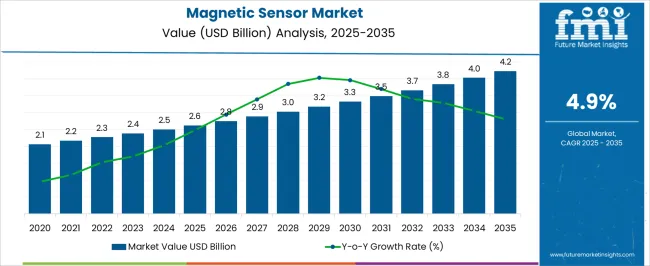
| Metric | Value |
|---|---|
| Magnetic Sensor Market Estimated Value in (2025 E) | USD 2.6 billion |
| Magnetic Sensor Market Forecast Value in (2035 F) | USD 4.2 billion |
| Forecast CAGR (2025 to 2035) | 4.9% |
The magnetic sensor market is witnessing steady growth as advancements in sensing technology and miniaturization drive broader adoption across healthcare, automotive, and consumer electronics industries. In the medical field, magnetic sensor kits are increasingly used for diagnostic applications due to their accuracy, non invasive nature, and compatibility with portable testing platforms.
Rising prevalence of infectious diseases and the demand for rapid detection methods are encouraging hospitals and diagnostic centers to integrate sensor based kits into routine workflows. The development of smart, connected devices with real time monitoring capabilities is further accelerating market uptake.
Regulatory encouragement for innovative diagnostic technologies and increased healthcare spending are supporting continuous product adoption. The market outlook remains positive as demand for precision, speed, and reliability in diagnostic and industrial applications continues to rise.
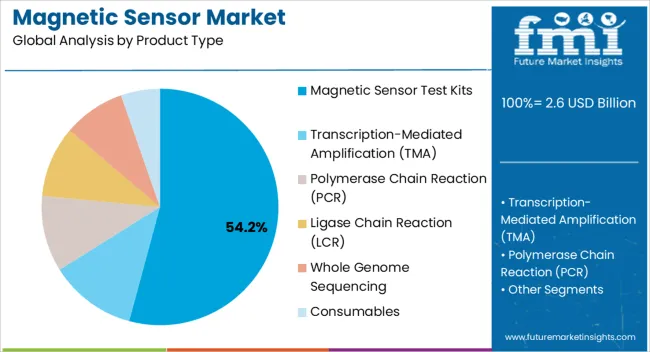
The magnetic sensor test kits segment is projected to account for 54.20% of the market revenue by 2025 within the product type category, establishing its dominance. This growth is driven by the rising adoption of point of care testing solutions that leverage magnetic sensors for enhanced sensitivity and specificity.
Their ability to provide accurate results in a shorter timeframe has improved diagnostic efficiency across diverse clinical settings. Compact design, cost effectiveness, and the potential for integration with digital platforms have further strengthened their demand.
As innovation continues to focus on user friendly and rapid testing solutions, magnetic sensor test kits are expected to retain leadership within the product type segment.
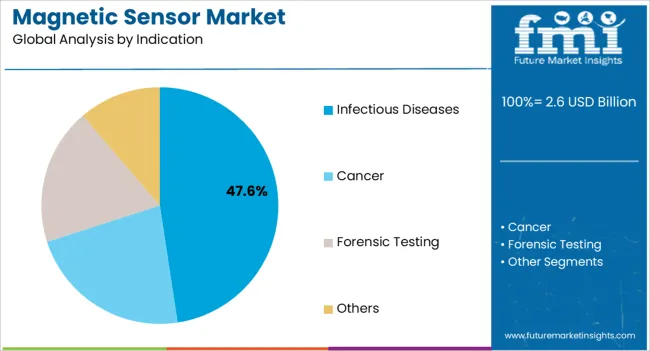
The infectious diseases segment is expected to hold 47.60% of total market revenue by 2025, making it the largest indication area. This growth is supported by the global rise in infectious disease incidence and the urgent need for early and reliable detection.
Magnetic sensors are being integrated into diagnostic kits that enable fast turnaround times and improved clinical outcomes. Increased public health initiatives and investments in disease surveillance have also contributed to greater adoption.
The combination of portability, accuracy, and suitability for large scale screening programs has positioned infectious diseases as the most significant indication for magnetic sensor applications.
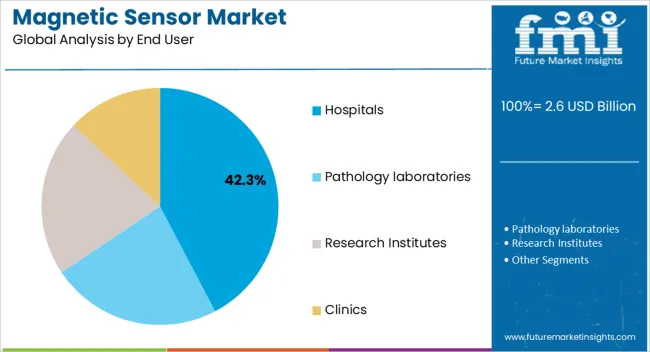
The hospitals segment is projected to capture 42.30% of market revenue by 2025 under the end user category, highlighting its leading role. This dominance is influenced by the extensive use of advanced diagnostic tools in hospital laboratories and the demand for accurate and rapid results to support patient management.
Hospitals are well equipped to adopt sensor based technologies due to their infrastructure, funding, and clinical expertise. Furthermore, the increasing number of hospital admissions related to infectious and chronic diseases is reinforcing demand for reliable diagnostic methods.
Hospitals continue to act as the primary hubs for technology adoption, consolidating their position as the largest end user segment for magnetic sensor solutions.
According to Future Market Insights, the magnetic sensor market accounted for USD 2,270.73 million in 2025. The market is set to reach USD 3,844.70 million by 2035.
Short-term Growth: The surging demand for these sensors in the automotive industry is a significant trend in the market. Magnetic sensors are used extensively in electric vehicles for measuring motor speed and position, battery state of charge, and other parameters. Magnetic sensors are increasingly being used in advanced driver assistance systems (ADAS) to enable several features. Including automatic emergency braking, lane departure warning, and adaptive cruise control.
Mid-term Growth: Magnetic sensors are finding increasing use in consumer electronics devices, including smartphones, wearables, and smart home devices. For instance, they are used in smartphones for compass and motion-sensing applications. Similarly, they are used in wearables for fitness tracking and navigation. Additionally, magnetic field sensors are used in smart home devices such as smart thermostats and security systems to detect motion and position.
Long-term Growth: The expansion of the Internet of Things (IoT) market may drive the magnetic sensor market during the time frame. IoT devices typically require sensors for measuring and detecting various parameters. Magnetic sensors are finding increasing use in a wide range of IoT applications, including smart cities, smart homes, and industrial IoT.
The rising demand for magnetic sensors in automated vehicles, consumer electronics, and healthcare products has been witnessed for higher shipment. Although, sales growth is considerably hampered by price erosion. This is due to the tight competition among magnetic sensor manufacturers.
Aggressive R&D activities result in quick innovation in new portable, consumer, and IoT applications. This results in pricing pressure and a decline in sales of magnetic sensors, particularly for high-volume applications. As a result, producers are forced to reduce the cost of magnetic sensors.
This price decrease not only impedes revenue growth in the market but also affects suppliers' profit margins. The primary challenges for manufacturers are to expand their manufacturing capabilities, produce higher-quality products, and reduce total production costs.
The magnetic sensor industry is thriving with a focus on developing cost-effective solutions using cutting-edge technologies. The demand for magnetic sensors is on the rise, driven by the need for greater accuracy and precision in factory automation systems. Magnetic sensors are being used extensively for position sensing, safety switches, and proximity detection to enhance production processes. As a result, magnetic sensor companies are presented with a golden opportunity to expand their market presence. Moreover, meet the growing demand for advanced magnetic sensing solutions.
With innovation at the forefront of their research and development, these companies are poised to revolutionize the industrial automation sector.
Latest Trends in Market
Thriving Automotive Industry is Driving Sales of Magnetic Sensors in the United States
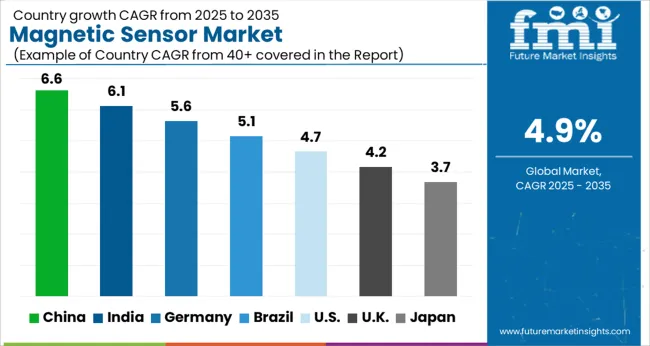
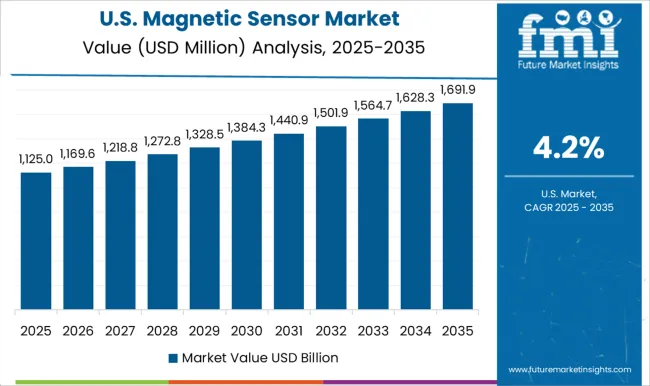
Currently, the United States holds around 23% of the share of the market. The market is predicted to generate an absolute dollar potential of USD 2.6 million between 2025 and 2035. Moreover, the market in the country is likely to capture a 3.8% CAGR during the forecast period.
The presence of a well-developed automotive sector, increasing use of new technologies, and the strong presence of prominent competitors may contribute to the market growth. According to the United States government, light vehicle sales hit 2.1 million units in 2020 in the country.
China is expected to hold 11.7% of the share in the Asia Pacific region with a CAGR of more than 5.5% between 2025 and 2035. The country's magnetic sensor industry is expected to grow 1.4X by 2035. China is experiencing rapid growth in the consumer electronics, industrial, and automobile industries.
Furthermore, Shenzhen Xinyak Sensor Technology, Shenzhen Meian Technology, and Shenzhen Deana Technology are some rising force sensor manufacturers in China. Thus, demand for magnetic sensors is predicted to be driven by the developing automotive and consumer electronics industries.
India is expected to thrive at a CAGR of 6.7%. Due to its fast-growing population, economic prosperity, and increasing penetration of contemporary technology. The country is emerging as a significant market for consumer electronics. This includes televisions, headphones, and smart gadgets – cameras, tablets, smartphones, and other home products.
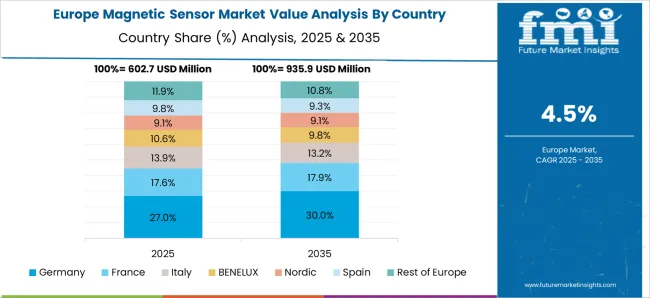
During the projected period, Germany is expected to maintain its dominance in the European market. The country is expected to increase 1.5X by 2035, resulting in an absolute dollar potential of USD 49.9 million.
The presence of developed infrastructure is expected to drive significant growth in sales of force sensors in Germany. For instance, automotive, healthcare, consumer electronics, energy & utility, and military & aerospace industries.
To suit client expectations, manufacturers across the country are constantly producing new items. The new product is resistant to moisture and dust and has high sensing accuracy. Such product development by prominent vendors drives the magnetic field sensor market in European countries.
Hall effect sensor segment by technology is expected to dominate the magnetic field sensor market with a share of 45.9% during the forecast period. The segment is forecast to record a 5.2% CAGR from 2025 to 2035.
Hall effect sensors are generally used to time the speed of shafts and wheels. Such as internal combustion engine ignition timing, anti-lock braking systems, and tachometers. They also find applications in brushless DC electric motors to detect the position of the permanent magnet. They also help with the electrification of engines and functional safety systems.
Thus, the rising adoption of hall effect sensors in automobile applications may boost the market growth globally.
The automotive sector is likely to continue dominating the worldwide market over the forecast period. During the projection period, the segment is expected to develop at a CAGR of 5.7%.
Magnetic sensors have become ubiquitous in various industries, from automotive and healthcare to aerospace and defense. Force sensors are increasingly relied upon for their sensitivity, reliability, and ease of integration. As the technology continues to evolve, magnetic field sensor manufacturers are finding new ways to meet the unique needs of each industry. Such as developing sensors that can withstand harsh environments, operate at extreme temperatures, or detect subtle changes in magnetic field sensors. With a wide range of applications and the potential for significant growth, the force sensor market is poised for continued expansion in the coming years.
The magnetic sensor market is not for the faint-hearted. With cut-throat competition among fabricators, only those who continuously innovate and incorporate advanced technologies can survive. The good news is that improved production techniques and the deployment of TMR technology offer a wealth of opportunities for startups in this market.
One such startup is Sonera Magnetics, which is developing a groundbreaking magnetic sensor. This sensor has the potential to revolutionize high-performance brain imaging by making it more affordable and portable. The sensor is converging different industries and cutting-edge technology. As Sonera Magnetics has the power to transform the healthcare industry and improve the lives of millions. In the world of magnetic sensors, the possibilities are endless, and the impact can be life-changing.
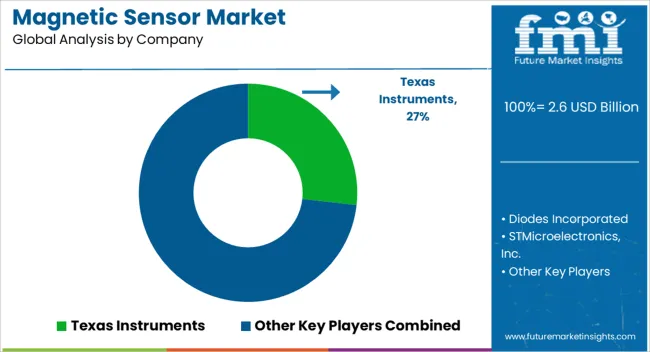
Due to a fragmented and highly concentrated competitive landscape, the force sensor industry is facing strong competition among key players. The global magnetic sensor market is being driven by new product developments and recent advances in sensing technology.
Another technique used by force sensor manufacturers is an aggressive investment in research and development activities. In order to create enhanced sensory components. Manufacturers intend to provide sensors with functions such as motion detection, speed, and proximity for various end-use verticals.
Recent Developments in the Market include:
Top Five Vendors in the Global Magnet Sensor Market
Allegro MicroSystems
Allegro MicroSystems was formed in 1990 and is based in Worcester, United States. The company is a subsidiary of Sanken Electric, one of Japan's leading analog IC product producers.
Its products are classified into six categories:
Asahi Kasei
Asahi Kasei was established in 1922 and is based in Tokyo, Japan. The company's core business is chemicals. It is one of Japan's prominent chemical businesses. It operates in four business segments: chemical and fabric, housing and building materials, electronics, and healthcare.
Infineon Technologies, Inc.
Infineon Technologies was founded in 1999 and is based in Neubiberg, Germany. The firm provides semiconductor and system solutions for the automotive and industrial industries. It is a pioneer in the development of chip cards and security systems for these industries. The company is well-known for its excellent quality, dependability, and innovation of cutting-edge technologies in analog solutions. Moreover, in radio frequency and power control systems.
Micronas Semiconductor
Micronas Semiconductor, headquartered in Zurich, Switzerland, was formed in 1989. The company is a prominent provider of intelligent and sensor-based system solutions for automotive and other industrial applications. Hall switches, linear Hall sensors, direct angle sensors, current transducers, gas sensors, and embedded microcontrollers are among the company's products.
Bosch Sensortec
Bosch Sensortec motion sensor range include: Accelerometers, Gyroscopes, Geomagnetic sensors, eCompass, Inertial Measurement Units, Absolute Orientation sensors, Smart Hubs & Nodes, and Sensor Fusion software. Motion sensors are developed for a wide range of applications. Including mobile devices, wearables, IoT and smart home, gaming and imaging devices, and industrial applications.
How can Manufacturers/Service Providers Scale their Businesses in the Magnetic sensor Market?
To scale their businesses in the magnetic sensor industry, manufacturers and service providers can focus on several strategies, including:
Diversification of Product/Service Offerings: One strategy for scaling in the magnetic sensor market is to diversify product and service offerings. This can involve expanding into new application areas and developing new testing methodologies. Besides, offering value-added services such as data analysis and interpretation. For example, a company called Sensor Technology Ltd offers a range of magnetic sensor services. It includes bespoke testing for specific applications, magnetic materials characterization, and failure analysis.
Investing in Research and Development: Another strategy for scaling is to invest in research and development to develop new and innovative testing solutions. This can involve the development of new testing methodologies, new test equipment, or the use of advanced simulation and modeling tools. For example, a company called Magnetic Sensors Ltd has developed a patented force sensor system. It uses a non-contact method to measure the magnetic properties of materials.
Collaboration with Industry Partners: Collaboration with industry partners can also be an effective strategy for driving the business. This can involve partnering with sensor manufacturers to develop new testing solutions. Similarly, partnering with end-users to develop testing methodologies that are tailored to specific applications. For example, the UK National Physical Laboratory (NPL) has collaborated with industry partners to develop a range of force sensor solutions. This includes a magnetic field camera for testing high-precision magnetic sensors.
Investing in Marketing and Sales: Finally, investing in marketing and sales can also be an effective strategy for scaling in the force sensor market. This can involve building brand awareness through targeted advertising and public relations. In addition, building relationships with key customers through networking and trade shows. For example, a company called TDK-Micronas has invested heavily in marketing and sales to become a leading provider of force sensor services. It now has a global customer base that includes leading automotive manufacturers.
The global magnetic sensor market is estimated to be valued at USD 2.6 billion in 2025.
The market size for the magnetic sensor market is projected to reach USD 4.2 billion by 2035.
The magnetic sensor market is expected to grow at a 4.9% CAGR between 2025 and 2035.
The key product types in magnetic sensor market are magnetic sensor test kits, transcription-mediated amplification (tma), polymerase chain reaction (pcr), ligase chain reaction (lcr), whole genome sequencing and consumables.
In terms of indication, infectious diseases segment to command 47.6% share in the magnetic sensor market in 2025.


Our Research Products

The "Full Research Suite" delivers actionable market intel, deep dives on markets or technologies, so clients act faster, cut risk, and unlock growth.

The Leaderboard benchmarks and ranks top vendors, classifying them as Established Leaders, Leading Challengers, or Disruptors & Challengers.

Locates where complements amplify value and substitutes erode it, forecasting net impact by horizon

We deliver granular, decision-grade intel: market sizing, 5-year forecasts, pricing, adoption, usage, revenue, and operational KPIs—plus competitor tracking, regulation, and value chains—across 60 countries broadly.

Spot the shifts before they hit your P&L. We track inflection points, adoption curves, pricing moves, and ecosystem plays to show where demand is heading, why it is changing, and what to do next across high-growth markets and disruptive tech

Real-time reads of user behavior. We track shifting priorities, perceptions of today’s and next-gen services, and provider experience, then pace how fast tech moves from trial to adoption, blending buyer, consumer, and channel inputs with social signals (#WhySwitch, #UX).

Partner with our analyst team to build a custom report designed around your business priorities. From analysing market trends to assessing competitors or crafting bespoke datasets, we tailor insights to your needs.
Supplier Intelligence
Discovery & Profiling
Capacity & Footprint
Performance & Risk
Compliance & Governance
Commercial Readiness
Who Supplies Whom
Scorecards & Shortlists
Playbooks & Docs
Category Intelligence
Definition & Scope
Demand & Use Cases
Cost Drivers
Market Structure
Supply Chain Map
Trade & Policy
Operating Norms
Deliverables
Buyer Intelligence
Account Basics
Spend & Scope
Procurement Model
Vendor Requirements
Terms & Policies
Entry Strategy
Pain Points & Triggers
Outputs
Pricing Analysis
Benchmarks
Trends
Should-Cost
Indexation
Landed Cost
Commercial Terms
Deliverables
Brand Analysis
Positioning & Value Prop
Share & Presence
Customer Evidence
Go-to-Market
Digital & Reputation
Compliance & Trust
KPIs & Gaps
Outputs
Full Research Suite comprises of:
Market outlook & trends analysis
Interviews & case studies
Strategic recommendations
Vendor profiles & capabilities analysis
5-year forecasts
8 regions and 60+ country-level data splits
Market segment data splits
12 months of continuous data updates
DELIVERED AS:
PDF EXCEL ONLINE
Magnetic Field Sensors Market
On-board Magnetic Sensors Market Trends and Forecast 2025 to 2035
Magnetic Absorption Data Line Market Size and Share Forecast Outlook 2025 to 2035
Magnetic Material Magnetization and Testing Equipment Market Size and Share Forecast Outlook 2025 to 2035
Magnetic Coupler Market Size and Share Forecast Outlook 2025 to 2035
Magnetic Shielding Device Market Size and Share Forecast Outlook 2025 to 2035
Magnetic Stripe Readers Market Size and Share Forecast Outlook 2025 to 2035
Magnetic Resonance Analyzer Market Size and Share Forecast Outlook 2025 to 2035
Magnetic Drive Pump Market Size and Share Forecast Outlook 2025 to 2035
Magnetic Separator Market Size and Share Forecast Outlook 2025 to 2035
Magnetic Ballast Market Size and Share Forecast Outlook 2025 to 2035
Magnetic Flowmeter Market Size and Share Forecast Outlook 2025 to 2035
Magnetic Resonance Imaging Coils Market Analysis - Size, Share, and Forecast 2025 to 2035
Magnetic Tape Market Analysis Size and Share Forecast Outlook 2025 to 2035
Magnetic Resonance Imaging (MRI) Contrast Agents Market Size and Share Forecast Outlook 2025 to 2035
Magnetic Crack Detectors Market Size and Share Forecast Outlook 2025 to 2035
Magnetic Materials Market Growth - Trends & Forecast 2025 to 2035
Magnetic Resonance Imaging (MRI) Market Trends - Size, Share & Forecast 2025 to 2035
Magnetic Grill Market Analysis – Trends, Growth & Forecast 2025 to 2035
Magnetic Closure Boxes Market Trends - Growth & Demand 2025 to 2035

Thank you!
You will receive an email from our Business Development Manager. Please be sure to check your SPAM/JUNK folder too.
Chat With
MaRIA