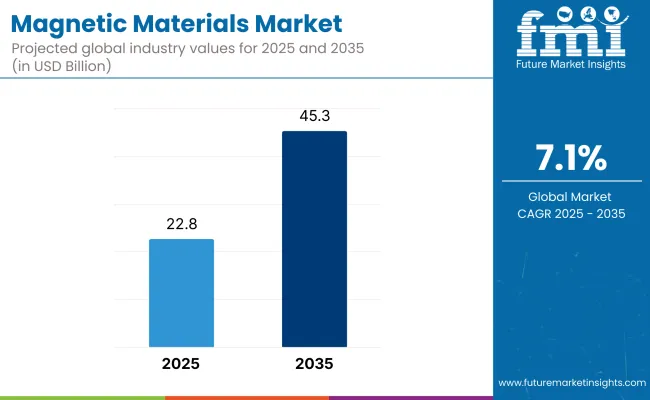
The global magnetic materials market is projected to grow from USD 22.8 billion in 2025 to USD 45.3 billion by 2035, reflecting a compound annual growth rate (CAGR) of 7.1% during the forecast period. Market growth is being driven by increasing demand for magnetic components in electric vehicles (EVs), industrial automation systems, consumer electronics, and renewable energy infrastructure.

| Metric | Value |
|---|---|
| Market Size (2025E) | USD 22.8 Billion |
| Market Size (2035F) | USD 45.3 Billion |
| CAGR (2025 to 2035) | 7.1% |
Permanent magnets, soft magnetic materials, and rare-earth magnets serve distinct roles in modern applications. Permanent magnets are extensively used in traction motors for electric vehicles and in appliance motors, where high efficiency and compactness are essential. According to Tesla’s 2024 sustainability report, the company continues to explore permanent magnet motor designs that exclude rare earths, aiming to balance performance and material availability. This approach underscores the industry's shift in magnetic material sourcing strategies.
Soft magnetic materials are being widely adopted in transformers and inductors, especially in high-frequency applications such as EV charging stations and solar inverters. With power conversion efficiency becoming a critical performance parameter, soft ferrites and nanocrystalline alloys are gaining traction. Siemens, in its 2024 industrial technology update, highlighted improvements in energy-efficient transformer cores using high-permeability soft magnetic alloys to support decentralized energy systems.
Rare-earth magnets, particularly neodymium-iron-boron (NdFeB), are integral to direct-drive wind turbines, robotics, and high-precision actuators. The International Energy Agency (IEA) has reported that demand for rare-earth elements for clean energy technologies is expected to triple by 2030. Manufacturers are responding by securing localized supply chains and investing in recycling infrastructure for rare-earth recovery, such as Hitachi Metals’ 2023 investment in rare-earth magnet recycling facilities in Japan.
Research and development efforts are accelerating in the field of nanostructured and composite magnetic materials, which offer enhanced performance under thermal and mechanical stress. These advancements are intended to meet the requirements of high-speed motors and compact magnetic assemblies used in aerospace and advanced industrial machinery. Academic collaborations and public-private research programs are supporting material innovation, especially in North America and Europe.

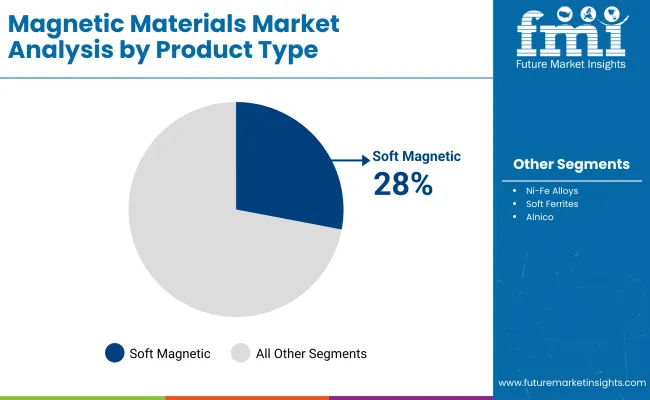
Soft magnetic materials are projected to account for approximately 28% of the global magnetic materials market share in 2025 and are expected to grow at a CAGR of 6.9% through 2035. This category encompasses iron-silicon alloys (electrical steel), soft ferrites, and amorphous or nanocrystalline alloys, all of which are widely used in motors, transformers, inductors, and magnetic shielding applications.
Electrical steel, in particular, is vital for enhancing efficiency in power transmission and distribution systems, while soft ferrites are favored in high-frequency electronic circuits. As demand for electric vehicles, renewable energy systems, and compact power electronics continues to grow, soft magnetic materials will remain central to enabling low-loss, high-efficiency magnetic performance.

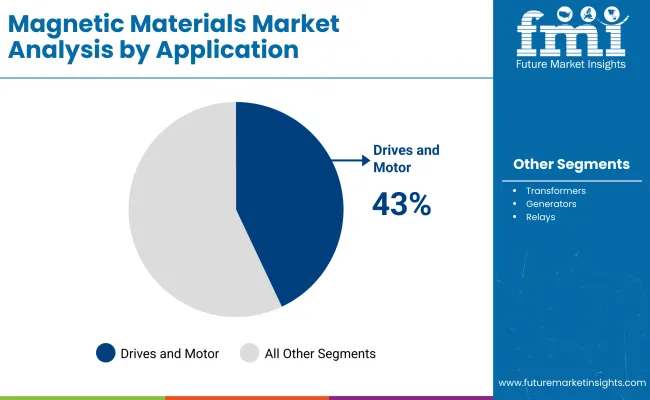
The drives and motors segment is projected to hold approximately 43% of the global magnetic materials market share in 2025 and is expected to grow at a CAGR of 7.4% through 2035. Magnetic materials such as Nd-Fe-B, SmCo, and soft ferrites are integral to the function of brushless DC motors, traction motors, servo motors, and stepper motors.
These components are widely used in electric vehicles, industrial machinery, HVAC systems, and home appliances. The increasing focus on energy efficiency and miniaturization is accelerating innovation in motor design, with high-performance magnets enabling higher torque density and reduced system weight. As industries push toward decarbonization and electrification, magnetic materials used in motor-driven systems will remain in high demand.
Few industries are under more pressure than the magnetic materials industry, which must navigate competing forces ranging from supply chain turbulence to rare-earth element scarcity. China controls the world’s supply of rare earth magnets, sparking concerns about potential rare earth export restrictions and geopolitical trade risks that could significantly impact production.
As environmental issues make rare-earth mining and processing increasingly tightly regulated, manufacturers are seeking greener alternatives and recycled magnet solutions. Moreover, these price variations are a significant market restraint, as the use of advanced magnetic materials, such as NdFeB and SmCo magnets, is associated with high production costs.
In the latter category, the industry also faces technical challenges in developing cost-efficient alternative magnetic materials, such as ferrite, hybrid composites, and bonded magnets, that can rival rare-earth-based materials.
Automakers are increasingly relying on high-efficiency permanent magnets for the electric drivetrains, energy regeneration systems, and battery cooling solutions that have made EVs (electric vehicles) and HEVs (hybrid vehicles) a huge growth opportunity. As global EV adoption rates are projected to surge, the demand for lightweight, high-strength magnetic materials is expected to rise.
Another major driver is the renewable energy sector, where offshore and onshore wind energy projects are seeking high-performance rare-earth magnets to accelerate the development of wind turbines. As countries continue to expand their wind power capabilities, there will be further investments in corrosion-resistant and energy-efficient magnet technologies.
New Technologies of Flexible and Printable Magnets: The latest opportunities to be explored in the manufacture of miniaturized soft magnetic components suitable for advanced medical devices, wearables, and wireless power transmission.
New recycling processes for magnets and secondary sourcing of rare-earth elements are emerging as permanent solutions to reduce risk and environmental impacts in the supply chain.

The functional films market in the USA is growing strongly due to higher demand from the electronics, automotive, packaging, and end-use sectors, such as solar and biofuel. Such technological advances in display technologies, semiconductor manufacturing, and energy-efficient solutions pose a growing demand for functional films with elevated performance. Demand for optical films, anti-glare films, and conductive films is particularly driven by the increasingly flexible display market for smartphones, tablets, and foldable devices.
Another significant old sector is the automotive industry, which is shifting towards lightweight materials, smart glass technology, and self-cleaning coatings, among others. Functional films are key components of solar control, anti-fog, and scratch-resistant coatings for automotive windows and displays. In addition, the increasing focus on sustainability is driving the use of biodegradable and recyclable functional films in the packaging and renewable energy sectors, particularly in solar panels and energy storage applications.
Government-led efforts have sought to encourage domestic semiconductor production by passing the CHIPS Act to domestically increase the number of semiconductor fabrication and flexible electronics, which are further fuelling the demand for functional films. To increase product shelf life, the Food and Beverage industry is progressively depending upon barrier films and aesthetic antimicrobials, thereby propelling the growth in the market.
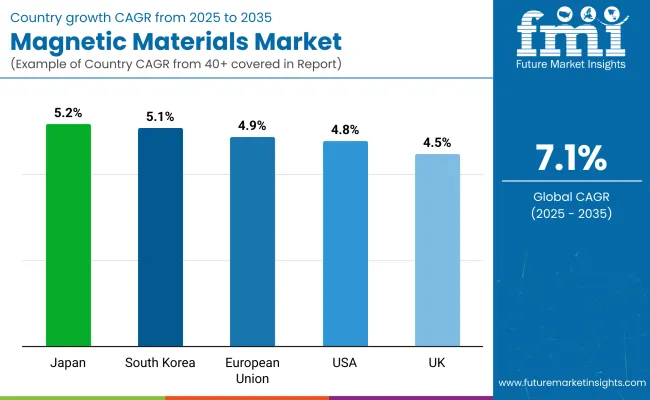
| Country | CAGR (2025 to 2035) |
|---|---|
| USA | 4.8% |
UK functional films market is expanding as a result of technological advancements in flexible electronics, rising demand for sustainable packaging, and innovations in automotive coatings. Driving demand for UV-blocking, heat-resistant and self-cleaning functional films is the emergence of smart buildings and energy efficient materials.
Demand for scratch-resistant, anti-glare and solar control films is growing with the UK’s strong automotive manufacturing sector. Additionally, companies are targeting next-gen electronic display materials, enabling the growing use of transparent conductive films in wearables and AR/VR devices.
It is also no surprise that the UK’s focus on sustainability and circular economy is driving manufacturers to develop recyclable and bio-based functional films for a diverse and growing range of packaging and consumer goods. Tight plastic waste regulations are driving businesses to innovate responsible barrier films, which are replacing traditional plastics.
| Country | CAGR (2025 to 2035) |
|---|---|
| UK | 4.5% |
Factors such as robust R&D investments in general and advanced materials across the European region, the growing need for renewable energy solutions, and compliance with regulatory frameworks driving sustainability within the industry are also contributing to the substantial growth of the European functional films market. Focus on Germany, France, and Italy as key markets, with a focus on display technologies, automotive coatings, and smart packaging solutions.
The EU’s Green Deal initiative is driving momentum towards using more energy-efficient films in solar panels and smart glass. Additionally, European automotive companies are incorporating self-healing, anti-fog, and heat-insulating films to enhance car durability and passenger comfort. The growing semiconductor industry in the region is also boosting the demand for functional films used in chip manufacturing and flexible circuits.
| Country | CAGR (2025 to 2035) |
|---|---|
| European Union (EU) | 4.9% |
The Japanese functional films market is at the forefront of technological innovation, driven by the country’s leadership in consumer electronics, automotive advancements, and high-end materials science. Japan’s expertise in high-resolution display technology is pushing the demand for optical films, anti-reflective coatings, and OLED protective layers.
With rapid adoption of autonomous and electric vehicles (EVs), Japan is seeing increased usage of anti-glare, anti-fingerprint, and UV-resistant films in automotive displays and infotainment systems. The high-tech manufacturing sector is also investing in functional films for semiconductor fabrication, flexible printed electronics, and advanced robotics.
Additionally, Japan is leading biodegradable film development, driven by government policies promoting sustainability. With companies like Toray and Mitsubishi Chemical investing in high-performance nanofilms, the market is poised for major technological advancements.
| Country | CAGR (2025 to 2035) |
|---|---|
| Japan | 5.2% |
Earlier, South Korean investment in areas such as consumer electronics, semiconductor technology, and flexible OLED displays has continued to drive growth in the functional films market in the country. Samsung and LG are pushing a high-clarity optical film, polarizer films and anti-smudge coatings that make South Korea a leader around the world in display innovation.
As 5G capabilities and IoT-enabled devices expand, demand is increasing for thin, conductive films for use in flexible circuits and printed electronics. In addition, the booming automotive and EV industry of South Korea will accelerate the installation of heat resistant and anti-glare film in next-generation vehicles.
The country is also leading traditional packaging, as brands pour in investment in bio-based and compostable barrier films.
| Country | CAGR (2025 to 2035) |
|---|---|
| South Korea | 5.1% |
Companies are prioritizing reshoring manufacturing to improve supply chain security and meet increasing demand in industries such as electric vehicles, electronics, and renewable energy. New facilities, including those focused on producing rare-earth-free permanent magnets, are enabling companies to drive innovation in sustainable magnet production. Simultaneously, major players are expanding their production of traditional rare earth magnets to align with regional strategies aimed at achieving independence in critical raw materials.
The overall market size for Magnetic Materials Market was USD 22.8 Billion in 2025.
The Magnetic Materials Market is expected to reach USD 45.3 Billion in 2035.
The Magnetic Materials Market is growing due to its use in chemicals, pharmaceuticals, agriculture, and sustainable production, with rising demand in coatings, resins, and fragrances.
The top 5 countries which drives the development of Magnetic Materials Market are USA, UK, Europe Union, Japan and South Korea.
Nd-Fe-B to command significant share over the assessment period.


Full Research Suite comprises of:
Market outlook & trends analysis
Interviews & case studies
Strategic recommendations
Vendor profiles & capabilities analysis
5-year forecasts
8 regions and 60+ country-level data splits
Market segment data splits
12 months of continuous data updates
DELIVERED AS:
PDF EXCEL ONLINE
Magnetic Stripe Readers Market Size and Share Forecast Outlook 2025 to 2035
Magnetic Resonance Analyzer Market Size and Share Forecast Outlook 2025 to 2035
Magnetic Drive Pump Market Size and Share Forecast Outlook 2025 to 2035
Magnetic Separator Market Size and Share Forecast Outlook 2025 to 2035
Magnetic Ballast Market Size and Share Forecast Outlook 2025 to 2035
Magnetic Sensor Market Size and Share Forecast Outlook 2025 to 2035
Magnetic Flowmeter Market Size and Share Forecast Outlook 2025 to 2035
Magnetic Resonance Imaging Coils Market Analysis - Size, Share, and Forecast 2025 to 2035
Magnetic Tape Market Analysis Size and Share Forecast Outlook 2025 to 2035
Magnetic Resonance Imaging (MRI) Contrast Agents Market Size and Share Forecast Outlook 2025 to 2035
Magnetic Crack Detectors Market Size and Share Forecast Outlook 2025 to 2035
Magnetic Resonance Imaging (MRI) Market Trends - Size, Share & Forecast 2025 to 2035
Magnetic Grill Market Analysis – Trends, Growth & Forecast 2025 to 2035
Magnetic Closure Boxes Market Trends - Growth & Demand 2025 to 2035
Magnetic Charging Cable Market Trends - Growth & Forecast 2025 to 2035
Magnetic Flow Meter Market Analysis by Product Type, Components, Technology, Application and Region - Trends, Growth & Forecast 2025 to 2035
Market Positioning & Share in the Magnetic Separator Industry
Competitive Breakdown of Magnetic Resonance Imaging Coils Suppliers
Magnetic Ablation Catheter Market Outlook – Share, Growth & Forecast 2025-2035
Magnetic Beads Market

Thank you!
You will receive an email from our Business Development Manager. Please be sure to check your SPAM/JUNK folder too.
Chat With
MaRIA