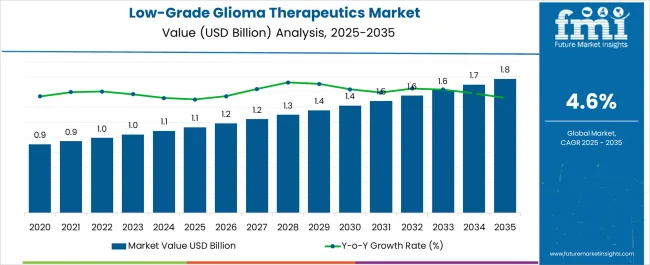
The low-grade glioma therapeutics market is estimated to be valued at USD 1.1 billion in 2025 and is projected to reach USD 1.8 billion by 2035, registering a compound annual growth rate (CAGR) of 4.6% over the forecast period.
Market dynamics diverge significantly from typical pharmaceutical sectors due to the patient population's unique characteristics and treatment preferences. Many patients opt for "watch and wait" approaches given the substantial side effects of conventional treatments, creating tension between oncologists advocating for early intervention and patients concerned about quality of life preservation. This dynamic influences treatment adoption patterns, with physicians navigating between progression monitoring and therapeutic timing decisions that can span years rather than months.
The therapeutic landscape reveals complex operational challenges related to molecular testing infrastructure and treatment sequencing protocols. IDH1/IDH2 mutations occur in 70-80% of adult-type diffuse gliomas, requiring comprehensive molecular profiling capabilities that many healthcare systems struggle to implement consistently. Laboratory workflows must accommodate specialized genetic testing while coordinating results with multidisciplinary tumor boards, creating bottlenecks in treatment initiation particularly in smaller medical centers lacking dedicated neuro-oncology programs.
Financial accessibility creates significant treatment disparities across patient populations and healthcare systems. Targeted therapies for IDH-mutant tumors can cost tens of thousands of dollars per treatment cycle, creating substantial financial burdens that many insurance providers cover inadequately. This cost structure particularly affects younger patients who may require decades of treatment, forcing difficult decisions between financial stability and disease management in ways that other cancer markets rarely encounter.
The competitive landscape operates under different parameters compared to traditional oncology markets due to the extended treatment timelines and limited patient populations. Market participants compete against alternative approaches including radiation therapy and chemotherapy, which despite their invasiveness, offer lower immediate costs and established treatment protocols. This creates unique positioning challenges where pharmaceutical companies must demonstrate value across decades rather than standard clinical trial durations.
Treatment sequencing decisions reveal operational tensions between different medical specialties and institutional priorities. Neurosurgeons, medical oncologists, and radiation oncologists often disagree on optimal intervention timing, creating internal conflicts within healthcare institutions about resource allocation and treatment pathway standardization. These disagreements become more pronounced given the prolonged disease course and multiple potential intervention points.
The market's evolution toward precision medicine approaches requires healthcare systems to develop new operational capabilities around molecular diagnostics and personalized treatment protocols. This transformation demands coordination between pathology laboratories, genetic counselors, and clinical teams in ways that challenge traditional cancer care workflows. Many institutions struggle with the infrastructure investments required to support comprehensive molecular profiling while managing the extended patient relationships characteristic of low-grade disease management.

| Metric | Value |
|---|---|
| Low-Grade Glioma Therapeutics Market Estimated Value in (2025 E) | USD 1.1 billion |
| Low-Grade Glioma Therapeutics Market Forecast Value in (2035 F) | USD 1.8 billion |
| Forecast CAGR (2025 to 2035) | 4.6% |
The low grade glioma therapeutics market is witnessing sustained growth driven by advancements in targeted therapies, rising prevalence of central nervous system tumors, and increasing adoption of precision medicine. Enhanced understanding of molecular pathways has encouraged the development of innovative drug classes designed to inhibit tumor progression while minimizing toxicity.
Regulatory incentives and growing clinical trial activity are further supporting pipeline expansion and therapeutic approvals. Patient demand for less invasive and more effective treatment options, coupled with healthcare infrastructure improvements, is fueling broader access to advanced therapeutics.
Digital health platforms and telemedicine have also improved patient engagement and prescription fulfillment. The outlook remains promising as stakeholders prioritize improved survival outcomes, quality of life, and accessibility in glioma care.
The trametinib drug class is projected to hold 39.20% of the total market revenue by 2025, positioning it as the leading therapeutic option within this category. Its growth is attributed to proven efficacy in targeting specific signaling pathways that drive tumor development.
Increased adoption has been supported by favorable clinical outcomes, longer progression free survival rates, and integration into standard care protocols. Ongoing research into combination therapies has further strengthened the relevance of trametinib in glioma treatment.
Strong physician confidence and increasing patient awareness of its therapeutic benefits continue to consolidate its leadership in the drug class segment.
The topical route of administration is expected to account for 56.80% of overall revenue by 2025, making it the dominant route of delivery. Its adoption is being driven by patient preference for non invasive treatment modalities and reduced systemic side effects compared to injectable or oral formulations.
Topical delivery ensures localized concentration of therapeutics, enhancing effectiveness while minimizing toxicity. This approach has gained traction among healthcare providers for its ease of administration, better patient compliance, and adaptability to outpatient care.
These factors collectively reinforce the position of the topical route as the most preferred mode of administration within the low grade glioma therapeutics market.
The online pharmacies distribution channel is projected to represent 42.30% of market revenue by 2025, reflecting its dominance in the distribution category. Rising consumer preference for digital platforms, home delivery convenience, and discreet purchasing options has accelerated growth.
Enhanced digital infrastructure and regulatory support for e pharmacy operations have further boosted adoption. Online channels offer broader access to therapeutic options, especially in regions with limited physical pharmacy networks, while improving affordability through competitive pricing and subscription models.
As patients increasingly adopt online healthcare solutions, this channel has established itself as the leading pathway for therapeutic distribution in the low grade glioma therapeutics market.
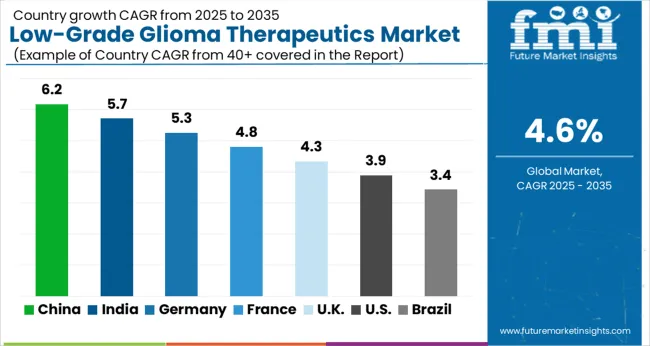
According to market research and competitive intelligence provider Future Market Insights- the market for Low-grade Glioma therapeutics reflected a value of 3.4% during the historical period, 2020 to 2025.
Increased research and development activities in the field of low-grade glioma therapeutics have resulted in the development of new and improved treatments, further driving growth in the market. Moreover, increasing healthcare expenditure, driven by factors such as an aging population and increasing awareness of the need for effective treatments for low-grade gliomas, has also contributed to the growth of the market.
Thus, the market for Low-grade Glioma therapeutics is expected to register a CAGR of 4.57% in the forecast period 2025 to 2035.
New and effective medical technologies spurring growth of low-grade Glioma therapeutics
The incidence of brain tumors, including low-grade gliomas, is increasing globally, driving demand for effective treatments. There has been an increase in public and medical awareness of low-grade gliomas, which is leading to earlier diagnoses and more effective treatments. The development of new and more effective medical technologies for the diagnosis and treatment of low-grade gliomas is driving the growth of the market.
Increased healthcare expenditure globally, especially in developed countries, is driving the growth of the low-grade glioma therapeutics market as people are more willing to pay for effective treatments. The increasing focus on research and development of new treatments for low-grade gliomas is leading to the development of new and more effective therapies, driving market growth.
Availability of different treatments driving growth of Glimoa therapeutics
Surgery: The goal of surgical treatment is to remove as much of the tumor as possible while preserving normal brain function. In some cases, the entire tumor may be removed, but in many cases, only a portion can be safely removed.
Radiation therapy: Radiation therapy uses high-energy beams to destroy the tumor cells. This treatment is often used after surgery to help kill any remaining tumor cells and reduce the risk of recurrence.
Chemotherapy: Chemotherapy involves the use of drugs to kill cancer cells. It is not commonly used to treat low-grade gliomas as these tumors are often resistant to chemotherapy.
Targeted therapy: Targeted therapy uses drugs to specifically target the cancer cells, rather than damaging normal cells. This type of therapy is still being studied for the treatment of low-grade gliomas, but it has shown promise in early clinical trials.
Difficulty in diagnosing and expensive treatments creating obstacles for low-grade therapeutics market
The cost of treatments for low-grade gliomas is high, making them inaccessible to many patients, especially in developing countries. Currently, there are limited effective treatments for low-grade gliomas, and many of the available treatments come with significant side effects.
Low-grade gliomas can be difficult to diagnose, and the symptoms are often similar to those of other neurological conditions, making it difficult for physicians to make an accurate diagnosis. The underlying causes of low-grade gliomas are not well understood, making it difficult to develop new and effective treatments.
The low-grade glioma therapeutics market faces competition from alternative treatments, such as radiation therapy and chemotherapy, which are less invasive and less expensive.

Research and development leading to innovation of medications for treating low-grade glioma therapeutics in North America
The North America low-grade glioma therapeutics market is one of the largest and most mature markets in the world. The market is driven by factors such as a high incidence of brain tumors, an aging population, increasing awareness of low-grade gliomas, and rising healthcare expenditure.
In North America, the United States is the largest market for low-grade glioma therapeutics, driven by factors such as a high incidence of brain tumors, a large and aging population, and a high level of healthcare expenditure. Canada is also a significant market for low-grade glioma therapeutics, driven by factors such as an aging population and increasing healthcare expenditure.
The North America low-grade glioma therapeutics market is dominated by major players such as Roche, Novartis, and Pfizer, who offer a range of treatments for low-grade gliomas, including chemotherapy, radiation therapy, and surgical treatments. The market is expected to continue to grow in the coming years, driven by advances in medical technology and increasing research and development activities in the field.
Overall, the North America low-grade glioma therapeutics market offers a significant opportunity for growth, driven by a large and aging population, increasing awareness of low-grade gliomas, and rising healthcare expenditure. Thus, North America is expected to possess 45% market share for low-grade glioma therapeutics market in 2025.

Rising healthcare expenditure bolstering the market for low-grade glioma therapeutics
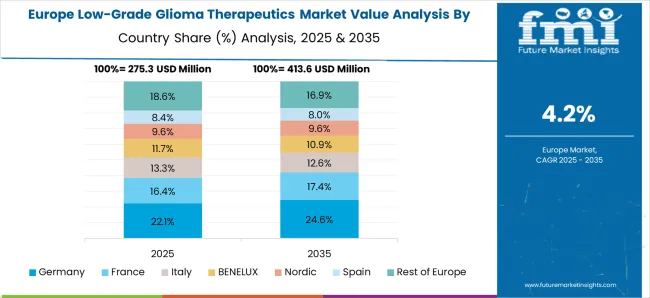
The Europe low-grade glioma therapeutics market offers a significant opportunity for growth, driven by a large and aging population, increasing awareness of low-grade gliomas, and rising healthcare expenditure. In Europe, the market is driven by a number of countries, including the United Kingdom, Germany, France, Italy, and Spain, which are among the largest markets for low-grade glioma therapeutics in the region.
The Europe low-grade glioma therapeutics market is dominated by major players such as Roche, Novartis, and Pfizer, who offer a range of treatments for low-grade gliomas, including chemotherapy, radiation therapy, and surgical treatments.
The market is expected to grow at a moderate pace in the coming years, driven by advances in medical technology and increasing research and development activities in the field. Thus, Europe is expected to possess 37% market share for low-grade glioma therapeutics market in 2025.
Access to wider drugs making hospital pharmacies popular for low-grade glioma therapeutics
Hospital pharmacists have specialized training in managing and dispensing medications for patients with neurological conditions, including low-grade gliomas. This expertise can help ensure that patients receive the most appropriate and effective treatments for their condition. In addition, hospital pharmacies play a key role in coordinating care for patients with low-grade gliomas. Pharmacists can work with other healthcare providers, such as neurologists and oncologists, to ensure that patients receive the most appropriate and effective treatments for their condition.
Hospital pharmacies have access to a wider range of specialty drugs, including those used to treat low-grade gliomas. This can be especially important for patients with rare or complex conditions, who may require treatments that are not widely available.
Hospital pharmacists can monitor patients' treatments for low-grade gliomas, including monitoring for potential side effects and drug interactions. This can help ensure that patients receive the most effective and safe treatments for their condition. Thus, hospital pharmacies are expected to procure 40% market share for low-grade glioma therapeutics market in 2025.

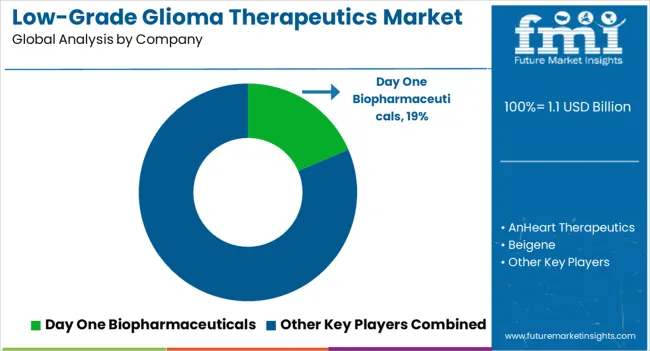
The Low-grade Glioma Therapeutics Market is gaining momentum as advances in molecular oncology, precision medicine, and targeted therapy reshape treatment strategies for slow-growing brain tumors. Leading biopharmaceutical innovators such as Day One Biopharmaceuticals, AnHeart Therapeutics, and SpringWorks Therapeutics are driving clinical progress with next-generation small-molecule inhibitors and precision drugs that target genetic mutations such as BRAF, FGFR, and NTRK fusions common in pediatric and adult low-grade gliomas. Their focus on mutation-specific therapies reflects a major shift from traditional radiation and chemotherapy toward personalized, less toxic treatment pathways.
BeiGene, Incyte Corporation, and Eli Lilly and Company are expanding oncology pipelines to include immunotherapy and combination regimens that modulate tumor microenvironments and enhance immune system response. Servier and Hoffmann-La Roche Ltd. are leveraging established neuro-oncology expertise and companion diagnostic platforms to improve early diagnosis, disease monitoring, and patient stratification.
Forma Therapeutics and Helsinn Healthcare SA are exploring supportive and adjunct therapies aimed at improving quality of life and managing treatment-related side effects. Their work complements emerging approaches that integrate targeted, immune, and precision-based interventions into long-term management strategies.
The market is being shaped by advances in biomarker discovery, growing clinical adoption of next-generation sequencing, and increased regulatory incentives for rare and pediatric oncology research. As new molecules move through late-stage trials, partnerships between pharmaceutical innovators, academic centers, and diagnostic firms are accelerating commercialization timelines. The growing focus on durable responses and reduced toxicity positions the low-grade glioma therapeutics market for strong, sustained innovation and expansion.
| Report Attribute | Details |
|---|---|
| Market Value in 2025 | USD 1.1 billion |
| Market Value in 2035 | USD 1.8 billion |
| Growth Rate | CAGR of 4.57% from 2025 to 2035 |
| Base Year for Estimation | 2025 |
| Historical Data | 2020 to 2025 |
| Forecast Period | 2025 to 2035 |
| Quantitative Units | Revenue in USD Million and CAGR from 2025 to 2035 |
| Report Coverage | Revenue Forecast, Volume Forecast, Company Ranking, Competitive Landscape, Growth Factors, Trends and Pricing Analysis |
| Segments Covered | Drug Class, Route of Administration, Distribution Channel, Region |
| Regions Covered | North America; Latin America; Europe; South Asia; East Asia; Oceania; Middle East and Africa(MEA) |
| Key Countries Profiled | USA, Canada, Brazil, Mexico, Rest of Latin America, Germany, United Kingdom, France, Spain, Italy, Rest of Europe, India, Malaysia, Singapore, Thailand, Rest of South Asia, China, Japan, South Korea, Austria, New Zealand, GCC countries, South Africa, Israel, Rest of Middle East and Africa(MEA) |
| Key Companies Profiled |
Day One Biopharmaceuticals, AnHeart Therapeutics, BeiGene, SpringWorks Therapeutics, Servier, Hoffmann-La Roche Ltd., Incyte Corporation, Eli Lilly and Company, Forma Therapeutics, Helsinn Healthcare SA |
| Customization | Available Upon Request |
The global low-grade glioma therapeutics market is estimated to be valued at USD 1.1 billion in 2025.
The market size for the low-grade glioma therapeutics market is projected to reach USD 1.8 billion by 2035.
The low-grade glioma therapeutics market is expected to grow at a 4.6% CAGR between 2025 and 2035.
The key product types in low-grade glioma therapeutics market are trametinib, dabrafenib, ivosidenib and mirdametinib.
In terms of route of administration, topical segment to command 56.8% share in the low-grade glioma therapeutics market in 2025.


Our Research Products

The "Full Research Suite" delivers actionable market intel, deep dives on markets or technologies, so clients act faster, cut risk, and unlock growth.

The Leaderboard benchmarks and ranks top vendors, classifying them as Established Leaders, Leading Challengers, or Disruptors & Challengers.

Locates where complements amplify value and substitutes erode it, forecasting net impact by horizon

We deliver granular, decision-grade intel: market sizing, 5-year forecasts, pricing, adoption, usage, revenue, and operational KPIs—plus competitor tracking, regulation, and value chains—across 60 countries broadly.

Spot the shifts before they hit your P&L. We track inflection points, adoption curves, pricing moves, and ecosystem plays to show where demand is heading, why it is changing, and what to do next across high-growth markets and disruptive tech

Real-time reads of user behavior. We track shifting priorities, perceptions of today’s and next-gen services, and provider experience, then pace how fast tech moves from trial to adoption, blending buyer, consumer, and channel inputs with social signals (#WhySwitch, #UX).

Partner with our analyst team to build a custom report designed around your business priorities. From analysing market trends to assessing competitors or crafting bespoke datasets, we tailor insights to your needs.
Supplier Intelligence
Discovery & Profiling
Capacity & Footprint
Performance & Risk
Compliance & Governance
Commercial Readiness
Who Supplies Whom
Scorecards & Shortlists
Playbooks & Docs
Category Intelligence
Definition & Scope
Demand & Use Cases
Cost Drivers
Market Structure
Supply Chain Map
Trade & Policy
Operating Norms
Deliverables
Buyer Intelligence
Account Basics
Spend & Scope
Procurement Model
Vendor Requirements
Terms & Policies
Entry Strategy
Pain Points & Triggers
Outputs
Pricing Analysis
Benchmarks
Trends
Should-Cost
Indexation
Landed Cost
Commercial Terms
Deliverables
Brand Analysis
Positioning & Value Prop
Share & Presence
Customer Evidence
Go-to-Market
Digital & Reputation
Compliance & Trust
KPIs & Gaps
Outputs
Full Research Suite comprises of:
Market outlook & trends analysis
Interviews & case studies
Strategic recommendations
Vendor profiles & capabilities analysis
5-year forecasts
8 regions and 60+ country-level data splits
Market segment data splits
12 months of continuous data updates
DELIVERED AS:
PDF EXCEL ONLINE
Biotherapeutics Virus Removal Filters Market Trends – Growth & Forecast 2025 to 2035
COPD Therapeutics Market Report – Growth, Demand & Industry Forecast 2023-2033
Digital Therapeutics and Wellness Market Size and Share Forecast Outlook 2025 to 2035
Digital Therapeutics Market Size and Share Forecast Outlook 2025 to 2035
Peptide Therapeutics Market Analysis - Growth & Forecast 2024 to 2034
Advanced Therapeutics Pharmaceutical Outsourcing Market Size and Share Forecast Outlook 2025 to 2035
Glaucoma Therapeutics Market Size and Share Forecast Outlook 2025 to 2035
Leukemia Therapeutics Treatment Market Analysis - Growth & Forecast 2025 to 2035
Microbiome Therapeutics Market Size and Share Forecast Outlook 2025 to 2035
The Canine Flu Therapeutics Market is segmented by product, and end user from 2025 to 2035
Stuttering Therapeutics Market Trends, Analysis & Forecast by Treatment, Type, End-Use and Region through 2035
Pet Cancer Therapeutics Market Insights - Growth & Forecast 2024 to 2034
Candidiasis Therapeutics Market Size and Share Forecast Outlook 2025 to 2035
Lung Cancer Therapeutics Market Analysis – Size, Share, and Forecast Outlook 2025 to 2035
Heart Block Therapeutics Market Size and Share Forecast Outlook 2025 to 2035
Aquaculture Therapeutics Market Size and Share Forecast Outlook 2025 to 2035
Fucosidosis Therapeutics Market - Growth & Innovations 2025 to 2035
Market Leaders & Share in Alzheimer’s Therapeutics
Alzheimer’s Therapeutics Market Analysis by Disease Class into Cholinesterase Inhibitors, NMDA Receptor Antagonists and Combinations Through 2035.
Sarcoidosis Therapeutics Market

Thank you!
You will receive an email from our Business Development Manager. Please be sure to check your SPAM/JUNK folder too.
Chat With
MaRIA