The global low calorie desserts market is projected to grow from USD 1.6 billion in 2025 to USD 3 billion by 2035, registering a CAGR of 6.5%. Market expansion is being driven by growing consumer focus on health, wellness, and clean-label indulgence.
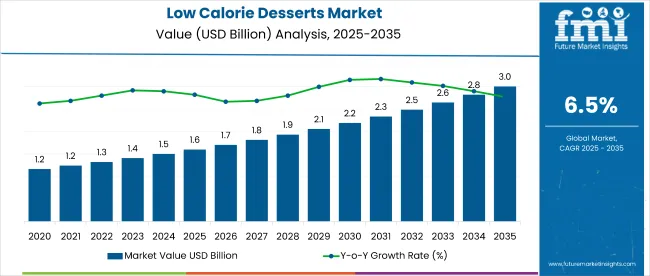
| Metric | Value |
|---|---|
| Industry Size (2025E) | USD 1.6 billion |
| Industry Value (2035F) | USD 3 billion |
| CAGR (2025 to 2035) | 6.5% |
The rising prevalence of lifestyle-related diseases such as obesity and diabetes is pushing consumers toward desserts that are low in calories, sugar, and fat, while still delivering satisfying taste and texture. Manufacturers are responding with innovations in formulation using sugar substitutes, dietary fibers, and natural sweeteners across product types like cakes, pastries, ice creams, and puddings.
The market holds an estimated 6% share in the global healthy snacks market and accounts for around 4% within the functional food and beverage market. It contributes 2.5% to the global confectionery market and about 0.5% to the processed food market.
Within the low-fat and low-sugar food category, it commands a 7% share, reflecting rising demand for guilt-free indulgences. In the broader health and wellness food market, its presence is relatively niche, with a 1.2% share, while in the expansive global food and beverage market, its contribution remains minimal at less than 0.1%.
Government regulations impacting the market focus on food safety, sugar reduction, and nutritional labeling. Guidelines such as the Food Safety and Standards (Labeling and Display) Regulations, 2020 in India, and policies from global bodies like the WHO’s recommendations on sugar intake are influencing product development and ingredient use.
These mandates are pushing manufacturers to reformulate offerings with reduced sugar content, promote clean-label claims, and ensure transparency in nutritional information driving consumer trust and adoption of lowcalorie desserts.
Japan is projected to be the fastest-growing market, expected to expand at a CAGR of 7.2% from 2025 to 2035. Conventional will lead the nature segment with a 65% share, while plant-based will dominate the source segment with a 58% share. The USA and Germany markets are expected to grow steadily at CAGRs of 6.3% and 6.1%, respectively, while the UK and France will follow with CAGRs of 5.8% and 5.9%, respectively.
The global market is segmented by nature, source, product type, packaging, distribution channel, and region. By nature, the market is categorized into organic and conventional. In terms of source, the market is divided into animal based and plant based. Based on product type, the market includes bakery desserts, frozen desserts, and dairy-based desserts.
By packaging, the market includes bottles & jars, stand-up pouches, and other packaging types. Based on distribution channel, the market is classified into direct sales, modern trade, convenience stores, departmental stores, specialty stores, drug store/pharmacies, online retailers, and other sales channels. Regionally, the market is classified into North America, Latin America, Europe, South Asia, East Asia, Oceania, and the Middle East & Africa.
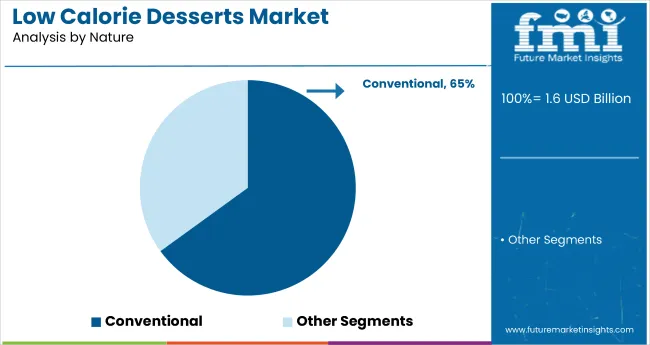
Conventional is expected to dominate the nature segment by 2025, capturing a 65% market share due to its affordability, widespread availability, and strong consumer preference in both developed and emerging markets. Efficient supply chains, bulk processing advantages, and minimal regulatory hurdles further enhance its competitiveness across global retail and foodservice platforms.
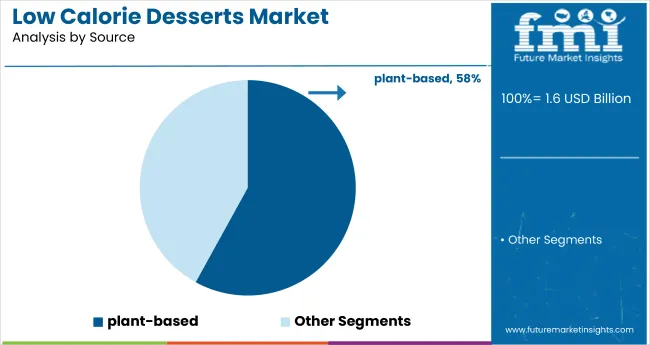
Plant based is projected to capture 58% of the source segment in 2025, supported by eco-conscious innovation, allergen-free claims, and dietary lifestyle shifts. Expanding product portfolios, fortified nutritional profiles, and retail shelf space are further accelerating adoption across both developed and emerging consumer markets focused on wellness and sustainability.
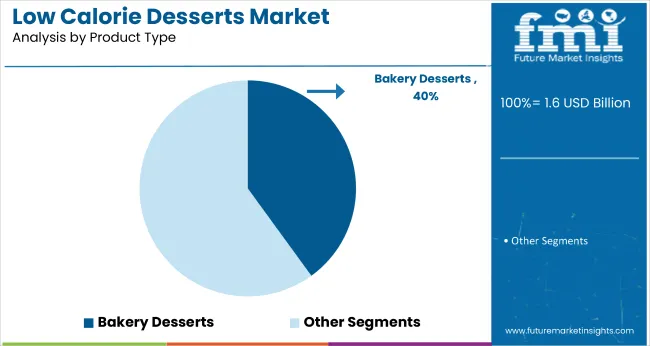
Bakery desserts are projected to lead the product type segment in 2025, capturing a 40% market share, supported by strong demand for lowcalorie cakes, muffins, and pastries that offer indulgence without compromising health. Innovations in sugar substitutes, high-protein flours, and clean-label toppings are driving growth across retail and foodservice distribution channels.
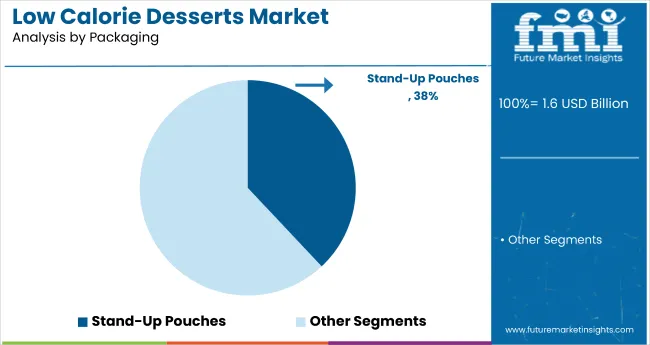
Stand-up pouches are expected to dominate the packaging segment in 2025, capturing a 38% market share due to their convenience, resealability, lightweight design, and ability to extend shelf life for low calorie dessert products. Growing adoption in e-commerce, reduced transportation costs, and eco-friendly material innovations further support their widespread use across health-focused snack categories.
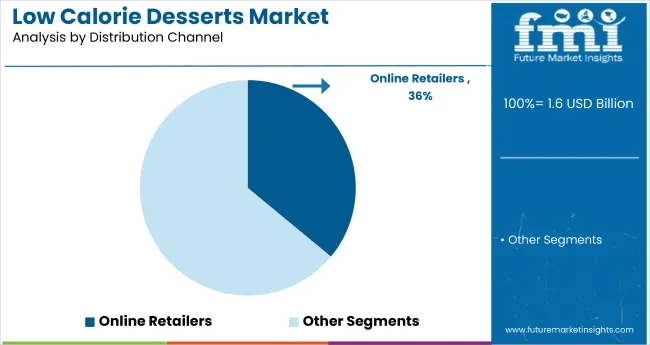
Online retailers are projected to lead the distribution channel in 2025, capturing a 36% market share, driven by increasing digital adoption, health-focused shopping behavior, and the convenience of home delivery and broader product availability. Personalized recommendations, subscription models, and targeted marketing campaigns are further boosting consumer engagement and accelerating growth across online health and wellness platforms.
The global low calorie desserts market is witnessing steady growth, fueled by rising consumer awareness about health, wellness, and the harmful effects of excessive sugar intake. These desserts offer indulgence with fewer calories, catering to the growing demand for guilt-free snacking options among health-conscious consumers.
Recent Trends in the Low Calorie Desserts Market
Challenges in the Low Calorie Desserts Market
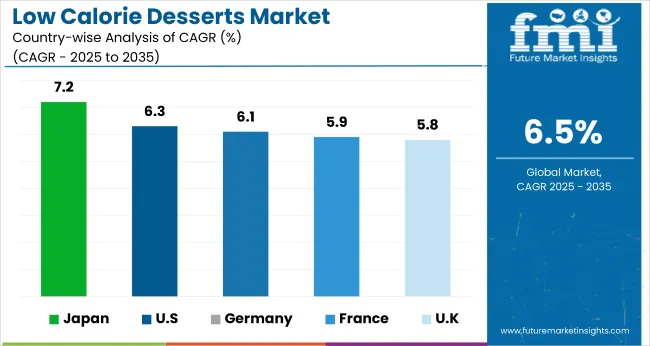
Japan’s momentum in the market is anchored in technological innovation, a strong focus on aging population health, and high consumer spending on functional foods. Germany and France maintain consistent demand, driven by EU health guidelines, sugar reduction mandates, and adherence to clean-label food labeling standards. Developed markets such as the USA(6.3% CAGR), UK(5.8% CAGR), and Japan (7.2% CAGR) are projected to grow at a steady 0.89-1.11x the global growth rate.
Japan leads the market with the highest growth rate, supported by robust demand for functional, sugar-free, and plant-based desserts. The United States follows, propelled by interest in protein-rich, keto-friendly, and clean-label offerings. Germany shows steady expansion, backed by consumer preferences for health-certified bakery items and nutrition transparency.
France experiences consistent growth due to national sugar-reduction policies and rising demand for premium, dairy-free options. The United Kingdom records the slowest growth among leading countries, with demand driven by portion-controlled, gluten-free desserts and government-backed health campaigns. Japan’s growth significantly outpaces global trends, while the UK slightly trails behind.
The report covers an in-depth analysis of 40+ countries; five top-performing OECD countries are highlighted below.
The Japan lowcalorie desserts market is projected to grow at a CAGR of 7.2% from 2025 to 2035. Growth is supported by strong demand for clean-label, sugar-free, and functional dessert products among an aging population with rising health concerns. Japan prioritizes innovation in low-glycemic index products and plant-based alternatives. Urban consumers favor single-serve, portion-controlled items with premium packaging, driving market growth across convenience and retail sectors.
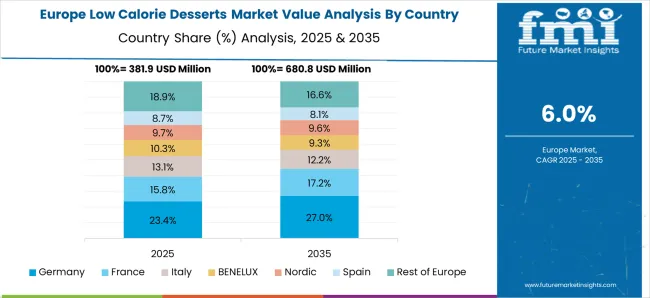
The Germany low calorie desserts revenue is expected to expand at a CAGR of 6.1% from 2025 to 2035. Market growth is driven by demand for health-labeled bakery items, clean-label claims, and reduced-sugar confectionery across supermarket shelves. Major consumption comes from working professionals and younger consumers seeking healthier indulgences. Germany leads in food tech integration, emphasizing transparent nutrition and sustainability-focused branding.
The French low calorie desserts market is forecast to grow at a CAGR of 5.9% from 2025 to 2035. Demand is influenced by sugar-reduction policies, wellness trends, and the premiumization of dessert formats in urban areas. French consumers are embracing functional, dairy-free options and reduced-sugar frozen desserts. Small-scale organic producers are also on the rise, catering to eco-conscious and health-aware consumers.
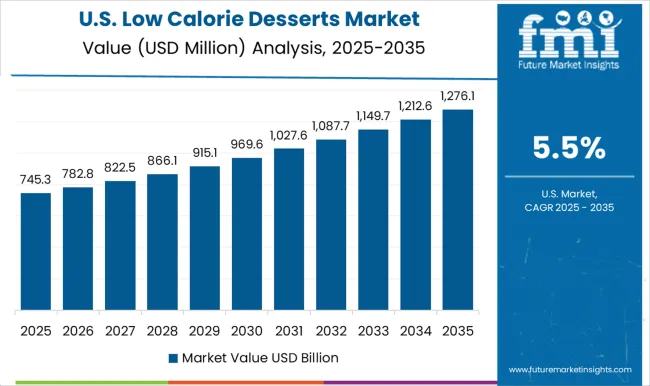
The USA low calorie desserts revenue is expected to grow at a CAGR of 6.3% from 2025 to 2035. Growth is driven by consumer demand for better-for-you indulgences, keto-friendly formats, and protein-rich dessert innovations. Busy lifestyles and high obesity rates are encouraging the adoption of low calorie alternatives in ice cream, cakes, and snacks. Retailers are expanding clean-label and functional offerings through both online and offline channels.
The UK low calorie desserts market is projected to grow at a CAGR of 5.8% from 2025 to 2035, representing the slowest growth among top OECD nations at 0.89x the global pace. Market expansion is supported by government sugar-reduction programs, increased diabetes awareness, and changing consumer habits toward healthier snacks. Demand is rising for portion-controlled formats and gluten-free, low calorie desserts.
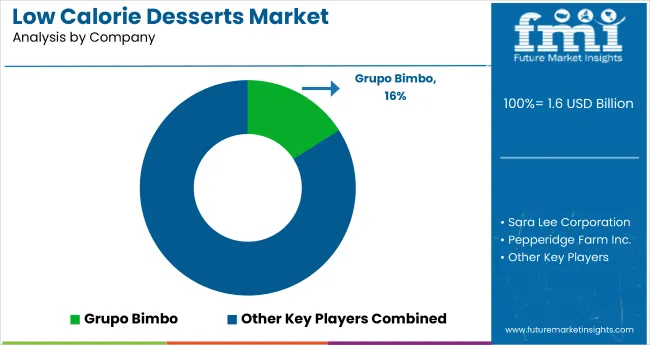
The global market is moderately consolidated, with leading players such as Bake-N-Serv Inc., Lawler Foods Ltd., Del Monte Food, Inc, Welch Foods, Inc., and Grupo Bimbo, S.A.B. de C.V. dominating the landscape. These companies specialize in offering a wide range of low calorie baked, frozen, and dairy-based desserts that cater to the rising demand for health-conscious indulgences. Bake-N-Serv Inc. focuses on frozen bakery solutions, while Lawler Foods Ltd. is known for its customized, low sugar dessert lines.
Del Monte Food, Inc. emphasizes clean-label fruit-based desserts, and Welch Foods, Inc. leads in low sugar fruit snacks and spreads. Grupo Bimbo and Sara Lee Corporation continue to innovate within the bakery segment with reduced calorie product lines. Other key players such as Dole Food Company, Inc., Perkins & Marie Callender's, LLC, and Pepperidge Farm Inc. contribute by offering high-quality, functional desserts across retail and foodservice channels.
| Report Attributes | Details |
|---|---|
| Market Size (2025) | USD 1.6 billion |
| Projected Market Size (2035) | USD 3 billion |
| CAGR (2025 to 2035) | 6.5% |
| Base Year for Estimation | 2024 |
| Historical Period | 2020 to 2024 |
| Projections Period | 2025 to 2035 |
| Report Parameter | USD billion for value/volume in metric tons |
| Nature Analyzed | Organic and Conventional |
| Source Analyzed | Animal Based and Plant Based |
| Product Type Analyzed | Bakery Desserts, Frozen Desserts, and Dairy Based Desserts |
| Packaging Analyzed | Bottles & Jars, Stand-Up Pouches, and Other Packaging Types |
| Distribution Channel Analyzed | Direct Sales, Modern Trade, Convenience Stores, Departmental Store, Specialty Store, Drug Store/Pharmacies, Online Retailers, and Other Sales Channels |
| Regions Covered | North America, Latin America, Europe, South Asia, East Asia, Oceania, and the Middle East & Africa |
| Countries Covered | United States, United Kingdom, Germany, France, Japan, China, India, Brazil, South Korea, Australia and 40+ countries |
| Key Players Influencing the Market | Bake-N-Serv Inc., Lawler Foods Ltd., Del Monte Food, Inc, Welch Foods, Inc., Grupo Bimbo, S.A.B. de C.V., Sara Lee Corporation, Dole Food Company, Inc., Perkins & Marie Callender's, LLC, Pepperidge Farm Inc. |
| Additional Attributes | Dollar sales by product type, share by source and nature, regional demand growth, clean-label influence, packaging innovations, competitive benchmarking |
The global low calorie desserts market is estimated to be valued at USD 1.6 billion in 2025.
The market size for the low calorie desserts market is projected to reach USD 3.0 billion by 2035.
The low calorie desserts market is expected to grow at a 6.5% CAGR between 2025 and 2035.
The key product types in low calorie desserts market are organic and conventional.
In terms of source, animal based segment to command 62.7% share in the low calorie desserts market in 2025.


Our Research Products

The "Full Research Suite" delivers actionable market intel, deep dives on markets or technologies, so clients act faster, cut risk, and unlock growth.

The Leaderboard benchmarks and ranks top vendors, classifying them as Established Leaders, Leading Challengers, or Disruptors & Challengers.

Locates where complements amplify value and substitutes erode it, forecasting net impact by horizon

We deliver granular, decision-grade intel: market sizing, 5-year forecasts, pricing, adoption, usage, revenue, and operational KPIs—plus competitor tracking, regulation, and value chains—across 60 countries broadly.

Spot the shifts before they hit your P&L. We track inflection points, adoption curves, pricing moves, and ecosystem plays to show where demand is heading, why it is changing, and what to do next across high-growth markets and disruptive tech

Real-time reads of user behavior. We track shifting priorities, perceptions of today’s and next-gen services, and provider experience, then pace how fast tech moves from trial to adoption, blending buyer, consumer, and channel inputs with social signals (#WhySwitch, #UX).

Partner with our analyst team to build a custom report designed around your business priorities. From analysing market trends to assessing competitors or crafting bespoke datasets, we tailor insights to your needs.
Supplier Intelligence
Discovery & Profiling
Capacity & Footprint
Performance & Risk
Compliance & Governance
Commercial Readiness
Who Supplies Whom
Scorecards & Shortlists
Playbooks & Docs
Category Intelligence
Definition & Scope
Demand & Use Cases
Cost Drivers
Market Structure
Supply Chain Map
Trade & Policy
Operating Norms
Deliverables
Buyer Intelligence
Account Basics
Spend & Scope
Procurement Model
Vendor Requirements
Terms & Policies
Entry Strategy
Pain Points & Triggers
Outputs
Pricing Analysis
Benchmarks
Trends
Should-Cost
Indexation
Landed Cost
Commercial Terms
Deliverables
Brand Analysis
Positioning & Value Prop
Share & Presence
Customer Evidence
Go-to-Market
Digital & Reputation
Compliance & Trust
KPIs & Gaps
Outputs
Full Research Suite comprises of:
Market outlook & trends analysis
Interviews & case studies
Strategic recommendations
Vendor profiles & capabilities analysis
5-year forecasts
8 regions and 60+ country-level data splits
Market segment data splits
12 months of continuous data updates
DELIVERED AS:
PDF EXCEL ONLINE
Low-Fat Low-Calorie Desserts Market Insights - Consumer Shifts 2025 to 2035
Low Vibration Thermostat Market Size and Share Forecast Outlook 2025 to 2035
Low-Level Order Picker Pallet Truck Market Size and Share Forecast Outlook 2025 to 2035
Low Voltage Components Market Size and Share Forecast Outlook 2025 to 2035
Low Temperature Flexible Tester Market Size and Share Forecast Outlook 2025 to 2035
Low Light Imaging Market Forecast Outlook 2025 to 2035
Low Density Polyethylene Market Forecast and Outlook 2025 to 2035
Low-Temperature Cable Market Size and Share Forecast Outlook 2025 to 2035
Low Molecular Weight Chondroitin Sulfate Sodium Market Size and Share Forecast Outlook 2025 to 2035
Low Temperature Radiators Market Size and Share Forecast Outlook 2025 to 2035
Low Rolling Resistance Tire Market Size and Share Forecast Outlook 2025 to 2035
Low Temperature Commercial Boiler Market Size and Share Forecast Outlook 2025 to 2035
Low Emissivity Film Market Size and Share Forecast Outlook 2025 to 2035
Low Voltage Residential Switchgear Market Size and Share Forecast Outlook 2025 to 2035
Low Voltage Substation Market Size and Share Forecast Outlook 2025 to 2035
Low Migration Inks Market Size and Share Forecast Outlook 2025 to 2035
Low Voltage Distribution Panel Market Size and Share Forecast Outlook 2025 to 2035
Low Voltage Surge Arrester Market Size and Share Forecast Outlook 2025 to 2035
Low Density Polyethylene Packaging Market Size and Share Forecast Outlook 2025 to 2035
Low Temperature Insulation Materials Market Size and Share Forecast Outlook 2025 to 2035

Thank you!
You will receive an email from our Business Development Manager. Please be sure to check your SPAM/JUNK folder too.
Chat With
MaRIA