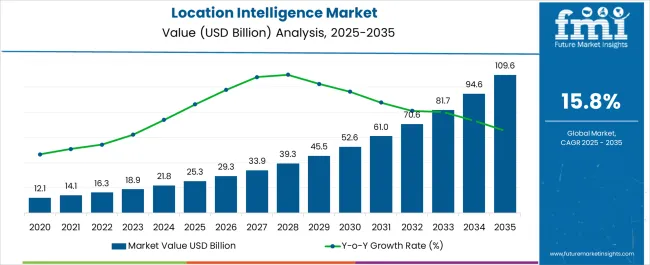
The Location Intelligence Market is estimated to be valued at USD 25.3 billion in 2025 and is projected to reach USD 109.6 billion by 2035, registering a compound annual growth rate (CAGR) of 15.8% over the forecast period.

| Metric | Value |
|---|---|
| Location Intelligence Market Estimated Value in (2025 E) | USD 25.3 billion |
| Location Intelligence Market Forecast Value in (2035 F) | USD 109.6 billion |
| Forecast CAGR (2025 to 2035) | 15.8% |
The location intelligence market is experiencing strong momentum as enterprises increasingly rely on geospatial data analytics to enhance decision making, operational efficiency, and customer engagement. Rising adoption of IoT devices, mobile applications, and connected platforms has amplified the demand for real time location data across industries.
Government initiatives supporting smart city development and infrastructure planning are further boosting deployment of location intelligence solutions. The integration of advanced technologies such as artificial intelligence and cloud computing is enabling higher accuracy, scalability, and predictive capabilities.
Organizations are leveraging these tools to optimize logistics, enhance workforce productivity, and improve customer targeting. The outlook remains favorable as the market continues to align with digital transformation initiatives, regulatory compliance, and strategic business intelligence requirements across global enterprises.
The BFSI vertical is projected to hold 41.70% of the overall revenue in 2025, making it a leading industry contributor. Growth in this segment is being driven by the need for fraud detection, customer location based services, and compliance with regulatory requirements.
Financial institutions are increasingly utilizing geospatial analytics to assess risk, identify fraudulent transactions, and expand market reach. Additionally, integration of location data with digital banking platforms has enhanced customer personalization and engagement.
The rising emphasis on branch optimization and resource allocation has further supported adoption. This alignment of security, compliance, and operational needs has secured BFSI as one of the most significant verticals in the market.
The workforce management application segment is expected to account for 47.90% of the total revenue in 2025, positioning it as the dominant application area. This leadership is attributed to the ability of location intelligence solutions to optimize employee scheduling, field service management, and resource allocation.
Real time tracking of personnel improves accountability, reduces operational inefficiencies, and enhances service delivery. The adoption of mobile workforce solutions in industries such as utilities, logistics, and retail has further accelerated demand.
By enabling predictive analytics and performance monitoring, location intelligence platforms have strengthened workforce productivity and cost control. This has established workforce management as a primary application driver in the overall market.
The system integration service segment is forecasted to contribute 55.20% of the overall revenue in 2025, making it the leading service category. This dominance is being reinforced by the growing complexity of enterprise IT environments and the need for seamless integration of geospatial analytics with existing business systems.
Enterprises are prioritizing system integration to unify disparate data sources, enhance interoperability, and ensure real time data flow across platforms. The service also supports scalability, enabling organizations to expand their analytical capabilities without disrupting operations.
With digital transformation initiatives gaining pace globally, system integration remains a critical enabler of efficient deployment, positioning it as the most influential service segment in the location intelligence market.
As per FMI, the Location Intelligence market is expected to reach over USD 109.6 billion by 2035. In the first half of 2025, the global market increased at a CAGR of 16.45%, which is a market share of USD 25.3 billion. Although not evenly distributed throughout all regions, this growth is stronger in developing markets, where it is predicted to reach USD 18.85 billion by 2025 with a CAGR of 15.8%.
To enhance public health measures during the pandemic, healthcare and government institutions utilized location-based solutions. In addition, the utilization of location analytics also helped businesses deal with the uncertainty associated with the pandemic.
Overcrowding in hospitals and a shortage of ventilators, equipment, and other vital supplies have all plagued the health infrastructure sector since the pandemic. Location data play a crucial role in the administration of local emergency services. The use of location data has become a critical tool for overcoming these obstacles and optimizing resources in the healthcare sector.
| Historical CAGR | 16.45% |
|---|---|
| Historical Market Value (2025) | USD 16.28 billion |
| Forecast CAGR | 15.8% |
Various business operations are becoming increasingly reliant on Location Intelligence (LI) due to the growing prevalence of Internet of Things (IoT) technology. Due to the similarities between smartphones and IoT devices, retailers can use advanced location intelligence data to gain an understanding of a particular region's demographics.
By mapping customer purchase patterns and customer time spent in the shop, retailers can enhance the customer experience and increase sales. By analyzing consumer behavior, such as visitation and purchase patterns, location-based advertising allows marketers to optimize sales.
IoT-driven smart shelves can also guide customers to locate a particular product, as well as provide real-time information to managers regarding a shortage. This further augments the market demand for location intelligence. Location intelligence also facilitates strategic store planning and inventory management.
By 2025, Sales & Marketing Optimization Applications may dominate the global market with a share of more than 19.5%. It is expected that the segment is expected to continue to dominate over the forecast period.
Based on applications, the industry has been segmented into asset management, facility management, workforce management, risk management, sales and marketing optimization, remote monitoring, customer management, and others.
A location intelligence tool reduces the complexity of marketing and sales by gathering enough relevant data for a marketing campaign and predicting its outcome. Location intelligence allows for continuous monitoring and management of inventory, energy consumption, and temperature at the facility.
Management can also monitor and trace the workforce in indoor and outdoor environments with location intelligence. Using location intelligence, companies can estimate maintenance cycles for assets, track employee activities, and manage staff remotely. As a consequence, location intelligence tools are expected to increase market demand by improving operational efficiency.
In terms of services, the global industry can be divided into consulting, system integration, and others. The system integration category segment dominated the industry and accounted for over 45% of the total revenue. As IoT penetration increases and location-based data becomes more prevalent, the segment is growing due to the need to integrate new data sources.
With location intelligence, system integrators help many industries collect information that can then be used to gain meaningful insights by integrating assets, business processes, and products. The system integrator also has expertise in understanding and working with both spatial and non-spatial data businesses, open data sources, and commercial data suppliers.
During the forecast period, consulting services are predicted to record a CAGR of 16%. In this service, several business use cases are identified and prioritized, where location intelligence can provide significant value to companies.
Location intelligence assists companies in collecting, analyzing, and examining relevant information, and offers more precise opinions to other organizations. A variety of end-use industries seek advice from IoT consulting and location intelligence firms on how to integrate location intelligence tools into their daily operations.

In 2025, North America led the industry with more than 33.00% of total revenue. This is due to companies such as Bosch, Qualcomm, GE, HERE, Apple, and Google, which dominate the industry with their IoT and location intelligence products.
It is expected to grow steadily over the forecast period. It is also projected that the smartphone market in North America is expected to grow steadily at a steady rate, since smartphone penetration was around 80% in 2025.
The region not only quickly adopts new technologies, but also has a superb IT infrastructure with strong and exceptional connectivity. The two countries with the leading market shares, the United States and Canada, are the main users of location intelligence software both in this region and globally.

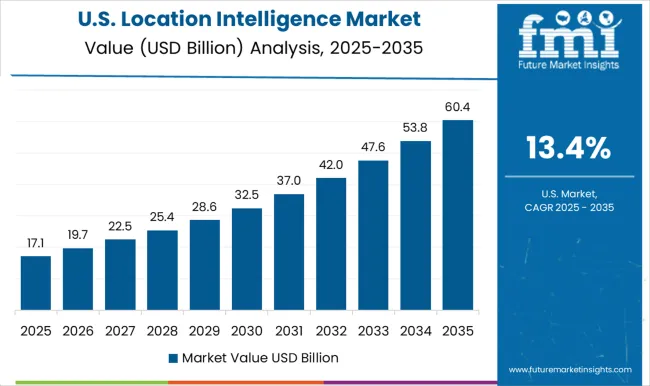
The location intelligence market in the United States has a very promising demand forecast, and growth is anticipated to continue over the next few years. This is due to several factors, including the increasing adoption of location-based technologies, the growing need for real-time data and insights, and the increasing importance of location data in various industries such as retail, healthcare, and logistics.
Location intelligence solutions provide valuable insights and analytics based on location data, allowing organizations to better understand their customers, target their marketing efforts more effectively, and improve operational efficiency. This has led to a growing demand for these solutions among United States businesses and government agencies.
In addition, advances in technology, such as the widespread availability of GPS-enabled devices, the growth of the Internet of Things (IoT), and the increasing use of location-based services, are driving the growth of the location intelligence market in the United States.
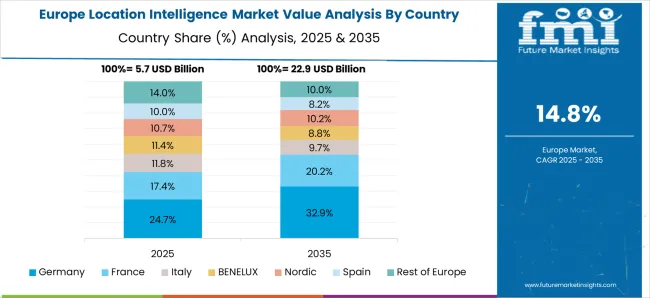
Several factors are driving the growth of the location intelligence market in Germany

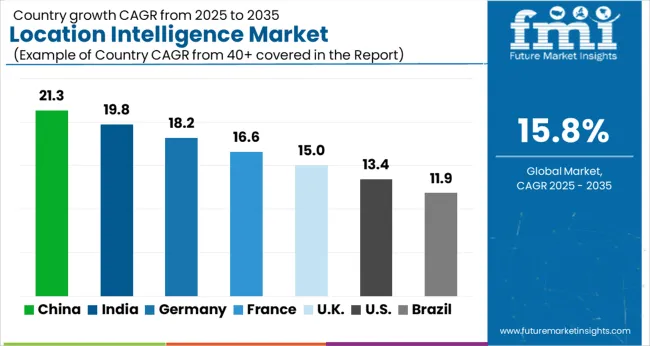
As smartphone users grow, service providers increase, networking technologies are improved, and social media popularity increases, China is forecast to register the significant CAGR over the forecast period.
Businesses and service providers in China are introducing cutting-edge products and services to gain a foothold in developing markets. In China, governments and municipal corporations are analyzing information about asset locations to optimize their services and ease citizens' workloads to deliver a better standard of living.
Therefore, companies are turning to location intelligence tools to improve asset management and make operations more efficient, which is expected to increase the demand for location intelligence.
There are many start-ups in the location intelligence market, offering innovative solutions and services to businesses and government agencies. These start-ups are leveraging the latest technologies, such as artificial intelligence, machine learning, and cloud computing, to provide cutting-edge location intelligence solutions. Some examples of start-ups in the location intelligence market include:
These start-ups are at the forefront of innovation in the location intelligence market and are helping businesses and government agencies leverage the power of location data to make more informed decisions.
Location-tracking solutions can be used to track and monitor employees and their interactions within an organization. Location analytics can also be used to define spatial boundaries that restrict inter-team communication.
A company's inorganic growth strategies include partnerships, geographical expansion, and mergers & acquisitions to sustain its competitive position in the market. It also invests in research and development to create technologically advanced and differentiated tools to get ahead. To gain insight into past purchases, spending patterns, customer loyalty, and location information, companies invest in a variety of technologies.
Partnership & Agreements
Product Launches
| Attribute | Details |
|---|---|
| Forecast Period | 2025 to 2035 |
| Historical Data Available for | 2020 to 2025 |
| Market Analysis | USD billion for Value and MT for Volume |
| Key Regions Covered | North America; Latin America; Europe; The Middle East and Africa; East Asia |
| Key Countries Covered | United States, Canada, Brazil, Mexico, Chile, Peru, Germany, United Kingdom, Spain, Italy, France, Russia, Poland, China, India, Japan, Australia, New Zealand, GCC Countries, North Africa, South Africa, and Türkiye |
| Key Segments Covered | Vertical, Application, Service, Region |
| Key Companies Profiled | Autodesk Inc.; Tibco Software Inc.; ESRI; MDA Corporation; Trueposition Inc.; Bosch Software Innovations GmbH; Qualcomm Technologies Inc.; Wireless Logic; HERE Technologies; Trimble Inc.; Supermap Software Co. Ltd.; Navizon Inc.; Pitney Bowes Inc. |
| Report Coverage | Market Forecast, Company Share Analysis, Competition Intelligence, DROT Analysis, Market Dynamics and Challenges, and Strategic Growth Initiatives |
| Customization & Pricing | Available upon Request |
The global location intelligence market is estimated to be valued at USD 25.3 billion in 2025.
The market size for the location intelligence market is projected to reach USD 109.6 billion by 2035.
The location intelligence market is expected to grow at a 15.8% CAGR between 2025 and 2035.
The key product types in location intelligence market are bfsi, government & defense, retail & consumer goods and it & telecom.
In terms of application, workforce management segment to command 47.9% share in the location intelligence market in 2025.


Full Research Suite comprises of:
Market outlook & trends analysis
Interviews & case studies
Strategic recommendations
Vendor profiles & capabilities analysis
5-year forecasts
8 regions and 60+ country-level data splits
Market segment data splits
12 months of continuous data updates
DELIVERED AS:
PDF EXCEL ONLINE
Location Analytics Market Size and Share Forecast Outlook 2025 to 2035
Location-Based Marketing Services Market Trends - Growth & Forecast through 2035
Colocation Edge Data Center Market Size and Share Forecast Outlook 2025 to 2035
Tip Location Device Market Analysis – Size, Share, and Forecast Outlook 2025 to 2035
Micro-location Technology Market Size and Share Forecast Outlook 2025 to 2035
Indoor Location Market Size and Share Forecast Outlook 2025 to 2035
Retail Colocation Market Size and Share Forecast Outlook 2025 to 2035
Real Time Location System (RTLS) Market Size and Share Forecast Outlook 2025 to 2035
Hazardous Location Limit Switches Market
Data Centre Colocation Market Size and Share Forecast Outlook 2025 to 2035
Intelligence Surveillance Reconnaissance (ISR) Market Size and Share Forecast Outlook 2025 to 2035
Lead Intelligence Software Market Size and Share Forecast Outlook 2025 to 2035
Sales Intelligence Software Market Size and Share Forecast Outlook 2025 to 2035
Sales Intelligence Market Size and Share Forecast Outlook 2025 to 2035
Threat Intelligence Market Size and Share Forecast Outlook 2025 to 2035
Energy Intelligence Solution Market - Growth & Forecast 2025 to 2035
Signals Intelligence (SIGINT) Market Size and Share Forecast Outlook 2025 to 2035
Content Intelligence – AI-Powered Insights for Marketers
Audience Intelligence Platform Market Size and Share Forecast Outlook 2025 to 2035
Decision Intelligence Market Forecast and Outlook 2025 to 2035

Thank you!
You will receive an email from our Business Development Manager. Please be sure to check your SPAM/JUNK folder too.
Chat With
MaRIA