The Lead Intelligence Software Market is estimated to be valued at USD 9.3 billion in 2025 and is projected to reach USD 17.2 billion by 2035, registering a compound annual growth rate (CAGR) of 6.4% over the forecast period.
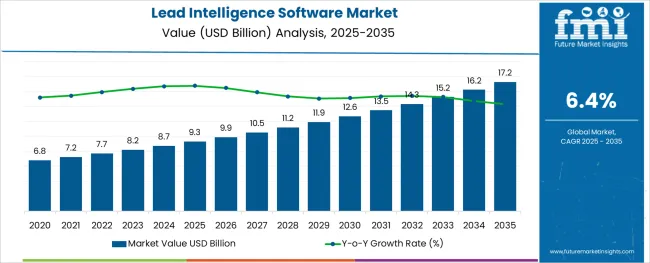
The lead intelligence software market has witnessed sustained momentum as organizations across industries increasingly prioritize data-driven decision-making and customer acquisition strategies. The rising complexity of lead generation processes and the growing need for real-time insights into prospect behavior have driven the adoption of advanced software solutions.
Businesses are leveraging these platforms to automate lead qualification, enhance targeting accuracy, and optimize sales pipelines, contributing to consistent market expansion. A shift toward account-based marketing practices, coupled with heightened competition in digital channels, has further underscored the value of comprehensive lead intelligence systems.
In the near future, market growth is expected to be propelled by the integration of artificial intelligence, predictive analytics, and customer intent data, enabling enterprises to gain deeper visibility into lead conversion potential. Additionally, increasing demand from B2B sectors, the proliferation of multi-touch attribution models, and investments in cloud-based marketing ecosystems are anticipated to sustain positive market momentum. The market’s ability to improve operational efficiency and deliver actionable insights positions it as an essential tool within modern sales and marketing operations.
The market is segmented by Type and Application and region. By Type, the market is divided into On-Premises and Cloud-based. In terms of Application, the market is classified into Large Enterprises and SMEs. Regionally, the market is classified into North America, Latin America, Western Europe, Eastern Europe, Balkan & Baltic Countries, Russia & Belarus, Central Asia, East Asia, South Asia & Pacific, and the Middle East & Africa.
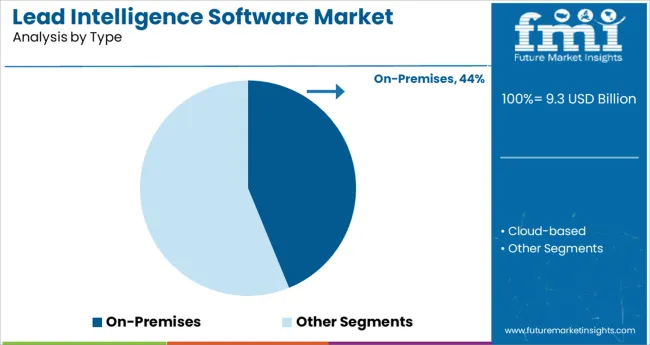
The on-premises segment accounted for approximately 43.8% of the total lead intelligence software market share, maintaining its relevance despite the growing popularity of cloud-based deployments. Its sustained presence has been driven by large enterprises and industries with stringent data security, compliance, and regulatory mandates, where control over sensitive customer and lead data is paramount.
Organizations operating in finance, healthcare, and government sectors, in particular, continue to favor on-premises solutions to mitigate cybersecurity risks and ensure seamless integration with legacy IT infrastructure. The segment's growth has also been supported by the need for customized software environments that accommodate proprietary workflows and business logic.
While market trends indicate a steady migration toward cloud platforms, on-premises deployments remain favored for their ability to offer greater control over infrastructure, operational autonomy, and enhanced data governance capabilities. Continued investments in on-premises systems featuring AI-enabled analytics, robust encryption frameworks, and hybrid integration capabilities are projected to sustain this segment’s demand, particularly within sectors requiring high data confidentiality.
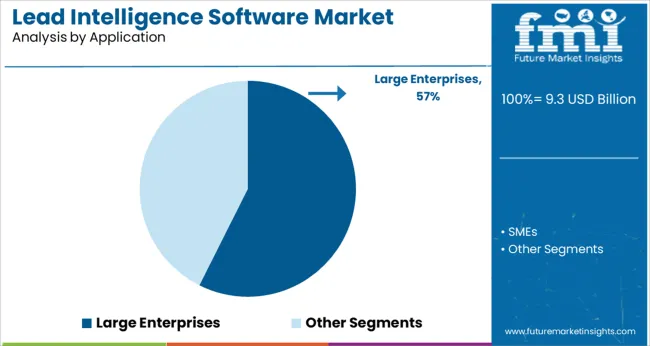
Within the application category, the large enterprises segment led with a commanding 57.4% market share, underscoring its significant contribution to overall market growth. The substantial adoption of lead intelligence software among large corporations has been attributed to the scale and complexity of their sales operations, which demand sophisticated tools for lead scoring, segmentation, and conversion optimization.
Large enterprises often operate extensive customer databases and multi-regional marketing campaigns, necessitating centralized platforms capable of delivering actionable insights from diverse data sources. The segment's performance has been further enhanced by the growing emphasis on data privacy regulations, with organizations investing in advanced lead intelligence systems that ensure compliance while improving targeting precision.
Additionally, increased adoption of AI-driven analytics, customer intent modeling, and sales automation within large enterprises has reinforced their reliance on these platforms to maintain competitive advantage. Continued investments in enterprise-grade software solutions and the integration of predictive lead scoring functionalities are expected to uphold this segment’s dominant market position over the forecast period.
The COVID-19 pandemic has had a positive impact on the lead intelligence software market, thanks to increased investments by various companies in emerging technologies such as AI and machine learning, as well as growing demand for lead intelligence software among businesses to identify potential customers and improve their growth opportunities.
The market for lead intelligence software has expanded in recent years. In 2024, the global market for lead intelligence software will be worth USD 6.8 billion, up from USD 5.4 billion in 2020. The discontinuation of in-person meetings and trade shows was one of COVID-19's most significant effects on the B2B market.
According to eMarketer, a poll from Demand Gen Report in 2024 found that over 53% of US B2B marketers believe trade fairs and in-person meetings are efficient ways to convert leads. The reduction in the frequency of trade fairs and personal encounters has had a substantial impact on lead generation and sales.
When compared to traditional lead-generating methods, lead-generating systems save time and money while delivering the needed outcomes. Lead-generating software for the real estate industry helps to reduce burden while also increasing lead conversion and efficiency.
The real estate sector is being driven by rising individual income, an increasing desire to relocate due to employment requirements, and increased construction activity around the world. Commercial, residential, industrial, and agricultural real estate are the most common categories.
The land is an investment opportunity for one of this sector's consumer groups. In addition, renting real estate is a booming lead intelligence software market in many urban areas.
The financial and insurance sectors are expanding quickly in both developing and developed economies. Consumption has increased as per capita disposable income has increased. As income rises, more banks, non-banking financial institutions, and finance corporations are eager to lend money for a variety of purposes.
Customers can get a vehicle loan, an education loan, a home loan, a personal loan, an agriculture loan, or a gold loan. Insurance businesses also provide health insurance, travel insurance, vehicle insurance, term insurance, and property insurance, among other insurance categories. Lead intelligence software and services can be used by businesses and organizations to reach relevant clients with a high conversion rate.
The lead intelligence software market is segmented into type, application, and region. In the projected period, the Cloud-Based segment of the lead intelligence software market is expected to develop at a significant CAGR of 6.3% through 2035. The increasing desire for convenience, lower prices, and faster deployment, as well as high flexibility, are driving the expansion of this regional market.
As cloud services are relatively inexpensive, SMEs are increasingly adopting them. The increased demand for data security has prompted businesses to use cloud computing solutions, which provide a number of advantages over on-premises systems.
Large enterprise is the leading segment in the lead intelligence software market, with an anticipated CAGR of 6.1% through 2035. Lead intelligence software assists businesses in better managing business possibilities by focusing on the most active leads that are ready to be sold.
Lead Intelligence software's lead-generating features include user segmentation based on their unique profile, as well as activity across many channels and user engagement in a multi-touch-point world.
Marketers can utilize this data to precisely target their advertising campaigns to potential purchasers based on region, income, age group, and other factors. It also provides specific conversion analytics that helps marketing managers determine what needs to be improved or how a campaign is performing in general before deciding whether or not to change its path during its life cycle. In this method, initial investments will yield higher results.
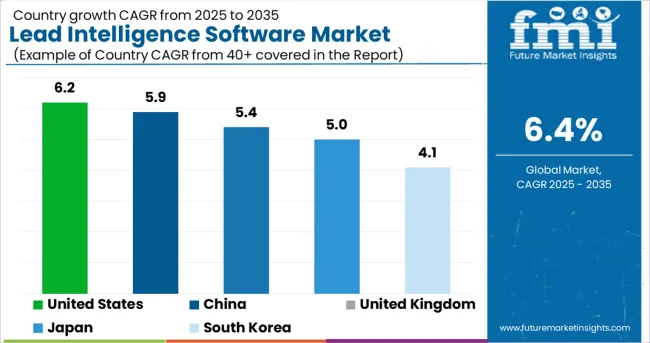
| Regions | CAGR (2025 to 2035) |
|---|---|
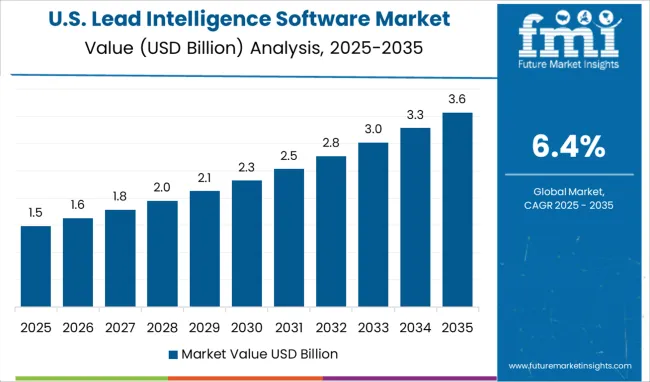
| United States | 6.2% |
| United Kingdom | 17.2.4% |
| China | 17.2.9% |
| Japan | 17.2% |
| South Korea | 4.1% |
Countries like the USA and Canada dominate the North American market for lead intelligence software.
Due to a high penetration rate of computer hardware devices and mobile devices and the availability of internet connectivity across different states within the country with only a few restrictions on their use at workplaces or homes, the USA represents one of the largest markets in terms of revenue, with a market value of USD 17.2 billion by 2035, which further increases demand from SMEs and large enterprises.
Companies are still concerned about lead generation. This is one of the primary drivers of the lead-generating software market's expansion in Europe. The UK is anticipated to have a market value of USD 17.2 billion through 2035.
Other important drivers that have helped this region's Lead Intelligence Software Market expand over the previous few years include the requirement for efficient sales process management and increased demand from SMEs for high-quality leads.
China, India, and Japan are the three biggest markets for lead intelligence software in the Asia Pacific. Japan is anticipated to have a market value of USD 847.3 Billion during the forecast period.
Cloud-based sales process management systems are in high demand in the region since they can help firms simplify their lead generation and provide them with a more robust system for managing end-to-end sales processes than on-premises solutions can.
Companies in Latin American countries such as Argentina, Brazil, and Mexico have been rapidly embracing Lead Intelligence Software to improve their overall sales process management. Due to the increased acceptance of internet connectivity across various organizations in the area, there is a growing demand for cloud-based lead intelligence software solutions in the region.
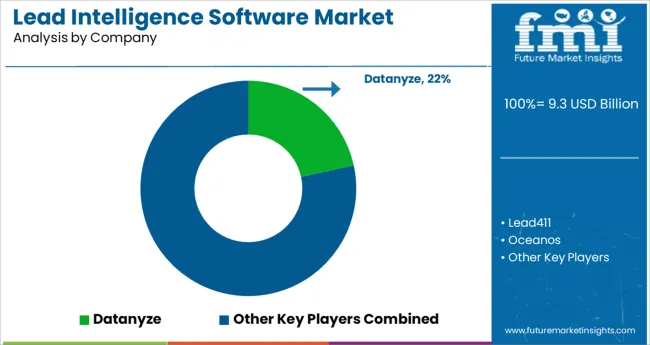
The lead intelligence software market report's competitive scenario analyses evaluate, and position firms based on a variety of performance factors. The financial performance of organizations over the last few years, product innovations, new product launches, growth plans, investments, market share growth, and so on are some of the elements analyzed in this research.
The majority of competition among lead intelligence software is based on providing innovative and efficient services. The data demonstrates how competitors are profiting from the lead intelligence software market. Major collaborations, mergers, and acquisitions, as well as current innovation and business practices, are all priorities for key participants.
The global lead intelligence software market is estimated to be valued at USD 9.3 billion in 2025.
It is projected to reach USD 17.2 billion by 2035.
The market is expected to grow at a 6.4% CAGR between 2025 and 2035.
The key product types are on-premises and cloud-based.
large enterprises segment is expected to dominate with a 57.4% industry share in 2025.


Full Research Suite comprises of:
Market outlook & trends analysis
Interviews & case studies
Strategic recommendations
Vendor profiles & capabilities analysis
5-year forecasts
8 regions and 60+ country-level data splits
Market segment data splits
12 months of continuous data updates
DELIVERED AS:
PDF EXCEL ONLINE
Lead-free Brass Rods Market Size and Share Forecast Outlook 2025 to 2035
Lead Acid Battery Market Size and Share Forecast Outlook 2025 to 2035
Lead Acid Battery Recycling Market Size and Share Forecast Outlook 2025 to 2035
Lead Smelting and Refining Market Size and Share Forecast Outlook 2025 to 2035
Lead Management Market Size and Share Forecast Outlook 2025 to 2035
Leadership Development Program Market Analysis - Size, Share, and Forecast 2025 to 2035
Lead Market Growth - Trends & Forecast 2025 to 2035
Examining Market Share Trends in Leadership Development Programs
Lead Zirconate Titanate Market Size & Trends 2025
Lead Stearate Market
Leadscrew Market
Lead Mining Software Market Size and Share Forecast Outlook 2025 to 2035
Lead Capture Software Market Size and Share Forecast Outlook 2025 to 2035
Lead Scoring Software Market Size and Share Forecast Outlook 2025 to 2035
Lead-to-Account Matching and Routing Software Market Size and Share Forecast Outlook 2025 to 2035
KNN Lead-free Piezoelectric Ceramics Market Size and Share Forecast Outlook 2025 to 2035
BNT Lead-free Piezoelectric Ceramics Market Size and Share Forecast Outlook 2025 to 2035
Online Leadership Development Program Market Forecast and Outlook 2025 to 2035
Custom Leadership Development Program Market Growth, Trends and Forecast from 2025 to 2035
Europe Leadership Development Program Market - Growth & Demand 2025 to 2035

Thank you!
You will receive an email from our Business Development Manager. Please be sure to check your SPAM/JUNK folder too.
Chat With
MaRIA